*NURSING > STUDY GUIDE > NURS 401 Lecture 7 10.14.15 (All)
NURS 401 Lecture 7 10.14.15
Document Content and Description Below
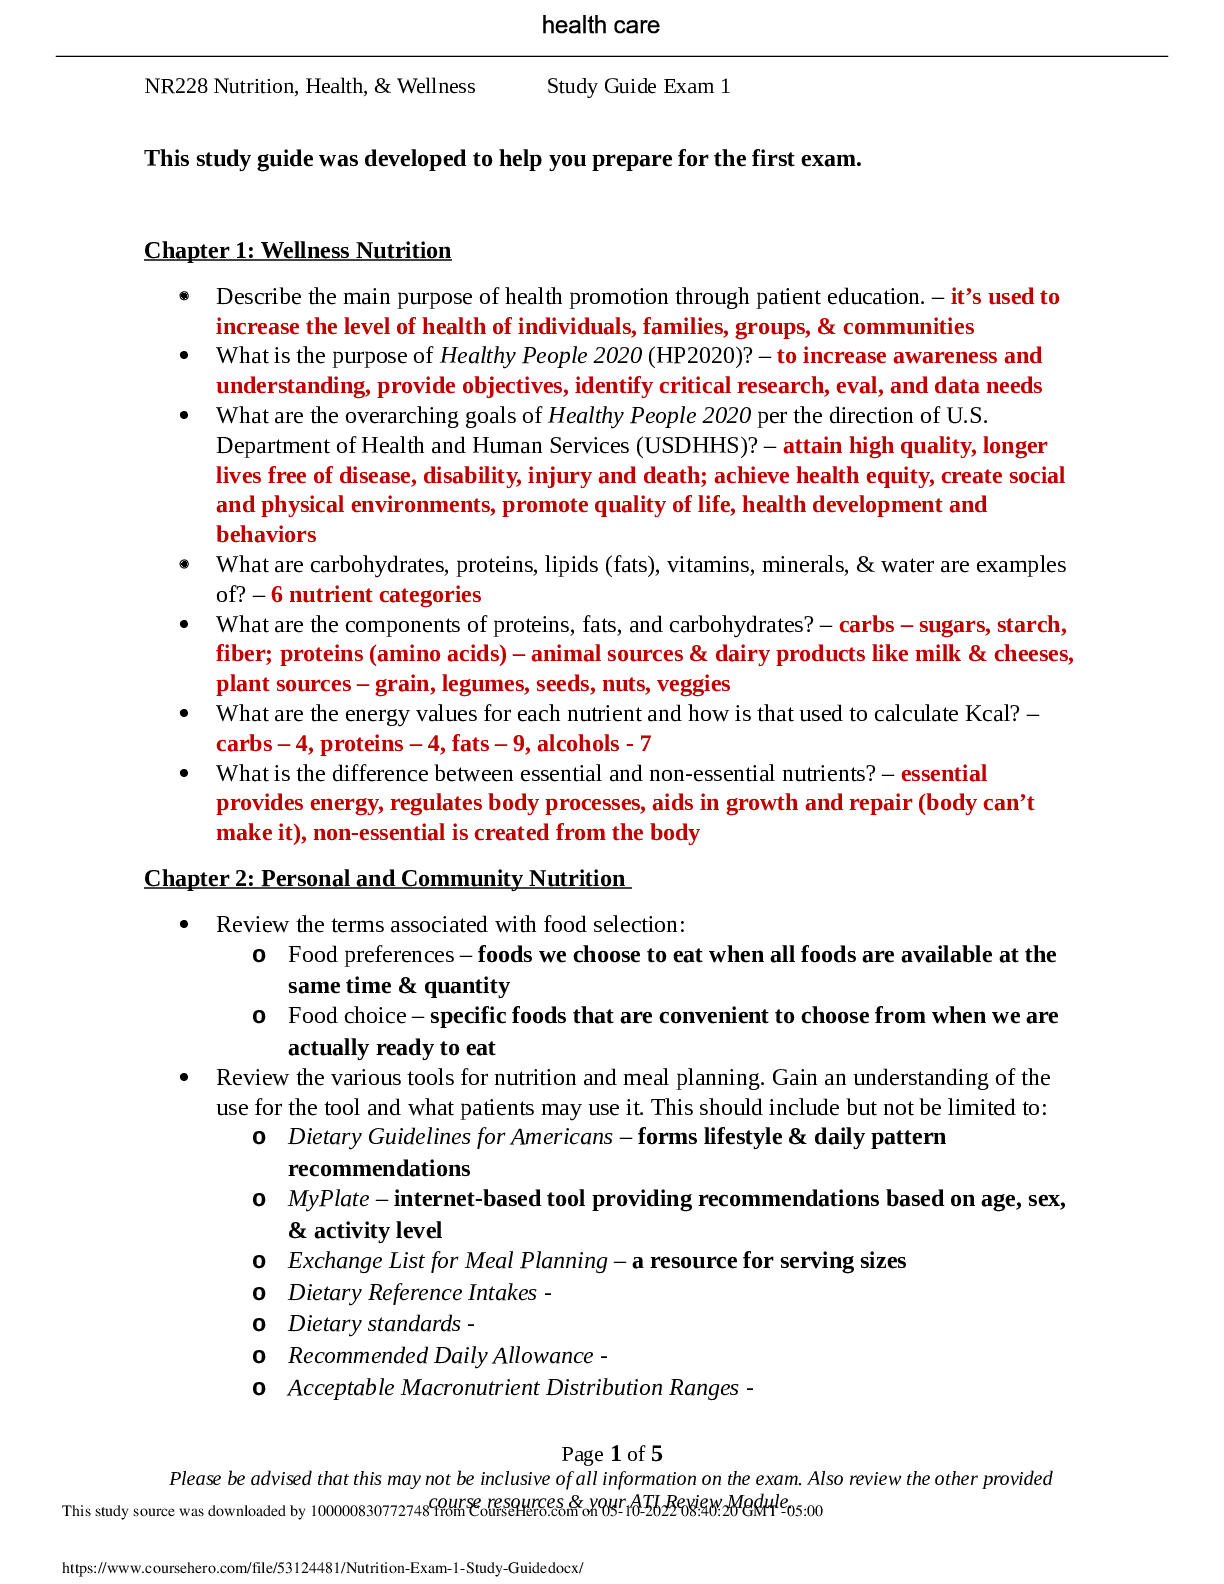
Characteristics of the Older Population Young-old: 60 to 74 years o Example: a 66-year-old may desire cosmetic surgery to stay competitive in the executive job market Middle-old: 75 to 84 ... years o Ex: a 74-year-old may have recently remarried and want to do something about her dry vaginal canal Old-old: 85 to 100 years o Ex: 82-year-old may be concerned that his arthritic knees are limiting his ability to play a round of golf Centenarians: over 100 years o Ex: 101-year-old may be desperate to find a way to correct her impaired vision so that she can enjoy television. Profile, interests, and health care challenges vary with each subset Baby Boomers Individuals born between 1946 to 1964-Post WWII January 1, 2011, beginning of baby boomers turning 65. Every day 10,000 baby boomers turn age 65. Diverse group Better educated-GI bill provided education Enamored with “high-tech” products Inventors of “fitness movement” Informed consumers Will demand changes in long-term care Baby Boomer- a big Drug culture. Health issues in elderly people that that era. Myths of Aging Myths of Aging o “You can’t teach an old dog new tricks” o “Dirty old man” o Disease and disability are an inevitable part of aging o Health promotion is wasted on older people o The elderly do not pull their own weight Myths of aging lead to: o Ageism o Reduced healthcare services o Segregation of elders from mainstream society Attitudes and Stereotypes towards Older Adults • Ageism: Discrimination that often accompanies old age and is based solely on age. The idea that people cease to the same or become inferior based on age Can Cause: • Reduced health care from providers of care • Less health education and teaching • May be regarded as not eligible for certain therapies or programs ex: rehab, certain types of surgeries • Treated socially and medically based on myths and stereotypes Population Growth and Increasing Life Expectancy • Persons 65+ currently represent more than 12% of the U.S. population • By 2020, older adults will grow to 17% of the population • Life expectancy has increased: – 1930: 59.7 years – 1965: 70.2 years – Present: 77.8 years • Population over 85 years, ~40% • Centenarians increasing Indicator 1 - Number of Older Americans Demographic & Epidemiological Factors • Decreased in infant mortality rates since turn of the century-past century – Better NICU services • “Control” of infectious diseases – More vaccines being administered now like flu • Improved sanitation • Better living conditions • Behavioral or lifestyle changes – No more smoking in hospitals Gender, Marital Status and Living Arrangements • Older women comprise 58% of the population over age 65, and 70% of the population over age 85 • Half of women over 65 are widowed • Majority of men are married • Most older adults live with spouse or other family member • Twice the number of women than men live alone in later life – In past, women would stay home and take care of home, but men goes out and does straneous labor and more subjected to health risks such as working in coal mines and in fields. Men were prone to drinking and smoking due to labor. [Show More]
Last updated: 1 year ago
Preview 1 out of 30 pages
.png)
Reviews( 0 )
Document information
Connected school, study & course
About the document
Uploaded On
May 07, 2022
Number of pages
30
Written in

Additional information
This document has been written for:
Uploaded
May 07, 2022
Downloads
0
Views
52


.png)


.png)