Microeconomics > QUESTIONS & ANSWERS > California State University, San Marcos ECON 201 Micro Economics Eco 201 Quizz 3 (All)
California State University, San Marcos ECON 201 Micro Economics Eco 201 Quizz 3
Document Content and Description Below
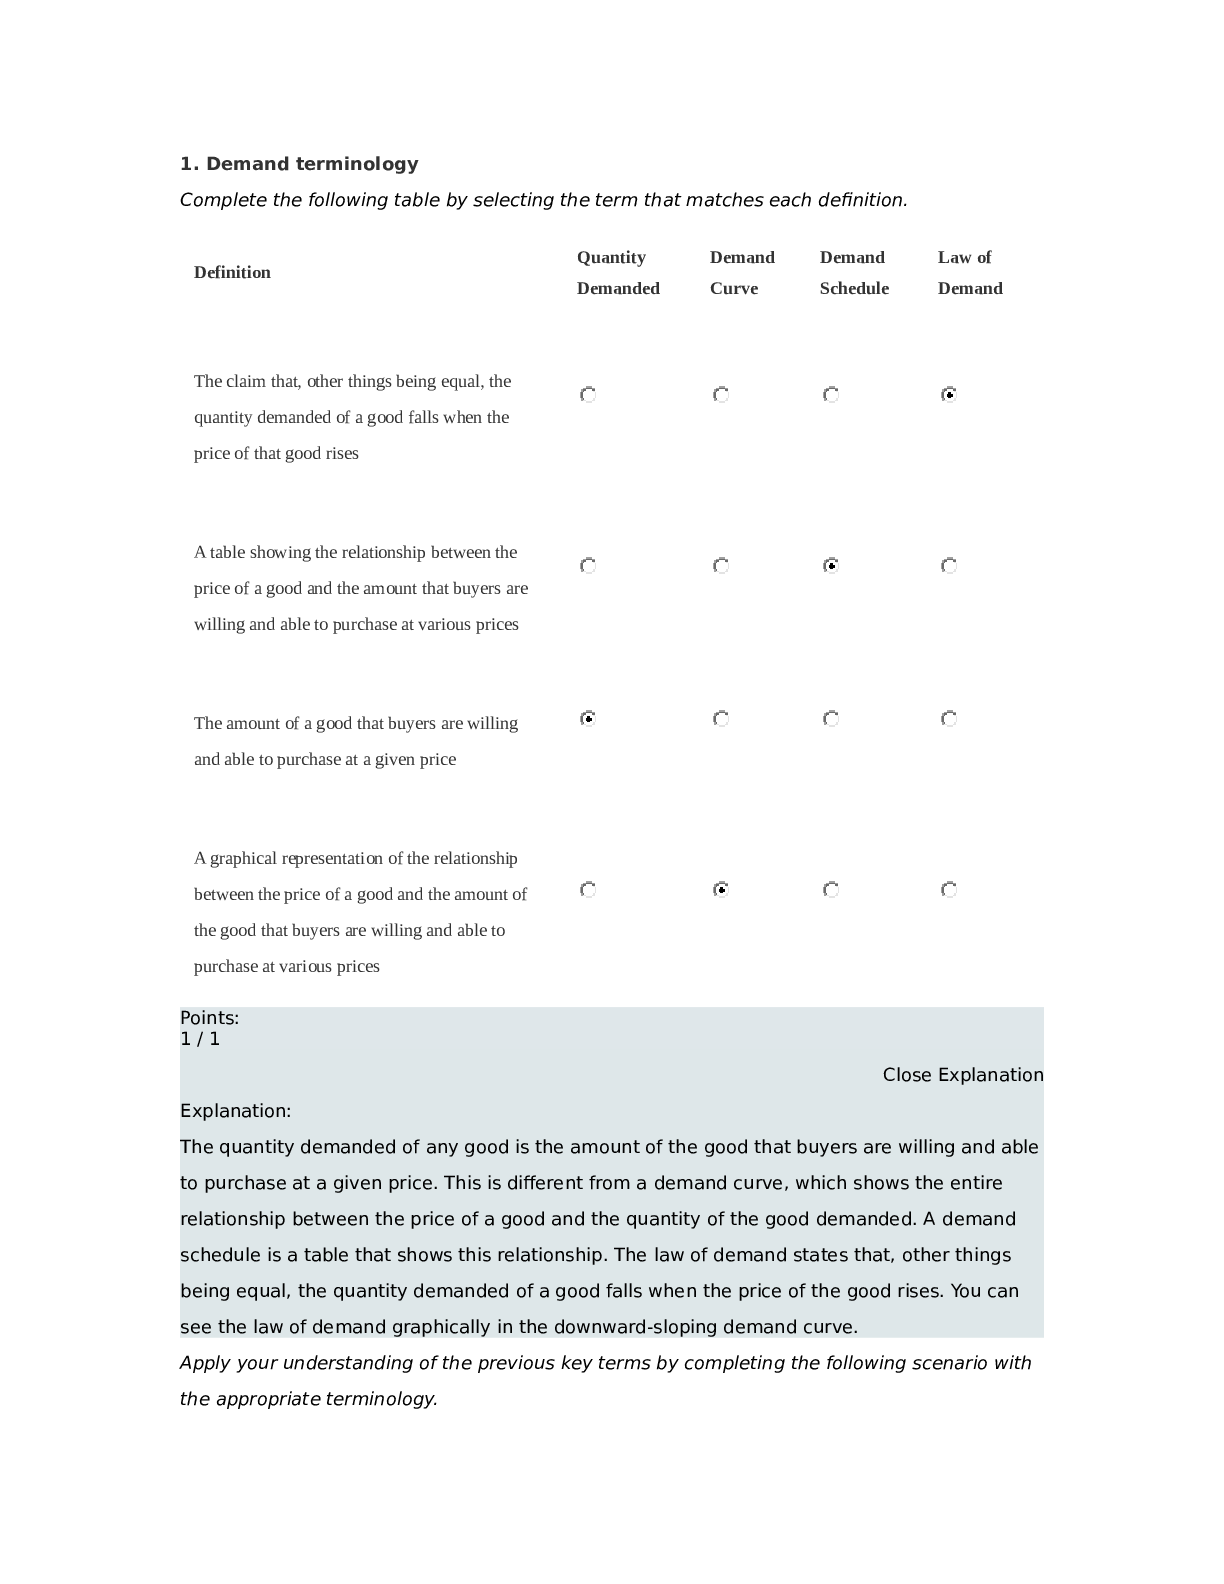
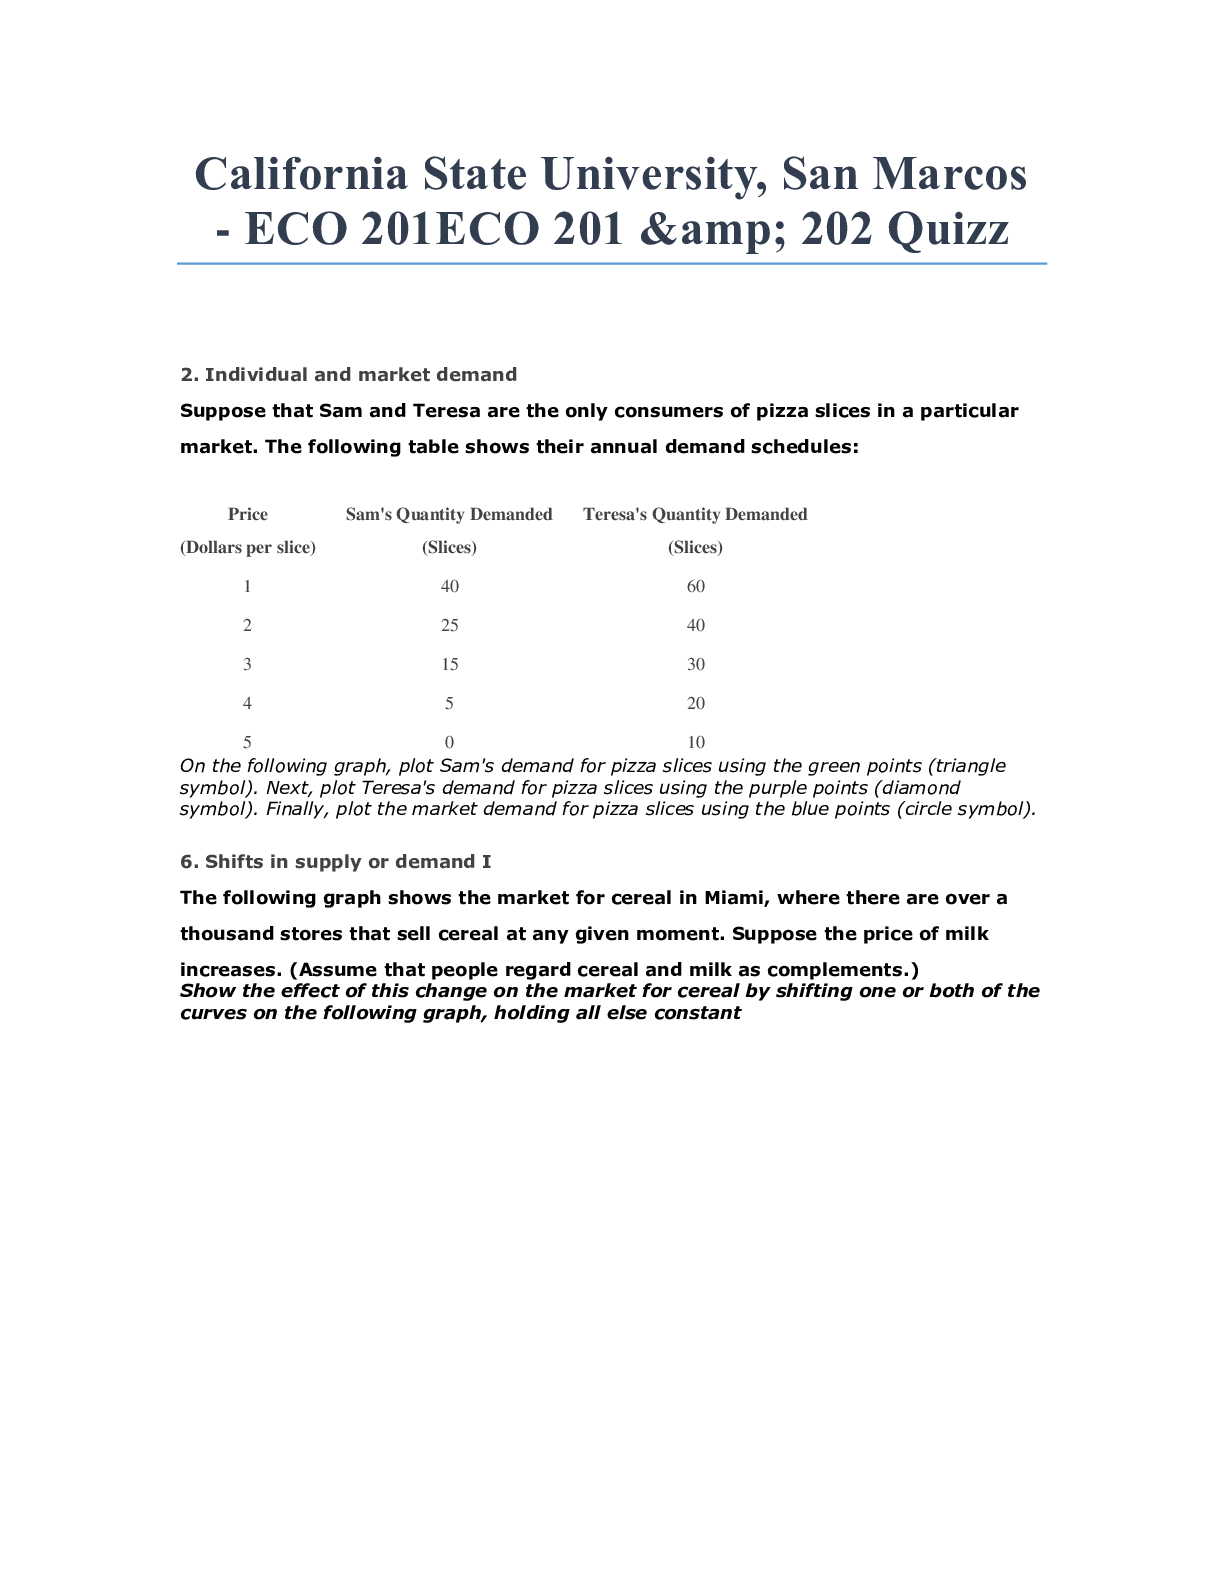
1. Demand terminology Complete the following table by selecting the term that matches each definition. Definition Quantity Demanded Demand Curve Demand Schedule Law of Demand The claim that... , other things being equal, the quantity demanded of a good falls when the price of that good rises A table showing the relationship between the price of a good and the amount that buyers are willing and able to purchase at various prices The amount of a good that buyers are willing and able to purchase at a given price A graphical representation of the relationship between the price of a good and the amount of the good that buyers are willing and able to purchase at various prices Points: 1 / 1 Close Explanation Explanation: The quantity demanded of any good is the amount of the good that buyers are willing and able to purchase at a given price. This is different from a demand curve, which shows the entire relationship between the price of a good and the quantity of the good demanded. A demand schedule is a table that shows this relationship. The law of demand states that, other things being equal, the quantity demanded of a good falls when the price of the good rises. You can see the law of demand graphically in the downward-sloping demand curve. Apply your understanding of the previous key terms by completing the following scenario with the appropriate terminology.Your boss would like your help on a marketing research project she is conducting on the relationship between the price of juice and the quantity of juice demanded. He hands you the following document: Price of Juice Quantity of Juice Demanded (Dollars per can) (Billions of cans) 0.50 2,000 0.75 1,500 1.00 1,000 1.25 750 Your task is to take this selector 1 demand schedule and construct a graphical representation of the data. In doing so, you determine that as the price of juice rises, the quantity of juice demanded decreases. This confirms the selector 2 law of demand Points: 1 / 1 Close ExplanationExplanation: The table your boss provided shows the relationship between the price of juice and the amount of juice that buyers are willing and able to purchase over a range of prices. This is known as a demand schedule. The graphical representation of these data is known as a demand curve. By plotting these data with price along the vertical axis and quantity along the horizontal axis, you see that the demand curve is downward sloping: Created with Raphaël 2.1.2025050075010001250150017502000225025001.501.251.000.750.500.250PRICE (Dollars per can)QUANTITY (Billions of cans)Demand Created with Raphaël 2.1.2 This indicates that the quantity of juice demanded falls when the price of juice rises, also known as the law of demand. 2. Individual and market demand Suppose that Charles and Dina are the only consumers of pizza slices in a particular market. The following table shows their annual demand schedules: Price Charles's Quantity Demanded Dina's Quantity Demanded (Dollars per slice) (Slices) (Slices) 1 40 80 2 25 60 3 15 40 4 5 30 5 0 20 On the following graph, plot Charles's demand for pizza slices using the green points (triangle symbol). Next, plot Dina's demand for pizza slices using the purple points (diamond symbol). Finally, plot the market demand for pizza slices using the blue points (circle symbol).Points: 1 / 1 Close Explanation Explanation: Each point on an individual's demand curve corresponds to one of the entries in the individual’s demand schedule. For example, when the price of pizza is $1, Charles demands 40 slices per year, and Dina demands 80 slices per year. Therefore, the point (40, 1) lies on Charles's demand curve, and the point (80, 1) lies on Dina's demand curve. [Show More]
Last updated: 1 year ago
Preview 1 out of 26 pages
Reviews( 0 )
Document information
Connected school, study & course
About the document
Uploaded On
Oct 04, 2022
Number of pages
26
Written in

Additional information
This document has been written for:
Uploaded
Oct 04, 2022
Downloads
0
Views
63


.png)