Biology > QUESTIONS & ANSWERS > Questions and Answers > University of Michigan BIOLOGY 305 F19_DS5_Quantitative Traits__KEY (All)
Questions and Answers > University of Michigan BIOLOGY 305 F19_DS5_Quantitative Traits__KEY
Document Content and Description Below
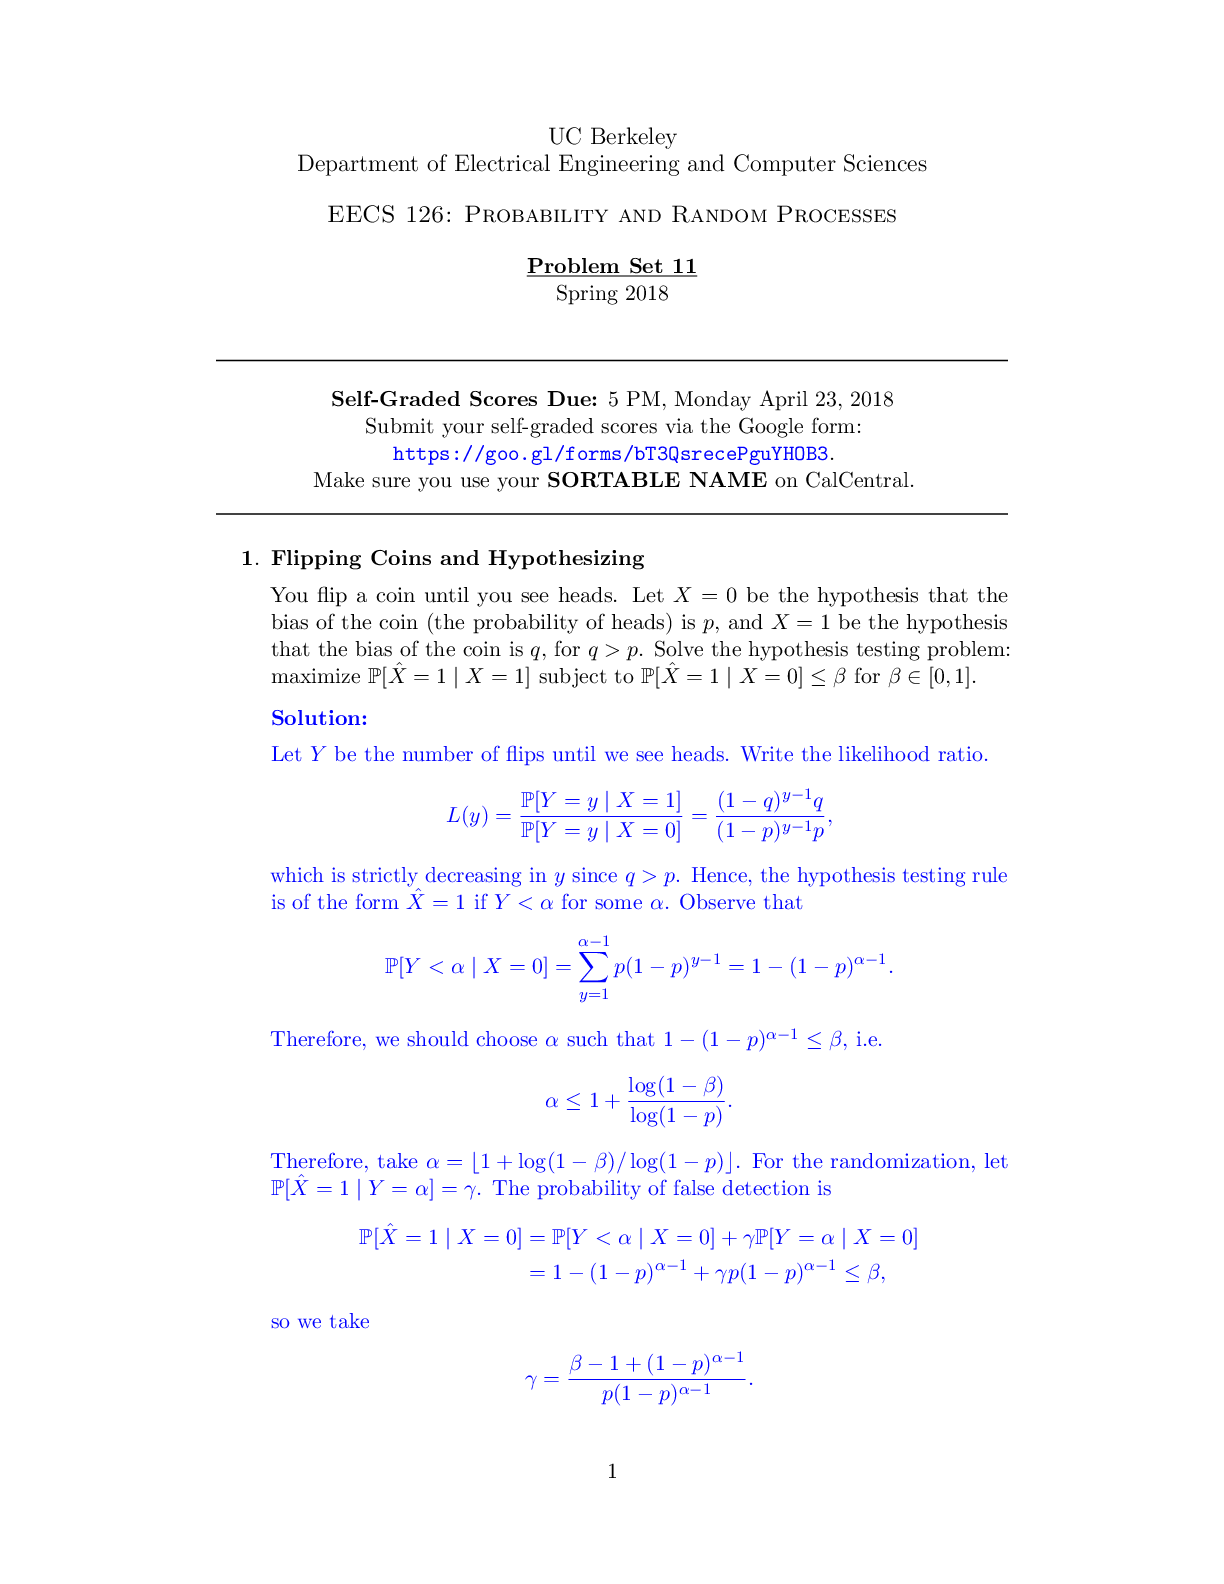
BIOLOGY 305 F19_DS5_Quantitative Traits__KEY Discussion 5 Bio 305 - Genetics Fall 2019 Quantitative Traits_KEY Part 1 – Quantitative Traits Assume that the height of tobacco plants is controlled... by five genes. Two different alleles exist for genes A, B, C, and D, but only one allele for gene E is present in the population. The effect of each genotype on height is listed below. Total height is the sum of the effects of each of these five genes. Gene A Gene B Gene C Gene D Gene E AA + 6 cm BB + 10 cm CC + 8 cm DD + 2 cm EE + 40 cm Aa + 3 cm Bb + 5 cm Cc + 5 cm Dd + 2 cm aa + 0 cm bb + 0 cm cc + 2 cm dd + 0 cm a. Which genes show additivity between alleles? b. What is the maximum height possible in the population and which genotypes will have this phenotype? c. What phenotypes (and in what ratios) will be observed among offspring from the following cross: AABBCcDDEE x AABBCcDDEE? d. What fraction of progeny produced from the following cross will be exactly 42 cm tall: AaBbCcddEE x AaBbCcddEE? 2. Association Mapping. You are investigating the genetic basis of cholesterol level in human populations. You measure the blood cholesterol level in 10 individuals shown below. Each individual is genotyped for molecular markers M1-M11. Each marker has two possible genotypes, which you decide to record as 0 or 1. (For example, A = 0 and a = 1.) Your data are summarized in the table below. cholestero l M1 M2 M3 M4 M5 M6 M7 M8 M9 M10 M11 For each marker, compute the average phenotype of the two genotypic classes. Plot these data on the graph below. (Data for marker 1 is shown.) Average Cholesterol level Marker Genotype 0 1 Given the following map of molecular markers, indicate the most likely location of the ONE QTL in this region: M1 M2 M3 M4 M5 M6 M7 M8 M9 M10 M11 Part 2 – Heritability of complex traits 3. The table below shows a distribution of bristle number in a Drosophila population. Calculate the Mean, Variance and Standard deviation for bristle number. Bristle # # of individuals 4. You want to find the genes responsible for obesity and decide to use a mouse model. Weight is a complex trait affected by both the environment and genetics. You have two inbred (homozygous) lines of mice available. When individuals from these lines are raised in the same cage, with the same access to food, they weight different amounts. You cross females from the “skinny” line to males of the “obese” line. The F1 progeny have an intermediate weight. You intercross the F1 mice to measure heritability and backcross one of the F1 mice to the skinny line to map genes that affect weight. The following data were observed: Mean weight of inbred (i.e. homozygous) mice from the “skinny” line: 100 g Mean weight of inbred mice from the “obese” line: 200 g Average weight of F1 mice: 155 g Variance of weights among F1 mice: 98 g2 Mean weight of F2 mice: 155 g Variance of weights among F2 mice: 203 g2 Why aren’t all F1 mice, which are genetically identical, exactly the same weight? b. What is the broad-sense heritability (H2) of weight in these mice? Fat content is another complex trait with continuous distribution that contributes to obesity. The average body fat content of the obese line of mice is 40%. In a test to determine if the average fat content of the line can be decreased by selective breeding, mice with an average fat content of 30% are removed and allowed to interbreed. Their progeny have an average fat content of 36%. c. What is the narrow-sense heritability (h2) for fat content in this population? In addition, the shank length and tail length of these mice were measured and the narrow-sense heritability was determined to be 0.15 and 0.01, respectively. d. In the population studied, which character (fat content, shank length, tail length would respond best to selection? Which would respond least? Why? [Show More]
Last updated: 1 year ago
Preview 1 out of 4 pages

Reviews( 0 )
Document information
Connected school, study & course
About the document
Uploaded On
Aug 11, 2022
Number of pages
4
Written in

Additional information
This document has been written for:
Uploaded
Aug 11, 2022
Downloads
0
Views
32


.png)


 Problem Set 4.png)