Earth Science > QUESTIONS & ANSWERS > Questions and Answers > University of British Columbia - EOSC 114; Volcano Homework. (All)
Questions and Answers > University of British Columbia - EOSC 114; Volcano Homework.
Document Content and Description Below
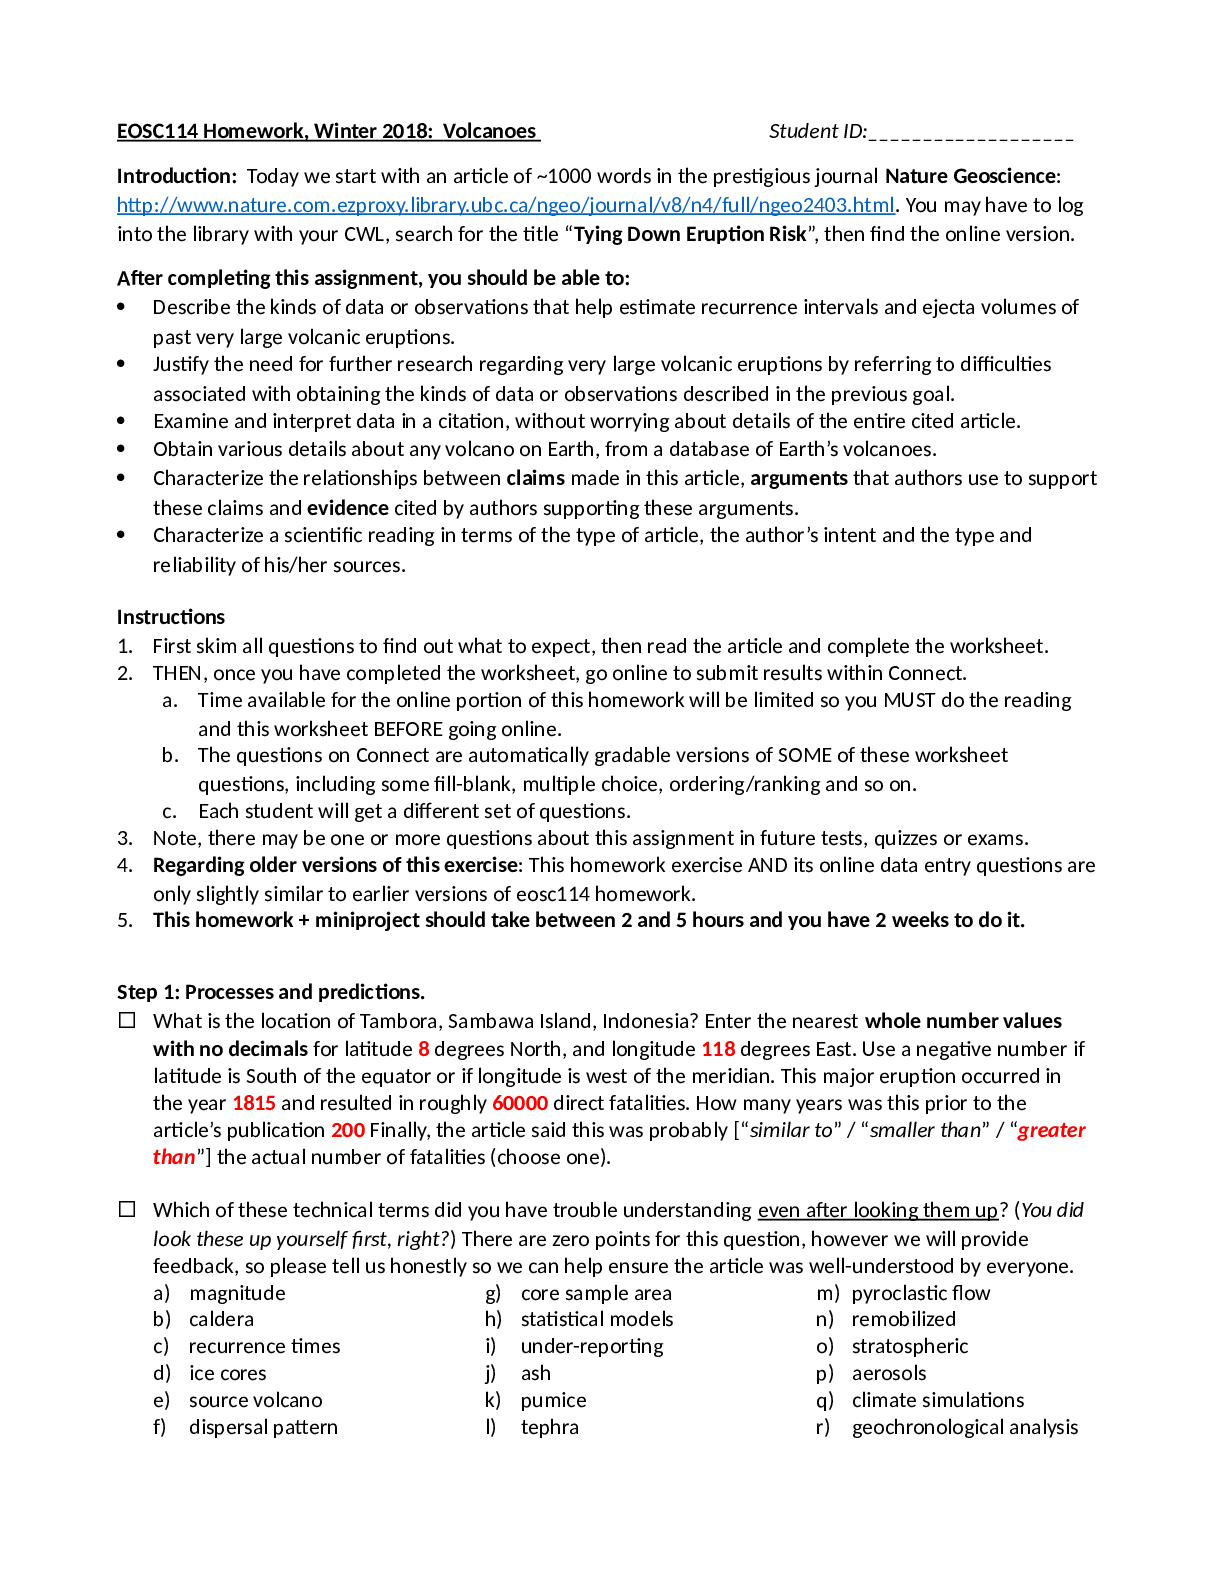
EOSC114 Homework, Winter 2018: Volcanoes Student ID:___________________ Introduction: Today we start with an article of ~1000 words in the prestigious journal Nature Geoscience: http://www.nature.co... m.ezproxy.library.ubc.ca/ngeo/journal/v8/n4/full/ngeo2403.html. You may have to log into the library with your CWL, search for the title “Tying Down Eruption Risk”, then find the online version. After completing this assignment, you should be able to: Describe the kinds of data or observations that help estimate recurrence intervals and ejecta volumes of past very large volcanic eruptions. Justify the need for further research regarding very large volcanic eruptions by referring to difficulties associated with obtaining the kinds of data or observations described in the previous goal. Examine and interpret data in a citation, without worrying about details of the entire cited article. Obtain various details about any volcano on Earth, from a database of Earth’s volcanoes. Characterize the relationships between claims made in this article, arguments that authors use to support these claims and evidence cited by authors supporting these arguments. Characterize a scientific reading in terms of the type of article, the author’s intent and the type and reliability of his/her sources. Instructions 1. First skim all questions to find out what to expect, then read the article and complete the worksheet. 2. THEN, once you have completed the worksheet, go online to submit results within Connect. a. Time available for the online portion of this homework will be limited so you MUST do the reading and this worksheet BEFORE going online. b. The questions on Connect are automatically gradable versions of SOME of these worksheet questions, including some fill-blank, multiple choice, ordering/ranking and so on. c. Each student will get a different set of questions. 3. Note, there may be one or more questions about this assignment in future tests, quizzes or exams. 4. Regarding older versions of this exercise: This homework exercise AND its online data entry questions are only slightly similar to earlier versions of eosc114 homework. 5. This homework + miniproject should take between 2 and 5 hours and you have 2 weeks to do it. Step 1: Processes and predictions. What is the location of Tambora, Sambawa Island, Indonesia? Enter the nearest whole number values with no decimals for latitude 8 degrees North, and longitude 118 degrees East. Use a negative number if latitude is South of the equator or if longitude is west of the meridian. This major eruption occurred in the year 1815 and resulted in roughly 60000 direct fatalities. How many years was this prior to the article’s publication 200 Finally, the article said this was probably [“similar to” / “smaller than” / “greater than”] the actual number of fatalities (choose one). Which of these technical terms did you have trouble understanding even after looking them up? (You did look these up yourself first, right?) There are zero points for this question, however we will provide feedback, so please tell us honestly so we can help ensure the article was well-understood by everyone. a) magnitude b) caldera c) recurrence times d) ice cores e) source volcano f) dispersal pattern g) core sample area h) statistical models i) under-reporting j) ash k) pumice l) tephra m) pyroclastic flow n) remobilized o) stratospheric p) aerosols q) climate simulations r) geochronological analysis What is the plate-tectonic setting of the Kuwae volcano in Vanuatu? Look this up by searching the internet (watch your spelling carefully); the online question will be multiple choice. Convergent Subduction Tell us where you found this information by entering the URL of the page (or name of the book or other resource) where you found the answer. http://volcano.oregonstate.edu/vwdocs/volc_images/australia/vanuatu/vanuatu.html All these points are real difficulties associated with understanding very large volcanic events. Which one represents the most fundamental or overarching difficulty with determining recurrence interval? (NOTE: for most multiple choice questions, options will be in random order on CONNECT.) o Locations of submarine volcanic caldera may be hard to identify. o Large volcanic events are rare o The size of calderas may be the result of several eruptions. o Thorough geochronological analysis of eruption deposits is rare. ???? o Not all volcanoes emit enough sulphur to cause acidity spikes in ice cores o Detecting events in ice cores does not yield an origin or source of the event o Erupted ash or pumice may become dispersed or redistributed by various process during eruption o Similarly, which one of the SAME difficulties represents the most fundamental or overarching difficulty with estimating volume of ejected materials? Erupted ash or pumice may become dispersed or redistributed by various process during eruption o How long ago does the article say these very large eruptions occurred? Kikai; roughly 7300 yrs ago; Santorini; roughly 3600 yrs ago; Samalas; roughly 758 yrs ago; Kuwae; roughly 563 yrs ago; Tambora; roughly 200 yrs ago What three factors will have some influence on whether ash will show up in an ice core; pick three of the six only. o amount of erupted ash o recurrence interval o volume of sulphur emitted o ash dispersal pattern o extent of core sample area o acidity of ice layer This course addresses the following four aspects of natural hazards. Which one of them does this article concentrate on the MOST? o anticipating consequences o identifying appropriate mitigation strategies. o describing geological processes o predicting time/place of hazardous events o Which of these same four aspects does this article concentrate on the LEAST? identifying appropriate mitigation strategies. . Step 2, characterizing the article Scientific understanding or information can be obtained from many types of sources. In this section we will consider the author’s intentions, the types of sources used to support their arguments or “story”, and how evidence was used in those arguments. Choose Yes, No, or “Can’t tell” for each “characteristic” of the article we’ve read: o Is our article about a new previously unpublished method, knowledge or content, presented directly by those responsible for discovering it? Y / N / Can’t tell o Are the authors of our reading presenting a “message” based on use of work done by other author(s)? Y / N / Can’t tell o Is the central message of our paper constructed by gathering work done from pre-existing literature and/or other sources? Y / N / Can’t tell o Is our reading mainly targeting a general non-scientific audience? Y / N / Can’t tell o Is the content in our reading presented in non-technical manner, without presenting a complete "chain of evidence" in the form of references and citations? Y / N / Can’t tell o Is this article published in a “peer reviewed journal” (disregarding comments from an editor)? Y / N / Can’t tell Which one of these options most accurately characterizes the main purpose of this article? o News for public o Social commentary o A report written to address the needs of a client or other third party who may have asked for it. o Communication to experts in the subject, about new scientific methods, procedures or discoveries o A commentary or report aimed at making recommendations about priorities, policy, or decision making o A communication about science written to inform non-specialists Review the brief summary of three reference source types at http://scwrl.ubc.ca/student-resources/finding-identifying-and-citing-sources/identifying-different-types-ofsources/. THEN, based on your choices above and that summary of source types, what kind of reference is our article best described as? a) primary b) secondary c) tertiary What types of sources were used by the author(s)? (Hint: Note that formal communications of technical or scientific information are usually either secondary or primary sources. This may include - but is not limited to – conference proceedings, “reports”, theses or dissertations (PhD or MSc), “special publications”, and so on.) o One or more citations of primary or secondary sources were included in a reference list. True or False? o A bibliography with resources NOT cited in the article was included. True or False? o One or more citations of tertiary sources were included in a reference list. True or False? o One or more direct quotes from named "experts" were used as sources by this author. True or False? o Work of experts was referenced in the writing but not cited in a reference list. True or False? o One or more direct quotes from "non-experts" were used as sources by this author. True or False? What writing strategies were used in this article? (On Connect watch carefully to ensure you are answering each question correctly - they may be offered in a different order.) o Assertions and arguments were supported by evidence based on observations, measurements or experiments done by scientists other than the author(s); Y / N / Can’t tell. o Assertions and arguments were supported by evidence based on scientific observations, measurements or experiments done primarily by the author(s); Y / N / Can’t tell. o Narrative or personal stories were incorporated into the article; Y / N / Can’t tell. o The author(s) targeted human emotion as part of their writing strategies; Y / N / Can’t tell. o Descriptions of "aesthetic" aspects like scenes, views and impressions were included; Y / N / Can’t tell. o The author(s) identified at least some uncertainties, incomplete aspects or needs for further work; Y / N / Can’t tell. An essential characteristic of scientific writing is that authors will make (or state) claims and argue for those claims using arguments consisting of logic and reasoning that depends upon reproducible observations, evidence and data. (Hint: You might want to review definitions of “hypothesis” and “theory”). This claim from our article: “We need better records of size and occurrence if we are to predict future large eruptions more accurately” might best be described as … i) an hypothesis suggesting ‘why’ or ‘how’ that needs to be tested by experiment or observation; ii) an observation or something measured or “noticed”; iii) an estimate based on calculations using parameters and assumptions that could be varied to yield a range of values iv) an ‘understanding’, conclusion or theory derived from a range of observations and/or experiments and logical inferences. This claim from our article: “On 10 April 1815, the volcano Mount Tambora, on Sumbawa Island in Indonesia, erupted violently” might best be described as … an observation or something measured or “noticed”; (same 4 options). Which one of these statements most clearly articulates the overarching claim of this article? o single huge eruptions can impact people all over the world o the number of fatalities directly attributable to magnitude 6 or more volcanoes can be huge. o Kuwae was discovered by finding a relatively young caldera and identifying volcanism-induced acidity spike in ice-core records o We need better records of size and occurrence if we are to predict future large eruptions more accurately o Statistical models have yielded estimates of the recurrence interval for very large eruptions Which of these claims were supported with arguments or discussions presented in this article? Was the claim: “Tambora is probably the largest caldera-forming eruption of the last few centuries” supported by argument, discussion or a citation in the article? Y / No, the claim was just stated. Was the claim: “estimates of the recurrence interval for Tambora-size eruptions range from 780 years for low-end approximations” supported by argument, discussion or a citation in the article? Y / No, the claim was just stated. For each question, is the statement given in italics part of an argument that supports the corresponding claim (paraphrased from the article)? Is the statement “Climate change is affecting our abilities to estimate size and recurrence intervals” part of an argument that supports the claim “We need better records of size and occurrence if we are to predict future large eruptions more accurately”? Y / N, that statement does not support the given claim / Can’t tell. Is the statement “60,000 deaths were attributed to Tambora eruption” part of an argument that supports the claim “large eruptions can have devastating impacts, including some that last beyond the eruption event.”? Y / N, that statement does not support the given claim / Can’t tell. Estimating the volume of material erupted is challenging. Which of the following reasons contributing to this claim were discussed in the article? Eruptions may be so strong that solid material is blown into the atmosphere and carried away. Was this mentioned in our article as a reason why estimating erupted volume is challenging? i) Yes - was discussed in our article ii) No - was NOT mentioned in our article Ejected ash, rock fragments and particles that land on the volcano’s flanks tend to erode quickly. Was this mentioned in our article as a reason why estimating erupted volume is challenging? i) Yes - was discussed in our article ii) No - was NOT mentioned in our article In some cases, ejected ash, rock fragments and particles land on the sea and either sink or get carried away by currents. Was this mentioned in our article as a reason why estimating erupted volume is challenging? i) Yes - was discussed in our article ii) No - was NOT mentioned in our article The sulphur content of ejecta is not easily associated with ejecta volume. Was this mentioned in our article as a reason why estimating erupted volume is challenging? i) Yes - was discussed in our article ii) No - was NOT mentioned in our article The thickness of ash found in ice-core lanyers is poorly correlated with eruption volume. Was this mentioned in our article as a reason why estimating erupted volume is challenging? i) Yes - was discussed in our article ii) No - was NOT mentioned in our article Was each of these arguments supported by describing or citing data, methods, or people responsible for the information? (HINT: use “search” in the article, to find each of these phrases.) Was the argument "During eruptions, ash, pumice and hot gases can be ejected upwards into the atmosphere in an eruption column and outwards along the volcano flanks in the form of a pyroclastic flow. " supported by describing or citing data, methods, or people responsible for the information? Y / No, data or methods were neither mentioned nor referenced / Can’t tell. Was the argument "…Kikai eruption that occurred offshore from Japan 7,300 years ago was almost certainly larger. " supported by describing or citing data, methods, or people responsible for the information? Y / No, data or methods were neither mentioned nor referenced / Can’t tell. Was the argument "The event was the most disastrous volcanic eruption in recent history. " supported by describing or citing data, methods, or people responsible for the information? Y / No, data or methods were neither mentioned nor referenced / Can’t tell. Consider the various types of data mentioned in our article: What kind of data do you think “acidity of ice” would most reasonably described as? i) Measured ii) observed iii) simulated, modelled or calculated iv) gathered v) not really data What kind of data do you think “number of deaths on Sumbawa and neighbouring islands” would most reasonably described as? i) Measured ii) observed iii) simulated, modelled or calculated iv) gathered v) not really data What kind of data do you think “dispersal patterns of the ash and pumice, or tephra,” would most reasonably described as? i) Measured ii) observed iii) simulated, modelled or calculated iv) gathered v) not really data What kind of data do you think “magnitude of an eruption,” would most reasonably described as? i) Measured ii) observed iii) simulated, modelled or calculated iv) gathered v) not really data Which of the following is a reason presented to support the claim that “single huge eruptions can impact people all over the world”? o Sulphur gases leave layers of increased acidity in ice cores. o Global temperatures have been observed to drop following huge eruptions. o Erupted materials are seen to get re-distributed within only a few years after being ejected. o Calderas have been seen to fill, collapse or even coalesce with previous calderas. o Ash fall is known to occur not just adjacent to the eruption but far out to sea as well. Step 3: Data – delving a little deeper into the scientific thinking that backs up the article’s claims. We read an article from the New Yorker for the previous homework assignment. It mentioned sources but did not cite them formally. The present article does cite official peer reviewed, mostly primary references for details about reasons and evidence. We next explore this aspect briefly, but first, which are characteristics of the Kuwae eruption? Compared to the Tambora eruption, the Kuwae eruption size was o larger similar c) smaller d) unknown or not mentioned. Compared to the Tambora’s caldera, the elevation of Kuwae’s caldera rim is now o larger b) similar c) smaller d) unknown or not mentioned. Volume of sulphur from Kuwae was likely o larger b) similar c) smaller d) unknown or not mentioned. Compared to Tambora’s eruption, the article suggests that impacts on humans from Kuwae’s eruption were o larger b) similar c) smaller d) unknown or not mentioned. To more clearly understand the ice core acidity data associated with Kuwae, we must find the corresponding article that was cited. What is the last name of the first author of this reference? Gao, C. et al. J. Geophys. Res. 111, D12107 (2006). Find this article at the link provided here - BUT DO NOT READ IT. WE WILL USE FIGURES ONLY! See http://digitalcommons.library.umaine.edu/cgi/viewcontent.cgi?article=1097&context=ers_facpub Were did ice samples come from? Use the two maps in Figures 1 and 2 to fill in each blank with a NUMBER only. There were 20 locations in the Southern Hemisphere where ice cores were obtained and 12 locations in the Northern Hemisphere. However, based on Figures 3 and 4, only 10 ice courses were used for analysis from the Southern Hemisphere and 10 were used from the Northern Hemisphere. What is the horizontal axis for graphs in Figure 3 and 4? o Time (i.e. years) o Location (i.e. where in the hemisphere) o Acidity o Electrical conductivity o Some other parameter Fill blanks with numbers: Figure 3 shows 7 ice course from the Southern Hemisphere that contain records of “sulfate flux” (i.e. basically the amount of sulphur causing acidity), and 3 ice course that provided records of “electrical conductivity”. Of these ice core records, 6 appear to have increased acidity at times directly related to some event that occurred between 1450 and 1455. Fill blanks with numbers: Figure 4 shows 3 ice course from the north Hemisphere that contain records of sulfate flux, and 7 ice course that provided records of electrical conductivity. Of these ice core records, 6 appear to have increased acidity at times directly related to the same 5-year time interval. Figure 5 represents a compilation of many data sets to emphasize certain interpretations: For how many years following the year of Kuwae’s eruption was the acidity of ice deposited in that year higher than zero in either north or south locations? ○ Less than 1 yr; ○ 1 yr ○ 2 yrs ○ 3 yrs ○ 4 yrs ○ 5 or more yrs. For ice that was made more acid due to Kuwae’s eruption, how did acidity of ice in the northern hemisphere compare to acidity of ice in the southern hemisphere? o More o Similar o Less How did acidity of ice following the Tambora eruption compare to acidity of ice following the Kuwae eruption? o The Kuwae eruption caused ice to be more acid than did the Tambora eruption. o The Kuwae eruption caused ice to be less acid than did the Tambora eruption. o Acidity of ice following BOTH eruptions seems to be roughly similar. o Comparison depends upon the location of the ice. o Comparison depends upon the timing of samples following eruptions. Hopefully this short look at one citation helps you recognize the distinction between (a) a scientific article that uses multiple sources to make an “over-arching” argument versus (b) an article that goes into great depth regarding exactly what was learned from specific observations, experiments, analysis and/or logical discussions. Step 4: a short introduction to a database of global volcanism Let us finish with an introduction to the Smithsonian Institution’s Global Volcanism Program’s web page in order to learn a little more about the Tambora eruption. Go to https://volcano.si.edu/volcano.cfm? vn=264040. You will see a photo with some location details and a Google Map clip, followed by a section headed by nine gray tabs providing access to information. Find the following Some details from this database: From the “Eruptive History” tab, in what year was the most recent confirmed volcanic activity: 1967 From the “Eruptive History” tab, the oldest confirmed volcanic activity was in the year 3050 BCE The type of evidence used for dating the oldest confirmed activity was radiocarbon dating . From the “Geological Summary”, roughly how high in elevation did this volcano become at it’s all-time highest elevation, before forming its caldera and reverting finally to it’s present form? 4000 m. Tambora is considered what type of volcano? stratovolcano Which of the 9 references given in the General Information tab of the Smithsonian institution’s website would you be most interested in pursuing, if you had the time? (Don’t worry – we will not ask you to read any of these!) No correct answer – any choice gains the point. Just write the first author and date. ______________________ Barberi F 1987 _______________________________________________________________ Step 5, feedback. What is one question you would like to ask to help clarify some aspect of this reading? how difficult is it to get these basic measurements for a given volcano? Name one thing that surprised you most that you learned from reading this article. The size of volcanoes For which of the questions in this worksheet are you MOST likely to look at the feedback provided upon completion? none To what extent did this assignment increase your knowledge or understanding of the challenges associated with characterizing return rates and eruption volumes of extremely large volcanoes? o Significantly o Somewhat o a little o none o worse than none - now I'm more confused. To what extent did this assignment help make the volcanoes module more interesting or relevant? Same options __little_____ To what extent did this assignment increase your appreciation for the characteristics of different types of peer-reviewed scientific articles? Same options ___kittle____ To what extent did this assignment increase your confidence in your ability to make appropriate use of complete - or partial sections of - peer reviewed scientific literature? Same options ___little____ How long did you spend on this entire assignment, from starting to read to final submission? ___2____ hrs. (Answer using decimals only (no words), as in "1.5", in units of hours). ===================== Before proceeding with online submission, complete miniproject Part 3, starting on the following page. Then … - When worksheets are completed, submit your results using the assignment and miniproject submission forms in the volcanoes homework folder on our Connect site. - For the reading assignment, NOT all questions are given online, and each student sees a different set. THEREFORE, be careful to provide correct answers to each question you see. - For the miniproject, all questions are required. You must submit using the separate form to keep reading and miniproject assignments separate within Connect. THE MOST COMMON ERROR made by students in the past is not reading questions on Connect carefully. So, work online with this completed worksheet beside you. ALSO remember our Class Code of Conduct, and UBC’s strict rules regarding academic integrity. See http://www.calendar.ubc.ca/vancouver/?tree=3,54,111,959 . EOSC114 mini-project Part 3, Jan. 2018. Review existing mini-project entries INSTRUCTIONS: This is DIFFERENT from past mini-project tasks. Complete this worksheet first. It involves three example mini-project entries given separately below, and one of the whole-class google maps of results. Submit your work online; a link is provided on Connect as part of “Homework 3”. There is a limited time online for submission, so you must do the worksheet first. Keep this worksheet safe after completing it. Go to the map generated by eosc114 students at http://bit.ly/2DmBrpl. Explore this map a little, and practice using the side panel. READ INSTRUCTIONS ABOVE CAREFULLY – THEN START HERE 1) How many students said they experienced the event they reported on? HINT: This is easy. In the map’s side panel make sure the “by experience” checkbox is checked, and the “by hazard” checkbox is unchecked, click the down-arrow next to “the event is interesting…. ”, and count or estimate, under “Yes, I experienced it”.) a) Fewer than 5 b) 5-10 c) 11-20 d) 21-50 e) 51-100 f) More than 100 2) How many students said they were interested in Landslides, debris flows or rock slides. (As above - check the “by hazard” checkbox, uncheck “by experience”, click the down-arrow and estimate under each heading.) a) Fewer than 5 b) 5-10 c) 11-20 d) 21-50 e) 51-100 f) More than 100 3) Which type of hazard appears to have been the most “popular” for this exercise? a) Earthquake b) Volcano c) Landslide, debris flow or rockfall d) Tsunami e) Other wave-related event such as rogue wave or coastal erosion f) Hurricane, typhoon or cyclone g) Tornado h) Thunderstorm, lightning event, or other hazardous storm i) An extinction or asteroid / meteorite impact event. j) Other natural (not man-made) event (flood, wildfire, etc.) 4) Make sure either “by hazards” OR “by experience” is selected, but NOT both. How many students were interested in events within or on the coast of the South American continent? 4 a) What was the latitude of the most southerly event identified? -43.583 5) 6) Zoom in to the map until you can see all of the Philippines, but nothing else. How many events have been identified in this region (land and ocean within 200km of the Philippines)? HINT: Explore a bit – some locations have several event pins near or overlying each other. 11 7) How many TYPES of events (10 possible; see a-j above) were identified by students in this area? 4 8) Move to see Canada only; how many events were identified as “Other natural (not man-made)”? 8 9) How many of these “Other…” events in Canada were experienced by the student who made the entry? 2 10) After exploring the whole global map, what did you find to be most interesting, intriguing or unexpected about it? Write a sentence or two here …. How experiences align well with high population concentrations as we’ve studied. 11) Complete the 3-part table on the next page. 12) How long did you spend just on today’s mini-project tasks? Value in minutes (eg 30); no words. 20 . a) 11) Now we will practice reviewing students’ mini-project entries. Three examples are provided on the next two pages. Review all three by answering multiple choice questions in the table below. This should not take long. b) c) Example mini-project #1 A. The Entry Number indicated at the top of this example is 997 B. Does latitude/longitude correspond to title and event? Two step test: > Test in maps.google.com by entering as "latitude, longitude" using decimal numbers. > If the result seems wrong add or remove a minus sign for latitude to see if this causes the location to become correct. Repeat for longitude. a. Yes - the location as given seems correct. b. No - latitude has wrong sign (should be -ve if N. of equator) c. No - longitude has wrong sign (should be -ve if W. of Greenwich) d. No – lat and/or long is incorrect value regardless of sign. C. Check source: a. A citation of book, journal etc. seems to be complete and correct b. A citation of book, journal etc. seems to be incomplete or incorrect c. A website with correct URL. Check by pasting exactly as given to see if the website can be found. d. A website with a URL that doesn't work properly. e. A website with a URL that seems unrelated to the entry. D. Check image: The pointer to the image is … a. A pointer that works properly, i.e. takes you to JUST the figure. b. A pointer to a page containing the figure with other information. c. A pointer to a location that seems unrelated to the entry. E. Image caption: Is it clear and informative? a. Yes - image caption is clear; informative & concise. b. Relevant, but not very informative about the image c. Unclear or unrelated to the image. F. Title: Is it clear and informative? a. Yes - clear and informative b. Understandable but poorly written or confusing. c. Unrelated to the entry. G. Does the question posed reflect the entry? a. Yes - it seems relevant and easy to understand b. Yes - it seems relevant but hard to understand for some reason c. No – absent, or seems unrelated to the indicated source H. Timing: a. Seems close enough & is in one of the acceptable formats: date (yyyy/mm/dd), age (y,yyy,yyy years ago), or “future”. b. Is probably correct but in neither of the acceptable formats (Connect will be unable to understand the result) c. Seems to be incorrect for this event. I. Description: The spelling, grammar and clarity seems to be … a. Correct; in their own words; and clear for any reader to | d) Example #2 understand after reading just once. b. correct with only 1 or 2 possible spelling or grammar errors, their own words, and/or understandable if read with care. c. in their own words but could have spelling/grammar/writing improved, or might be tricky to understand first time. d. not carefully written; not their own words; and/or likely to be confusing. Probably should be re-done.br) bs) Three example mini-project entries to be reviewed using the three-cell table above. bt) Example mini-project #1 1 Entry number: 997 2 Type: earthquake 3 Experienced: b) A family member or members experienced it. 4 Aspect of this event: consequences 5 Latitude: 61.04 6 Longitude: -147.7 7 Title: The Alaska earthquake of 1964 and how it's effects on people and the community 8 Timing: 1964/03/28 9 Reliable source: https://earthquake.usgs.gov/earthquakes/events/alaska1964/ 10 Source type: b) an online information source with no specific author(s) identified, but from a reputable non-profit organization such as a scientific government or academic agency, a disaster relief organization, a weather bureau, etc.; 11 Sensible question: The "seismograms" page suggests continued for at least 3 days, so did they contribute to the damage and devastation? 12 Type of question: c) posing a “what if…” or “what about…” question 13 One image: https://cdn.theatlantic.com/assets/media/img/photo/2014/05/1964-alaskas-good-fridayearthquake/a03_ake00144/main_1200.jpg?1420504219 14 Image type: photo 15 Caption: Damage in Anchorage due to the 1964 Earthquake 16 Short description: I was interested in this earthquake, because my parents and grandparents experienced it. The photo I chose is of 5th avenue in downtown Anchorage Alaska. My grandparents’ restaurant was on that street. Half of the street fell approximately 30 feet. I knew many of the families or descendants of the families from the photos. It interests me to think how, when we consider the consequences of earthquakes, we have to think about the business that people depend on for everyday supplies. If that infrastructure is affected, then it is impossible to have that same process to provide for the community. Then it relies on government and other official infrastructure to provide necessities to the public. The photo was the main commercial street in Anchorage at the time. bu) bv) Two more examples on the next page. bw) bx) Example mini-project #2 by) Entry number: 998 bz) Type: earthquake ca) Experienced: Interested only cb) Aspect of this event: consequences cc) Latitude: 60.9 cd) Longitude: 147.3 ce) Title: Southern Alaska devastated by 1964 earthquake https://blogs.scientificamerican.com/history-of geology/march-27-1964-the-great-alaskan-earthquake/ ch) Source type: d) a written account or story in a magazine, book, or other non-news-related source with known authors (online or paper); ci) Sensible question: <Unanswered> cj) Type of question: <Unanswered> ck) One image: https://timedotcom.files.wordpress.com/2014/03/14031 9-alaska-earthquake-01.jpg?quality=85&w=824 cl) Image type: photo cm) Caption: Picking up after the 1969 Alaska megaquake Short description: The earthquake of 1964 that occurred in Southern Alaska a 9.2 magnitude earth-quake that resulted in a tsunami rushing towards the coast of Alaska. Tsunami waves were recorded in 20 different countries as a result. There were casualties and and severe damage in numerous areas of North America. This earthquake particularly intriguing because it ocured relatively close to home. With all of the natural disasters ocuring lately and the prediction of the Cascadia Earthquake id like to be aware of the potential threts and damage that could be | cn) Example mini-project #3 co) Entry number: 999 cp) Type: earthquake cq) Experienced: Interested only cr) Aspect of this event: consequences cs) Latitude: -61.04 ct) Longitude: -47.7 cu) Title: The Alaska earthquake of 1964 and how it's effects on people and the community cv) Timing: 1964/03/28 cw) Reliable source: http://www.cnn.com/2016/01/24/us/alaska earthquake/index.html cx) Source type: c) a major news agency such as BBC, CBC, Huffington Post, New Yorker, The Guardian, etc. cy) Sensible question: How come the earth sank like that? cz) Type of question: a) asking for clarification about some basic or background details? da) One image: https://www.theatlantic.com/photo/2014/05/196 4-alaskas-good-friday-earthquake/100746/ db) Image type: photo dc) Caption: Devastation due to the 1964 Alaska Earthquake dd) Short description: Little was known about how effects of very large earthquakes could be. The worlkd has learned more since then. de)cf) Timing: 1964/03/27 cg) Reliable source: [Show More]
Last updated: 1 year ago
Preview 1 out of 15 pages
Reviews( 0 )
Document information
Connected school, study & course
About the document
Uploaded On
Mar 31, 2021
Number of pages
15
Written in

Additional information
This document has been written for:
Uploaded
Mar 31, 2021
Downloads
0
Views
145
.png)