Engineering > Research Paper > Research Paper > Chapter 6 Solutions Engineering and Chemical Thermodynamics (All)
Research Paper > Chapter 6 Solutions Engineering and Chemical Thermodynamics
Document Content and Description Below
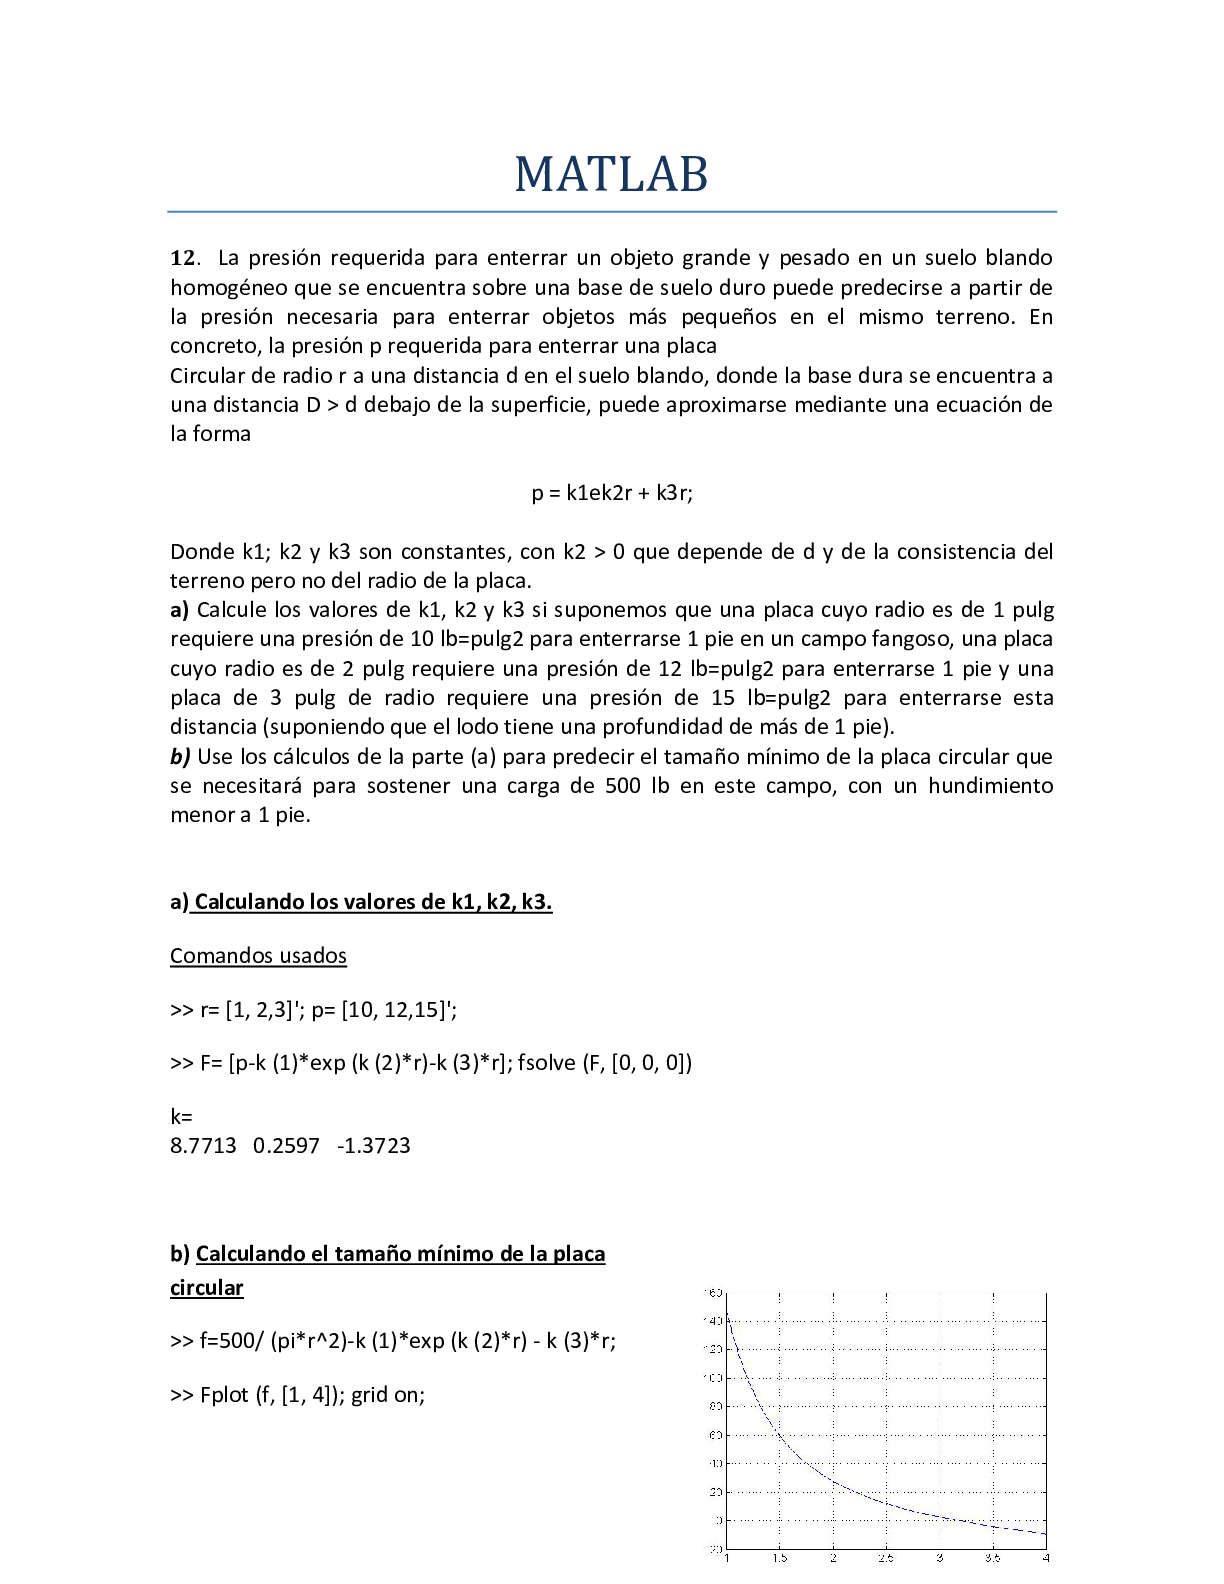
Chapter 6 Solutions Engineering and Chemical Thermodynamics Wyatt Tenhaeff Milo Koretsky Department of Chemical Engineering Oregon State University [email protected] 3 The logari... thmic trend is well-represented. However, at lower temperatures the ClausiusClapeyron equation is up to 37% off. The actual heat of vaporization changes from For 100 ºC to 200 ºC, we obtain the following table: Over this range the Clausius-Clapeyron equation represents the data well and is no more than 4 % off. The actual heat of vaporization changes from 2257.0[kJ/kg] at 100 oC to 1940.7[kJ/kg] at 200 oC, a difference of around 15%. (e) The heat of vaporization can be corrected for temperature as follows We can acquire heat capacity data from Appendix A.2, but to simplify the analysis, we will use an average heat capacity for the vapor. Substitute this expression into the Clausius-Clapeyron equation Integrate: Pisat Now plot the data as before from 0.01 ºC to 200 ºC. 6 Water Saturation Pressure as a Function of Temperature 500 T (K) Psat (kPa) The agreement between the two values at lower temperatures improves significantly at lower temperatures, but actually worsens at higher temperatures. The agreement could potentially be improved by not averaging the heat capacity. 7 6.2 We can find the required pressure by applying the Clapeyron equation: We can find the molar volume of water ice from any number of reference books. At 0 ºC and If we assume that (hl - hs) and (vl - v s) are independent of temperature and pressure, we can separate variables in the Clapeyron equation and integrate. At 1 bar, the gas will act as an ideal gas. 3 The number of moles of vapor are found as follows (neglect molar volume of liquid) [ ] 0.0402 mol mol m n (b) At 21 bar, the gas will not behave ideally. Since we are assuming that the molar volume of liquid is negligible and the heat of vaporization is independent of temperature, the Clapeyron equation becomes Substituting this expression into the Clapeyron equation yields Separation of variables yields (c) Using the virial equation, We can assume the volume occupied by the liquid is negligible. Therefore, g From the fundamental property relation given by Equation 5.9: dg = -sdT + vdP We can identify a phase transition from the vertical line of the g vs. T plot, as indicated below. Since this transition is vertical, i.e., the temperature is constant, the pressure must also be constant. Thus, we can differentiate the Gibbs energy with respect to temperature at constant pressure to get: s Hence the slope of a plot of g (or µ) vs. T at any temperature must be the negative of the value of entropy on the plot for s vs. T. The resulting curve is sketched below. 15 6.8 The ferrite phase has stronger bonds. At room temperature, iron is in the ferrite phase. The heating to 912 ºC has the effect of increasing the entropy contribution to the Gibbs energy. At a high enough temperature, the austenite phase becomes stable, so that its entropy must be greater than the ferrite phase. If the entropy of the austenite phase is greater, the enthalpy of the ferrite phase must be greater or else the austenite phase would be stable over the entire temperature range. Hence, the ferrite phase has stronger bonds. 16 6.9 Since the pressures are low, we can assume ideal gas behavior. We can also assume that the molar volume of the vapor is much greater than the molar volume of liquid and the heat of vaporization is independent of temperature. Therefore, we can rearrange Equation 6.24 to This value is 7.7% smaller than the reported value. 17 6.10 (a) The freezing point occurs where there is a discontinuity in the g vs. T plot, as indicated below. The liquid is at a temperature higher than the freezing point and the solid at lower temperature. These are demarked below. The melting temperature is 250 K, which occurs at a value g = 3,000 [J/mol] (b) At constant pressure, the entropy can be found from Equation 5.14. For the solid we have: Assuming the molar volumes of the liquid and vapor stay constant over the temperature range around the melting point, we see that the Gibbs energy of the liquid increases by 1.2 times the Gibbs energy of the solid, since the molar volume of the liquid is 20% larger. The Gibbs energy of the new freezing point at higher pressure is schematically drawn on the plot above. For convenience, we choose the solid to increase by 1 unit on the plot. Thus, the liquid increases by 1.2 units. As the sketch shows, the freezing point, where the two lines intersect, will shift to higher temperature. 19 6.11 For a single component system the fundamental property relation, Equation 5.9, gives: dg = -sdT + vdP We can identify a phase transition from the vertical line of the g vs. P plot, as indicated below. Since this transition is vertical, i.e., the pressure is constant, the temperature must also be constant. Thus, we can differentiate the Gibbs energy with respect to pressure at constant temperature to get: Hence the slope of a plot of g vs. P must have a slope that matches the plot for v vs. T. Since the molar volume of phase á is about twice the value of phase â, its slope should be twice as big. The resulting curve is sketched below. 20 6.12 The saturation pressure can be found using the Clausius-Clapeyron equation with the assumption that the heat of vaporization is independent of temperature. First, we need to use the given data for the 63.5 ºC and 78.4 ºC to find the heat of vaporization. The values using the graphical method are reasonably close to the analytical method. 47 6.27 The following can be shown with the Gibbs-Duhem equation 0 = x1V1 + x2V2 Differentiation with respect to x1: If the partial molar volume of species 1 is constant, the Gibbs-Duhem equation simplifies to Therefore, the partial molar volume of species 2 is also constant. Note that in this case, since the partial molar volume of species 1 is constant: V1 = v1 and similarly for species 2: ` V2 = v2 Hence, the molar volume can be written: (a) Let species 1 represent HCl and species 2 represent H2O. An expression for the enthalpy of the solution is To use the heat of solution data in Table 6.1, we need to determine the values of n1 and n2 consistent with the convention used in the table. As seen in Example 6.6, (n n ) n Now we can find expressions for the partial molar enthalpies. 53 As you can see, the percent difference between the two methods decreases as the mole fraction of sulfuric acid decreases. Although Equation 6.47 fit data at 21 ºC, while the Table 6.1 tabulates data taken at 25 ºC, we do not expect the temperature dependence to account for all the observed difference. The table and equation come from different experimental data sets, and also represent measurement uncertainty. Nevertheless, the agreement is reasonable. 54 6.31 To calculate the enthalpy of mixing from Table 6.1, we must use the following expression Ähmix = xHClÄh~s The mole fraction of HCl is 56 nH 2O,3 =19.8 Since enthalpy is a state function, we can choose any hypothetical path to calculate the change in enthalpy. One such path is shown below. The box in our original schematic is depicted with dashed lines below. We pick a basis of 1 mole NaOH. In step A, the inlet stream is separated into its pure components. In step B, 17.6 additional moles of water are added to the pure water stream. Finally the H2O and NaOH streams are remixed The enthalpy change is found by adding each step H3 - H2 - H1 = ÄH A + ÄH B + ÄHC Since ÄHB represents the mixing of water with water, ÄHB = 0. The enthalpies of mixing for steps A and C can be related to enthalpy of solution data from Table Note: The enthalpy of solution for Stream 1 is calculated by extrapolation. Generally, extrapolation should be avoided, but it is necessary to complete this problem, and we are not extrapolating very far. For step A, we need the negative value of the heat of solution of stream 1. Thus for a basis of 1 mole NaOH: of each step per 1 mole of NaOH: To get the total heat that must be removed per mole of product solution, we divide by the number of moles of product per mol of NaOH: The partial molar property can be written as follows: Applying the chain rule to the above relationship: An expression for the enthalpy of the solution is h = x1h1 + x2h2 + Ähmix which is equivalent to h = x1h1 + x2h2 + x1Äh~s Multiplication by the total number of moles yields H = n1h1 + n2h2 + n1Äh~s To use the heat of solution data in Table 6.1, we need to determine the values of n1 and n2 consistent with the convention used in the table. As seen in Example 6.6, 6.37 Let species 1 designate ethanol and species 2 designate water. We need to obtain an expression for the molar volume, so first, convert the given the mass fractions and densities to mole fractions and molar volumes. Mole fractions: 1 Using this set of equations, the following table was made. The following graph plots the data. The trendline relates v to x1. v (ml/mol) 1 We can substitute the trendline for V into this derivative and use the fact that ntot = n1 + n2 to obtain can be calculated using Equation 6.46 Using the expressions for partial molar volumes Partial Molar Volumes vs. EtOH Mole Fractions Mole Fraction EtOH (x1) EtOH Partial Molar Volume (ml/mol) We can use the density data given in the problem statement to determine the pure species properties. For pure ethanol(x1 =1): For pure formamide(x1 = 0): To calculate V and v, interpolate in the data table to obtain the density of the mixture when Now, we can calculate the volume change of mixing by using Equation 6.43: We can use Equation 6.65 to determine the partial molar volume of formamide: From the provided data table Using the definition of G, the Gibbs energy of mixing of an ideal gas can be rewritten in terms of the enthalpy of mixing and the entropy of mixing: Since an ideal gas exerts no intermolecular interactions, Ä ideal gas = 0 From Equation 6.48: To find the partial molar Gibbs energy of mixing of species a, we apply Equation 6.29: Applying the expression above at infinite dilution xa goes to zero, and the ln term blows up, Gmixa µaga As chemical engineers, we are often interested in the limiting case of infinite dilution. We see that even for ideal gas mixtures the chemical potential in this limit is not mathematically well- .behaved, In Chapter 7, we will develop a different function, the fugacity, which behaves better. 74 6.40 At equilibrium Since the water in the liquid phase is pure The enthalpy and entropy of liquids are not sensitive to pressure changes. We can use data from the saturated steam tables at 25 ºC to determine the Gibbs energy. [Show More]
Last updated: 1 year ago
Preview 1 out of 74 pages

Reviews( 0 )
Document information
Connected school, study & course
About the document
Uploaded On
Dec 02, 2020
Number of pages
74
Written in

Additional information
This document has been written for:
Uploaded
Dec 02, 2020
Downloads
0
Views
101


Interdisciplinary Paper.png)


dfdfefe.png)
