Engineering > QUESTIONS & ANSWERS > ISYE 6501: Introduction to Analytics Modeling Homework 3 (All)
ISYE 6501: Introduction to Analytics Modeling Homework 3
Document Content and Description Below
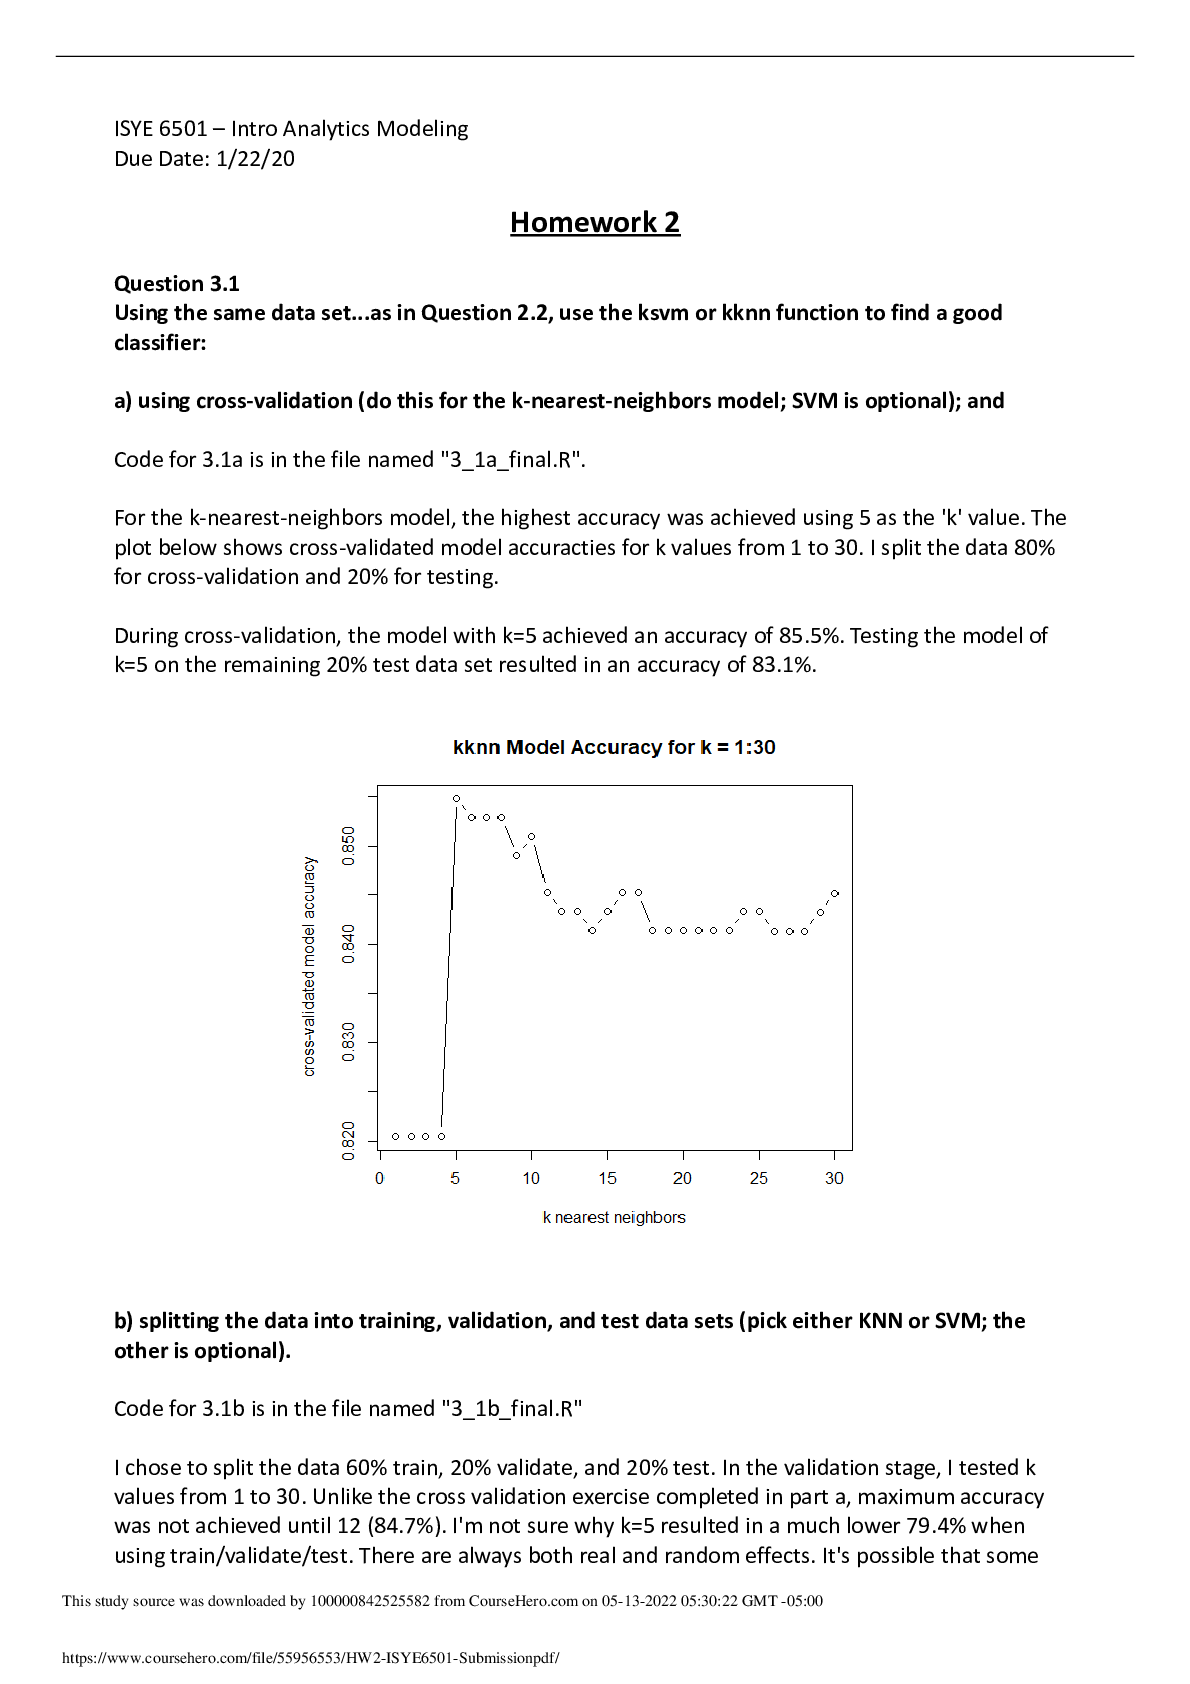
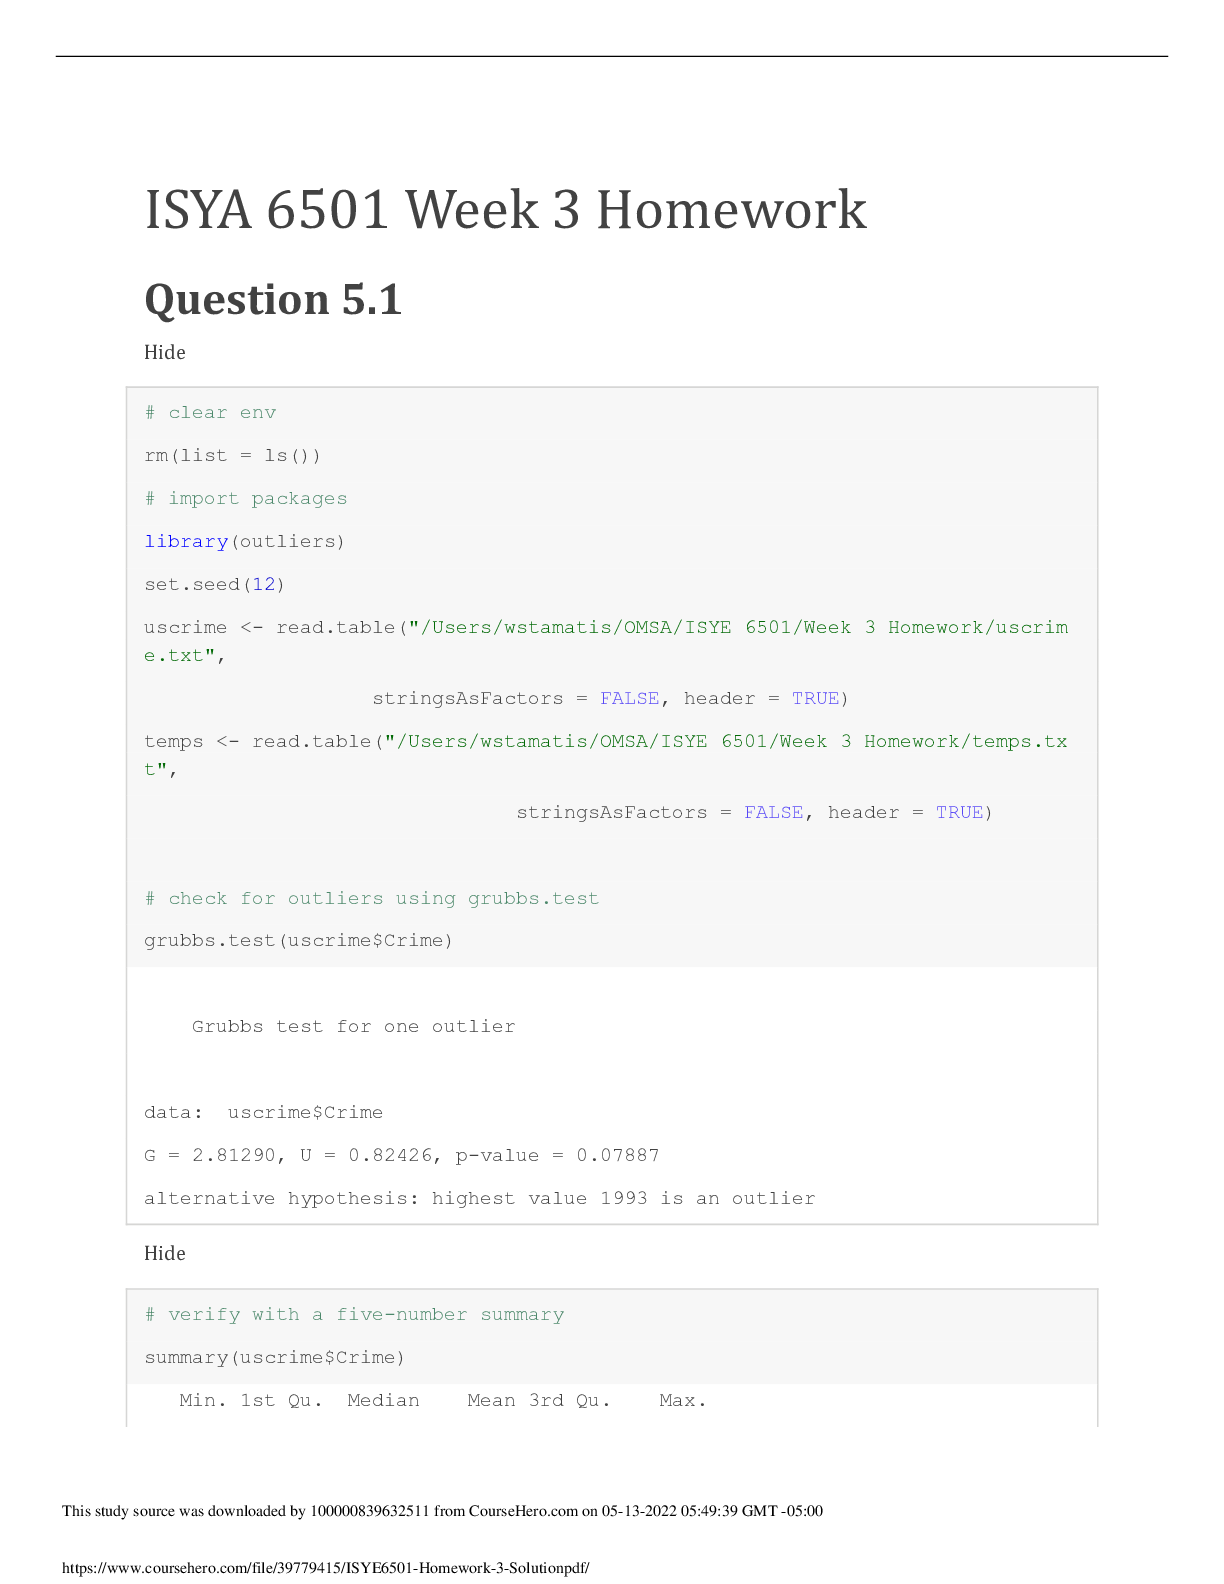
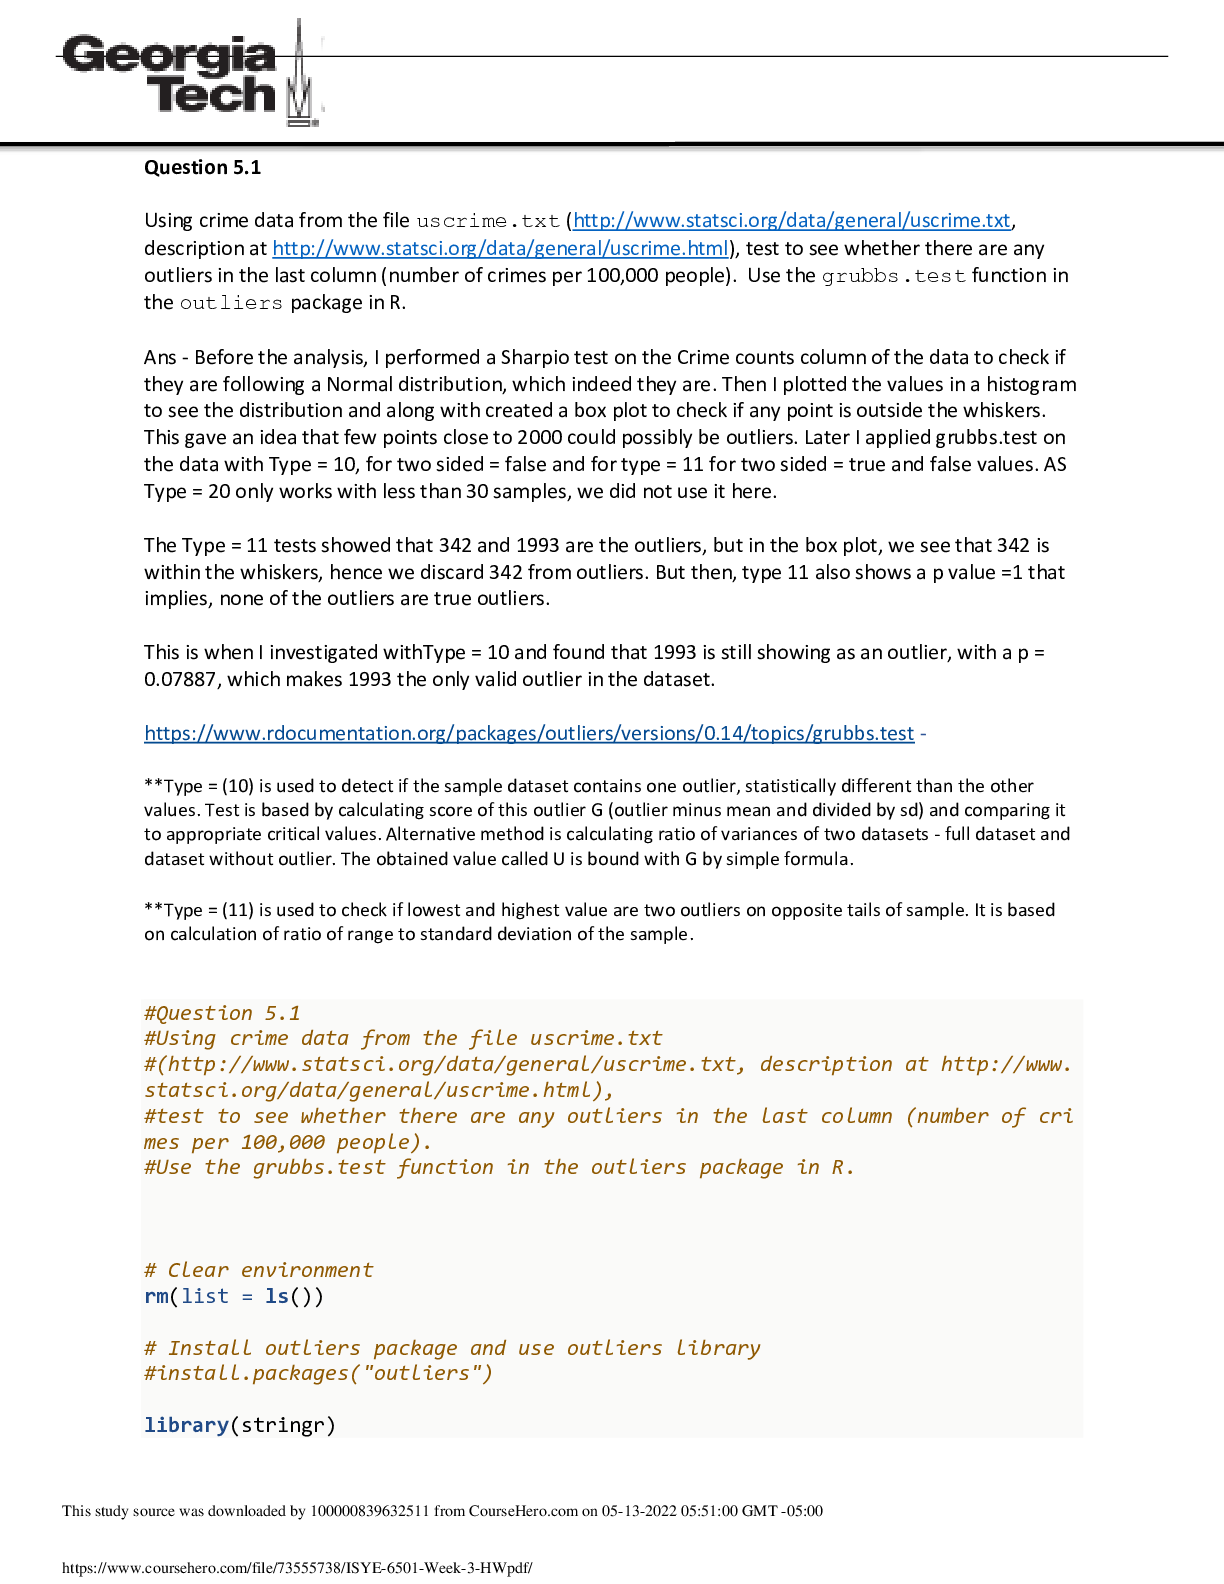
Overview This week’s lesson involves data preparation, including outlier identification, handling outliers, and an introduction to change detection. Data preparation involves inspecting data visu... ally for outliers and using a statistical test, Grubbs Test, to detect outliers in a univariate data set assumed to come from a normally distributed population. The null and alternative hypotheses are two mutually exclusive statements about a population. A hypothesis test uses sample data to determine whether to reject the null hypothesis. The null hypothesis states that all the data values come from the same normal distribution. The alternative hypothesis states that either the smallest or largest data value is an outlier.1 The CUMSUM test is used for change detection. CUSUM: St = max{0, St-1 + (xt – mu - C)} Is St >= T? Calculate metric St and declare an observed change when St goes above some threshold (T). At each time period, observe xt and see how far above the expectation it is (xt – mu) and add it to the previous period’s metric (St-1). Take the max of 0 and that value (essentially keep the value if it’s > 0), else reset running total to zero. Sometimes there are random values (up to 50% of time), so we include a value C to pull the running total down a little bit. The bigger the C, the harder it is for to St to get large and the LESS SENSITIVE the model is. The smaller the C, the more sensitive the model is since St can get larger faster. How do you choose good values for C and t so the model is finds changes quickly but isn’t too sensitive? Use data! Evaluate how costly the C and T boundaries are to your situation. Higher T = slower detection but less false detection changes. Lower T = faster detection but more likely to falsely detect changes. Question 5.1 – Crime Data Analysis Using crime data from http://www.statsci.org/data/general/uscrime.txt (description at http://www.statsci.org/data/general/uscrime.html), test to see whether there is an outlier in the last column (number of crimes per 100,000 people). Use the grubbs.test function in the outliers package in R. Setting up script and data file: First, install and load the outliers package. Then load the crime data from “uscrime.txt.” Load the crime column (last col) from the text file into a variable named “crime.” Inspect the variable contents to ensure data was loaded correctly, and assess data. Min. 1st Qu. Median Mean 3rd Qu. Max. 342.0 658.5 831.0 905.1 1057.5 1993.0 The mean is 905.1 with a min of 342 and a max of 1993. 1 https://support.minitab.com/en-us/minitab/18/help-and-how-to/statistics/basic-statistics/how-to/outliertest/interpret-the-results/all-statistics-and-graphs/ Next, confirmed the data follows an approximate normal distribution. This is shown through the middle portion of the Q-Q Plot, as seen below. After confirmation of a normally distributed population, next use the Grubbs’ Test function to test for one outlier, two outliers on one tail, or two outliers on opposite tails, in our small data set. Determine significance level: A standard default level is 0.05, and A significance level of 0.05 indicates a 5% risk of concluding that a difference exists when there is no actual difference. We’ll choose a higher significance level of 0.10, to be more certain that you detect any difference that possibly exists. grubbs.test(crime, type = 10, opposite = FALSE) Using the funtion with “type=10” denotes a test for one outlier, and “opposite = FALSE” indicates checking the value with the furthest distance from the mean. In our case, the max value is the furthest from the mean, so we’re testing whether the max value is an outlier. Grubbs’ Test results are shown below: Grubbs test for one outlier data: crime G = 2.81290, U = 0.82426, p-value = 0.07887 alternative hypothesis: highest value 1993 is an outlier The test results reveal a p-value of 0.07877 and an alternative hyplothesis that the highest value (1993) is an outlier. Since our significance level is determined to be 0.10, we declare that a p-value of 0.07887 indicates the data point is an outlier, which therefore indicates that the highest data point of 1993 is indeed an outlier. The decision is to reject the null hypothesis and conclude that this is an outlier. Therefore the highest-crime city is likely an outlier. Is the lowest-crime city an outlier? Rerun the Grubbs’ Test using grubbs.test(crime, type = 10, opposite = TRUE) Using the funtion with “type=10” denotes a test for one outlier, and “opposite = TRUE” indicates checking the value opposite of the furthest distance from the mean (in this case the min value). Grubbs test for one outlier data: crime G = 1.45590, U = 0.95292, p-value = 1 alternative hypothesis: lowest value 342 is an outlier The outlier test results for the min value (342) reveals a p-value of 1 and an alternative hyplothesis that the lowest value (342) is an outlier. Since our significance level is determined to be 0.10 and our p-value is greater than the significance level, the decision is to fail to reject the null hypothesis because there is not enough evidence to conclude that an outlier exists. Therefore the lowest-crime city is not an outlier. Is the highest-crime city an outlier? Yes, as determined in the first Grubbs’ Test cited a [Show More]
Last updated: 1 year ago
Preview 1 out of 11 pages

Reviews( 0 )
Document information
Connected school, study & course
About the document
Uploaded On
May 20, 2022
Number of pages
11
Written in

Additional information
This document has been written for:
Uploaded
May 20, 2022
Downloads
0
Views
103
.png)
.png)
.png)
.png)
.png)
.png)