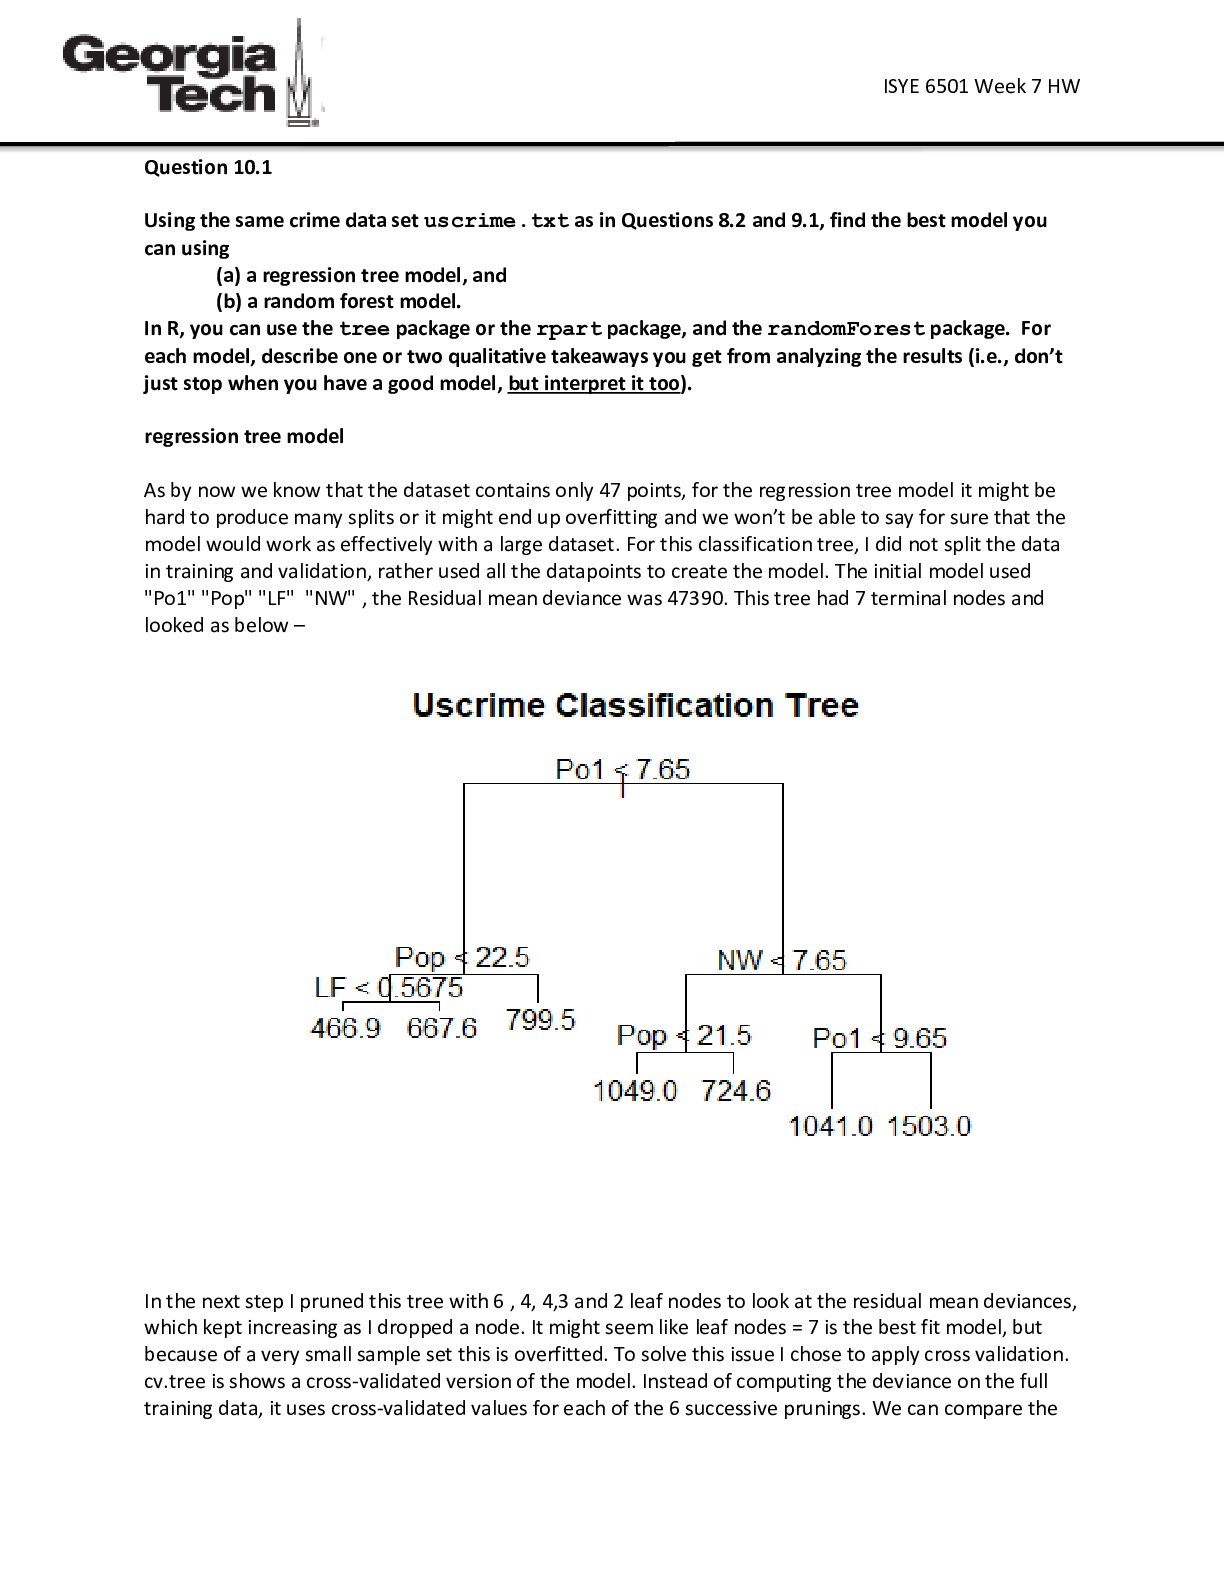
Engineering > QUESTIONS & ANSWERS > HomeWork #1 EDX GTx: ISYE6501x - Introduction to Analytics Modeling (All)
HomeWork #1 EDX GTx: ISYE6501x - Introduction to Analytics Modeling
Document Content and Description Below
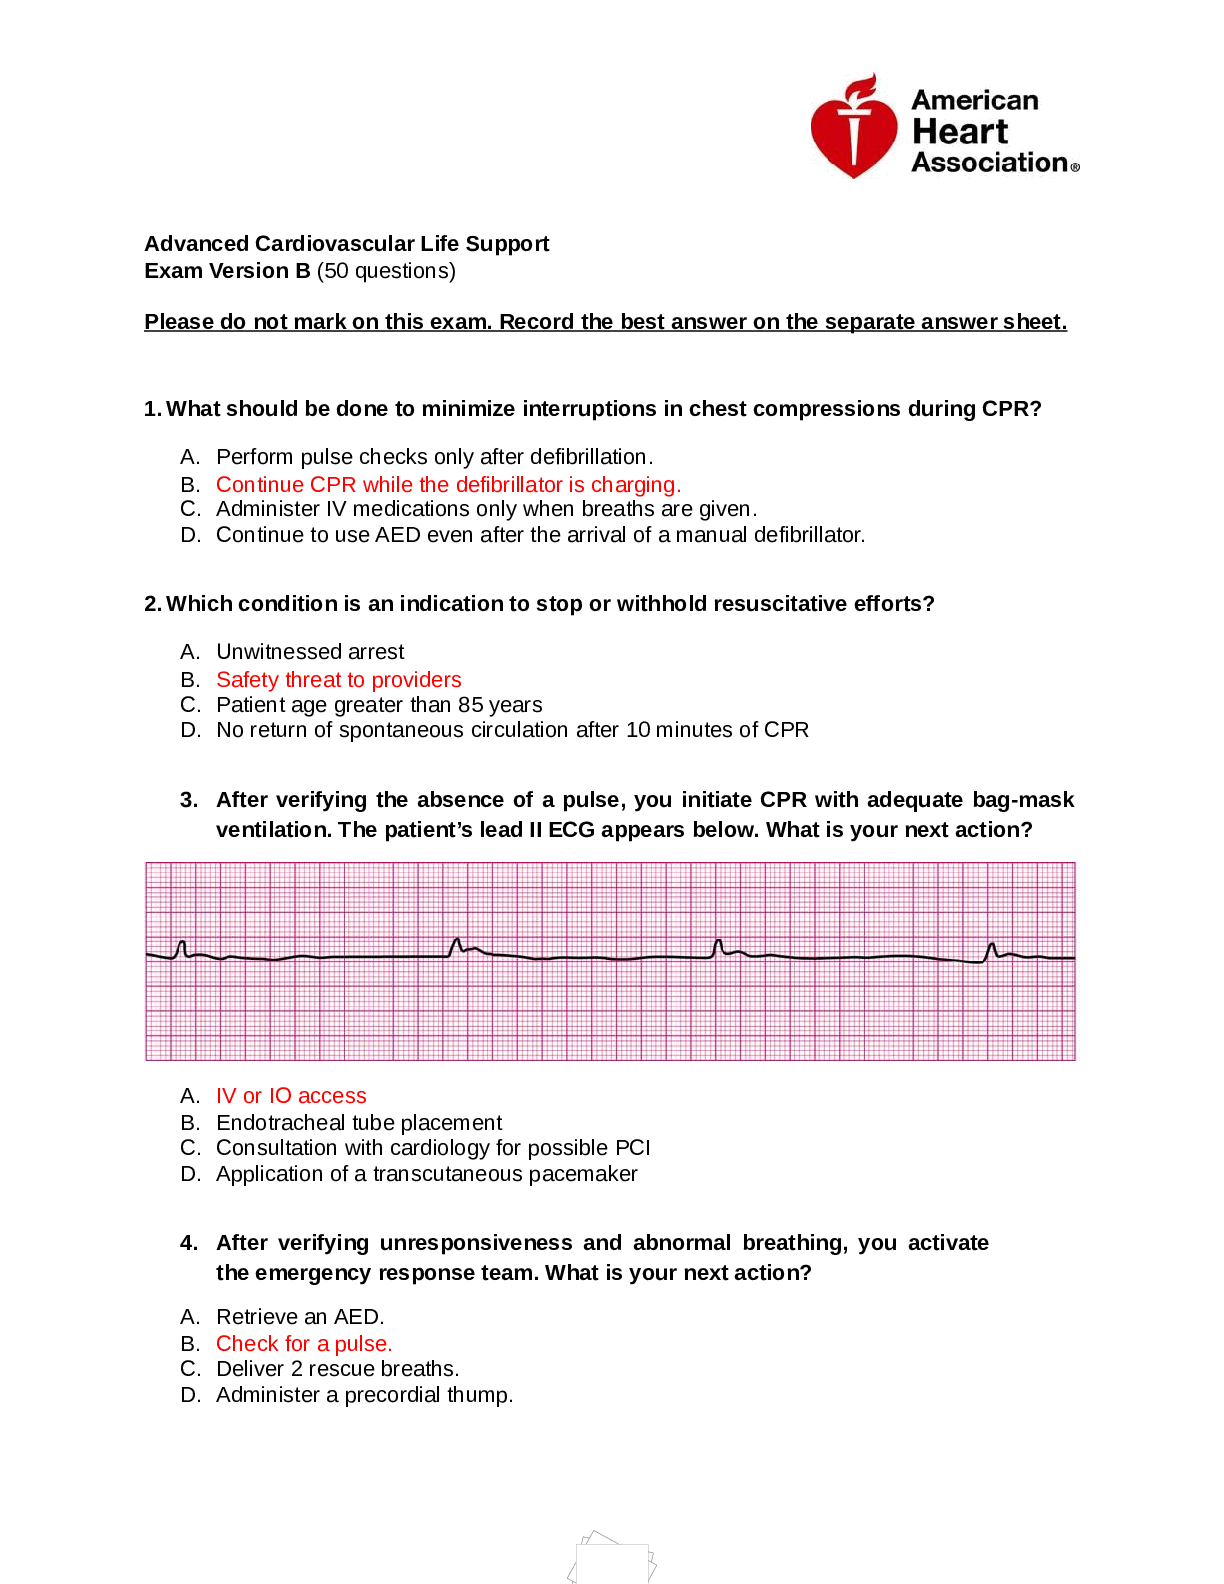
HomeWork #1 EDX GTx: ISYE6501x - Introduction to Analytics Modeling Mónica Rojas May 17, 2020 Table of Contents Results.............................................................................. ..................................................................................1 Question 2.1 .............................................................................................................................................1 Question 2.2 .............................................................................................................................................2 Part 1......................................................................................................................................................2 Part 2......................................................................................................................................................8 Part 3......................................................................................................................................................9 Question 3.1 ..........................................................................................................................................11 Part a ...................................................................................................................................................11 Part b...................................................................................................................................................12 Results Question 2.1 Describe a situation or problem from your job, everyday life, current events, etc., for which a classification model would be appropriate. List some (up to 5) predictors that you might use. In my case, a classification model would be appropriate to determine which clients will close their accounts. I work for a bank where it is important to have our clients happy with our service and avoid churn. Attracting new customers is more expensive than keeping existing ones. Some of the predictors I found are: - Banking predictors: - Account balance - Age as a customer - Products quantity - Recent Complaints - Demographic predictors: - Profession - Marital status - Type (Companny or not) - Gender Question 2.2 The files credit_card_data.txt (without headers) and credit_card_data-headers.txt (with headers) contain a dataset with 654 data points, 6 continuous and 4 binary predictor variables. It has anonymized credit card applications with a binary response variable (last column) indicating if the application was positive or negative. The dataset is the “Credit Approval Data Set” from the UCI Machine Learning Repository (https://archive.ics.uci.edu/ml/datasets/Credit+Approval) without the categorical variables and without data points that have missing values. Part 1 1. Using the support vector machine function ksvm contained in the R package kernlab, find a good classifier for this data. Show the equation of your classifier, and how well it classifies the data points in the full data set. (Don’t worry about test/validation data yet; we’ll cover that topic soon.) Notes on ksvm • You can use scaled=TRUE to get ksvm to scale the data as part of calculating a classifier. • The term λ we used in the SVM lesson to trade off the two components of correctness and margin is called C in ksvm. One of the challenges of this homework is to find a value of C that works well; for many values of C, almost all predictions will be “yes” or almost all predictions will be “no”. • ksvm does not directly return the coefficients a0 and a1…am. Instead, you need to do the last step of the calculation yourself. Here’s an example of the steps to take (assuming your data is stored in a matrix called data): -- call ksvm. Vanilladot is a simple linear kernel. model <- ksvm(data[,1:10],data[,11],type=”Csvc”,kernel=”vanilladot”,C=100,scaled=TRUE) -- calculate a1…am a <- colSums(model@xmatrix[[1]] * model@coef[[1]]) a -- calculate a0 a0 <- –model@b a0 -- see what the model predicts pred <- predict(model,data[,1:10]) pred -- see what fraction of the model’s predictions match the actual classification sum(pred == data[,11]) / nrow(data) I know I said I wouldn’t give you exact R code to copy, because I want you to learn for yourself. In general, that’s definitely true – but in this case, because it’s your first R assignment and because the ksvm function leaves you in the middle of a mathematical calculation that we haven’t gotten into in this course, I’m giving you the code. Hint: You might want to view the predictions your model makes; if C is too large or too small, they’ll almost all be the same (all zero or all one) and the predictive value of the model will be poor. Even finding the right order of magnitude for C might take a little trial-and-error Note: If you get the error “Error in vanilladot(length = 4, lambda = 0.5) : unused arguments (length = 4, lambda = 0.5)”, it means you need to convert data into matrix format: model <- ksvm(as.matrix(data[,1:10]),as.factor(data[,11]),type=”Csvc”,kernel=” vanilladot”,C=100,scaled=TRUE) suppressMessages(suppressWarnings( [Show More]
Last updated: 1 year ago
Preview 1 out of 13 pages
Reviews( 0 )
Document information
Connected school, study & course
About the document
Uploaded On
May 20, 2022
Number of pages
13
Written in

Additional information
This document has been written for:
Uploaded
May 20, 2022
Downloads
0
Views
104
.png)
.png)
.png)
.png)
.png)
.png)