Statistics > EXAM > MATH 225N Statistics Week 2 Quiz - Chamberlain College of Nursing. Complete Q&A (All)
MATH 225N Statistics Week 2 Quiz - Chamberlain College of Nursing. Complete Q&A
Document Content and Description Below
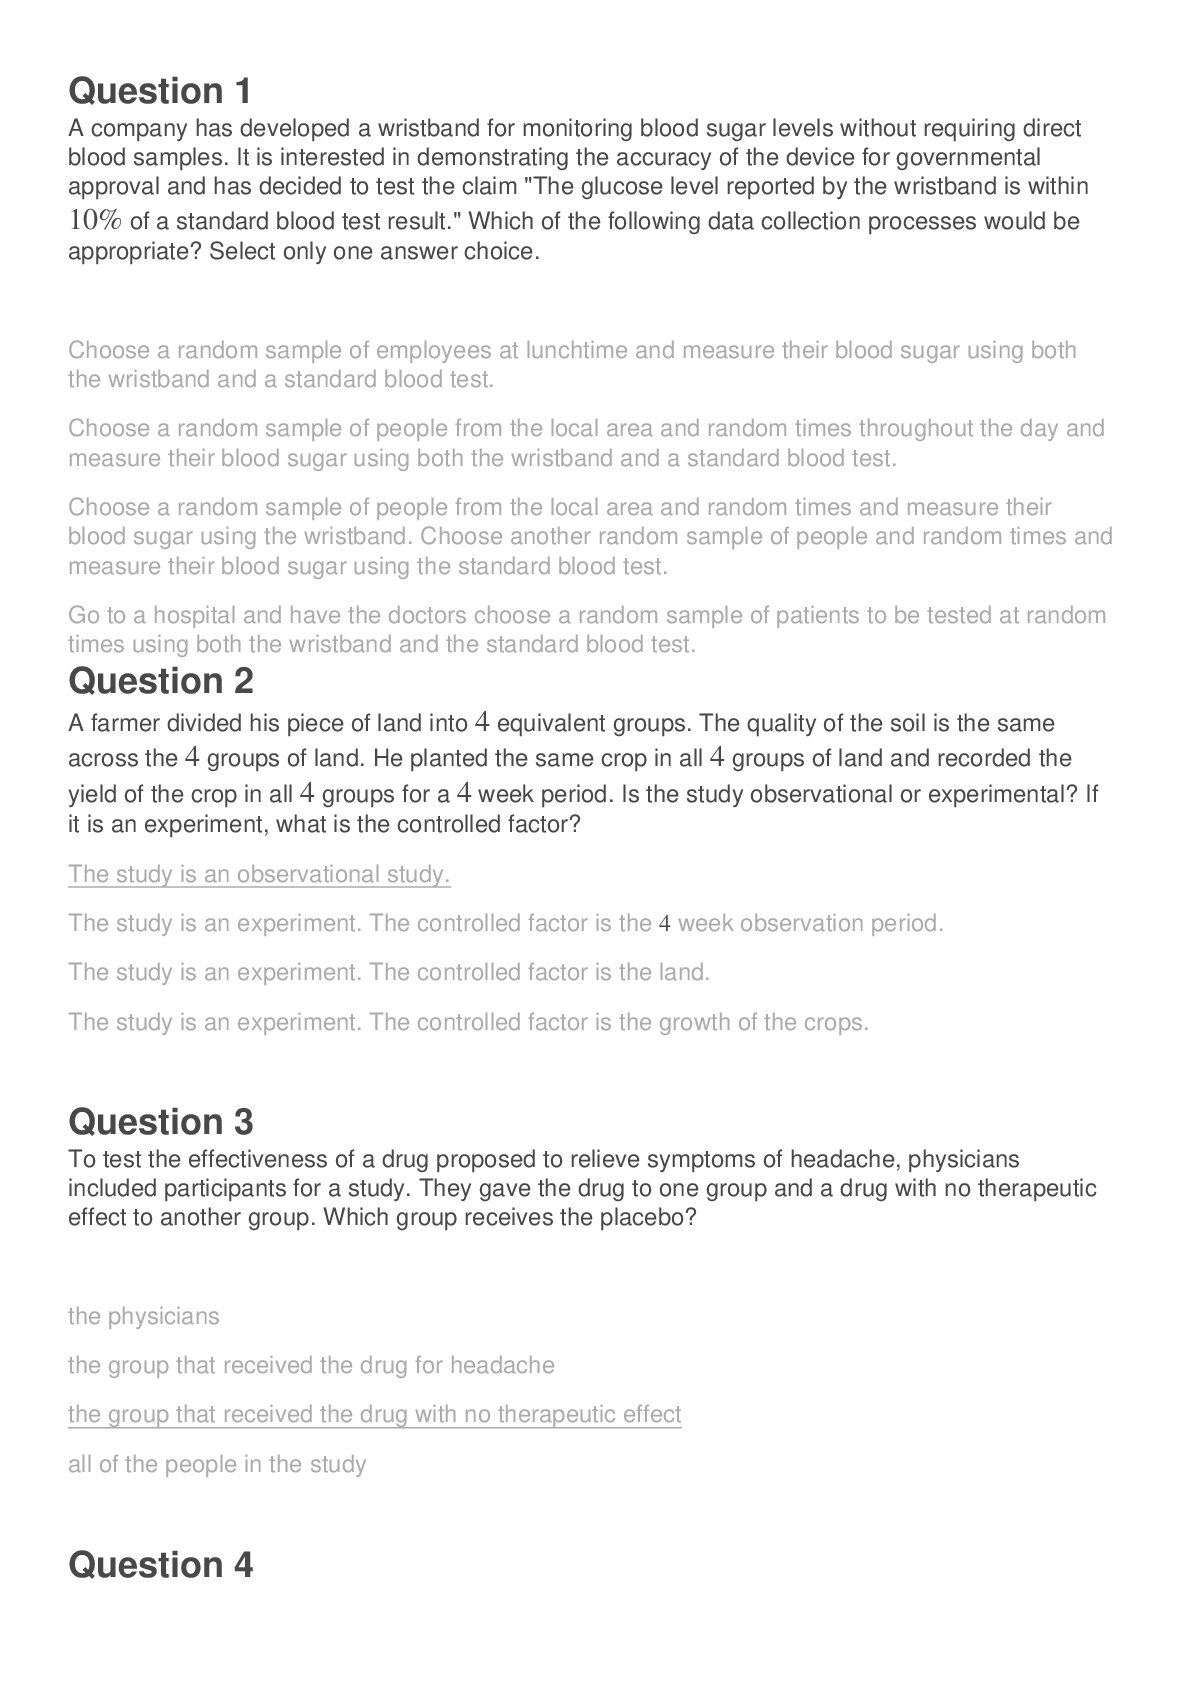
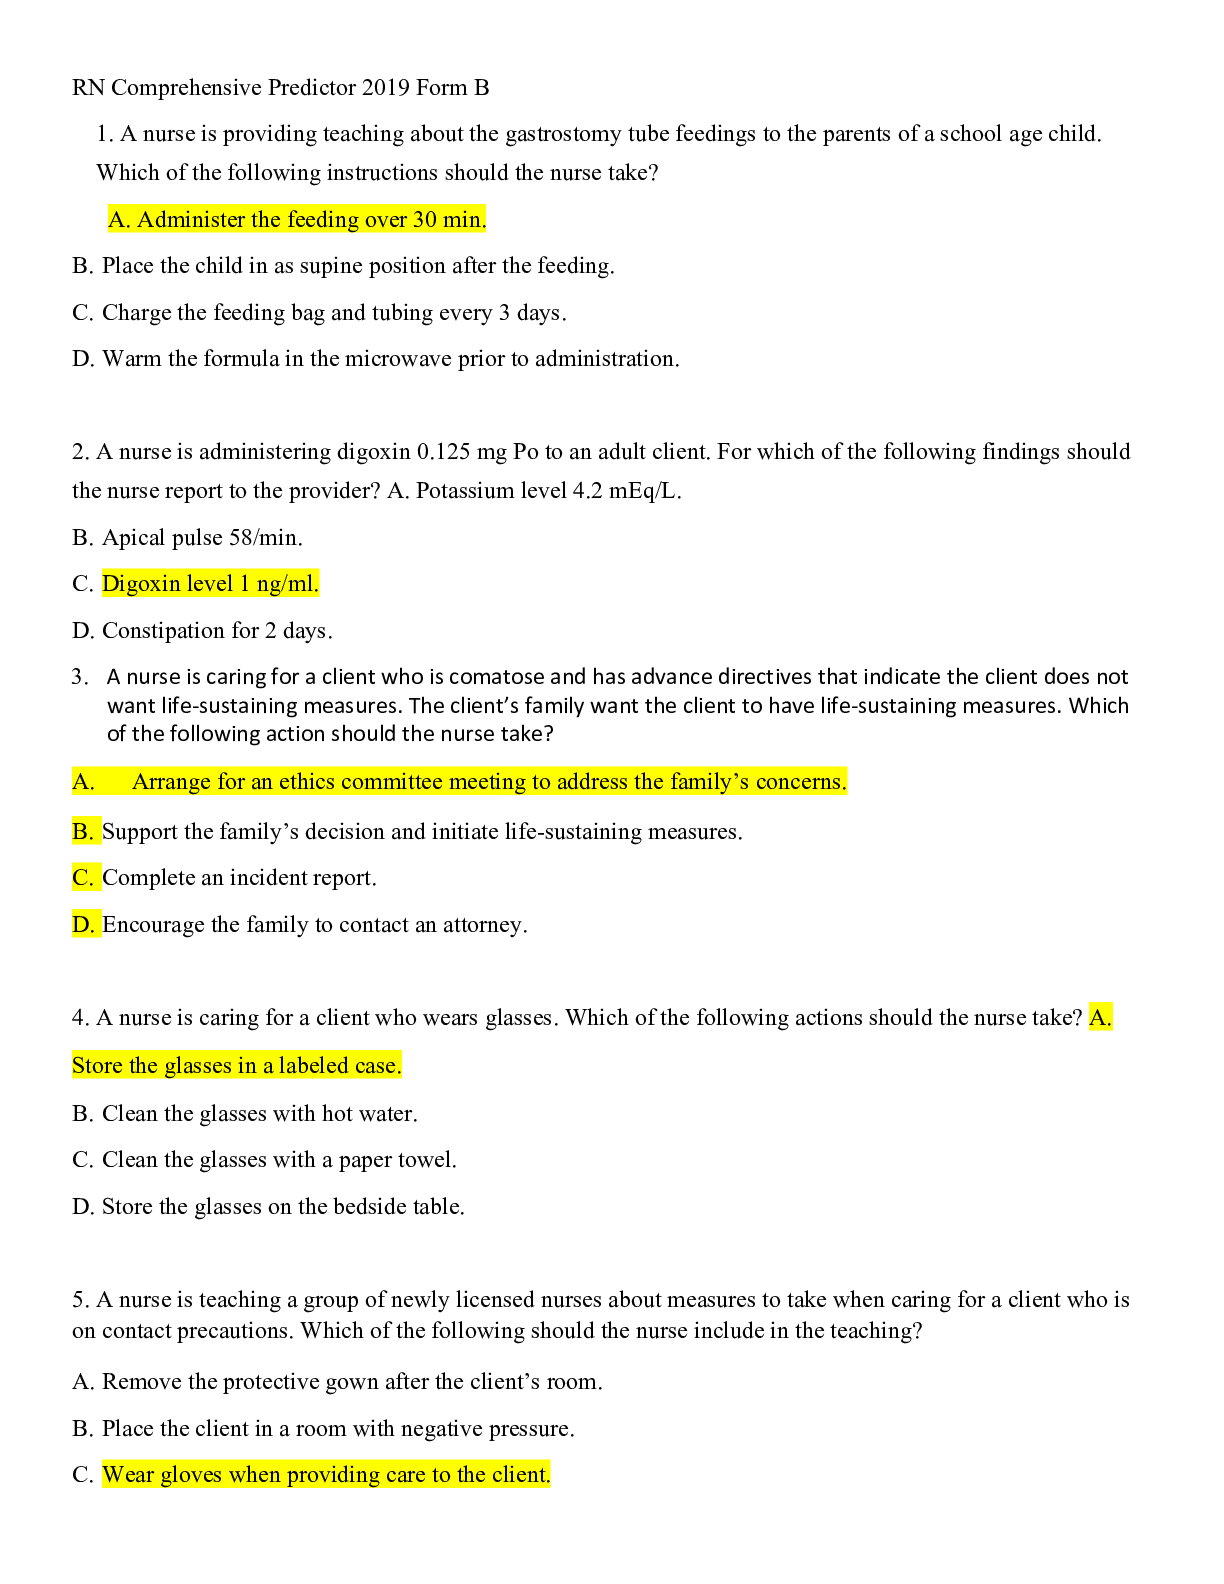
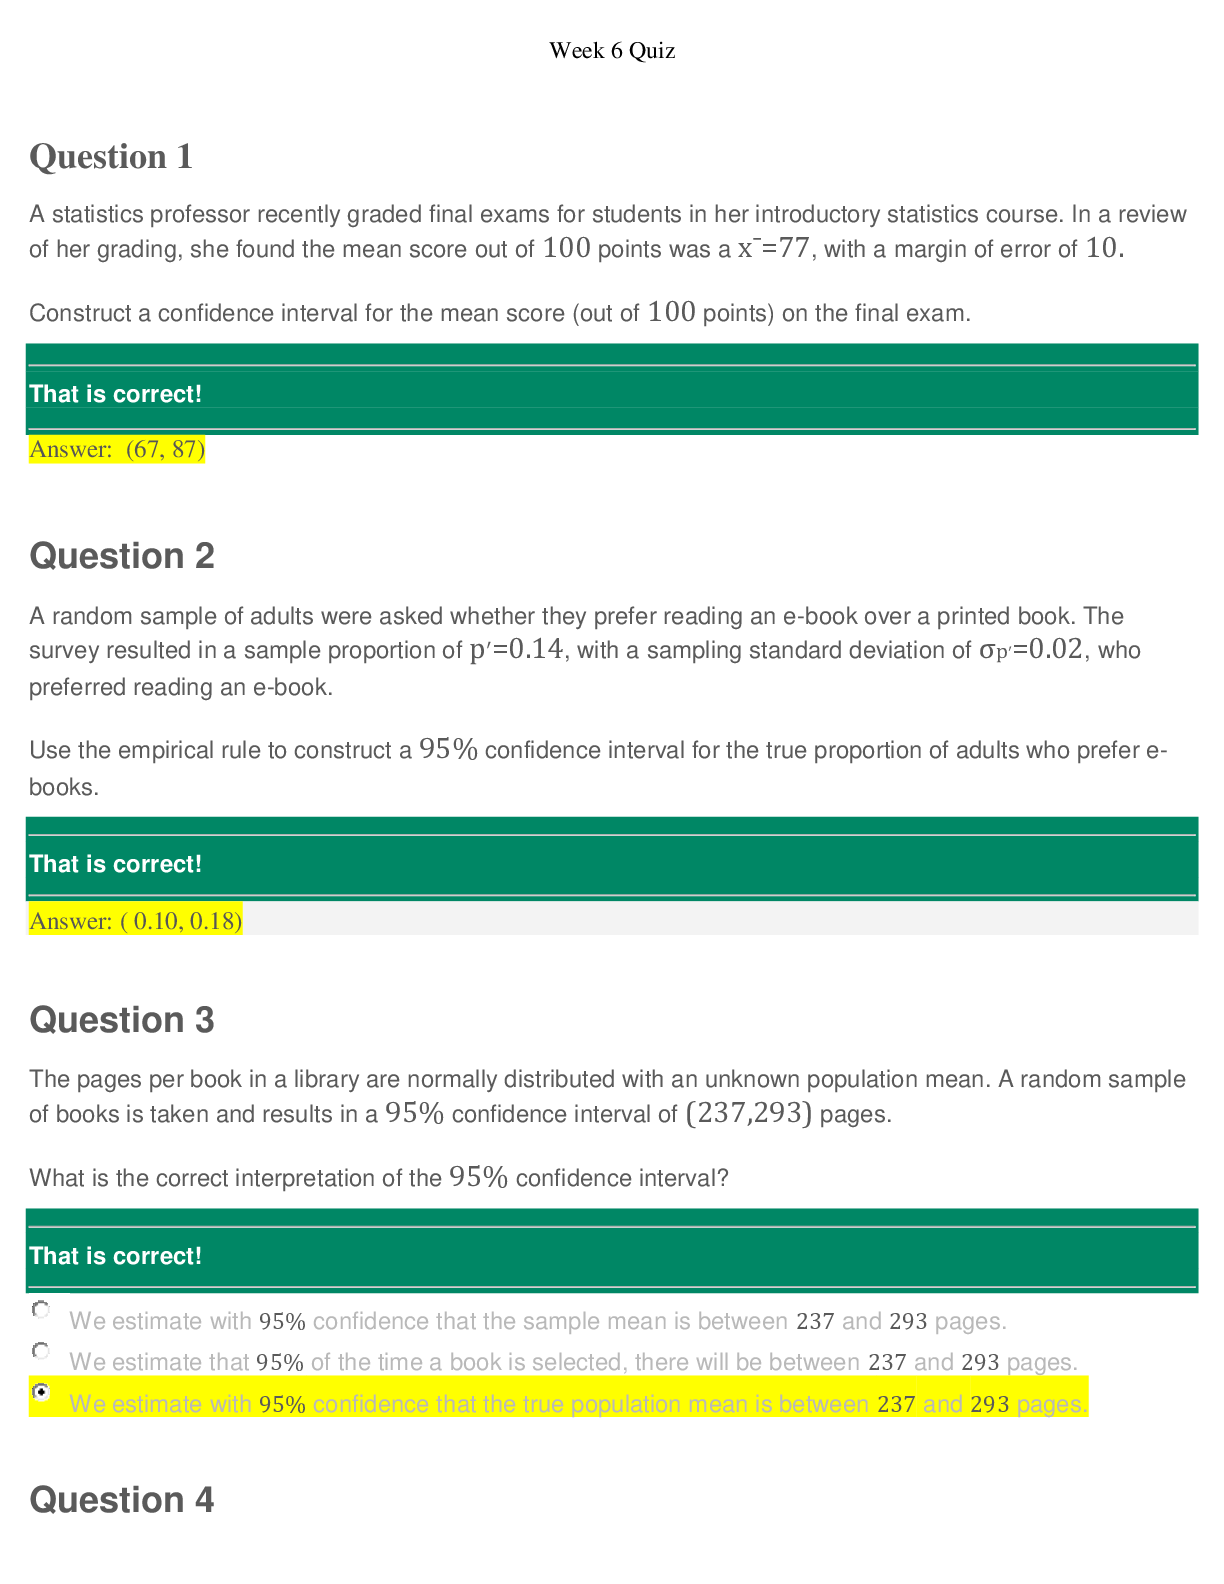
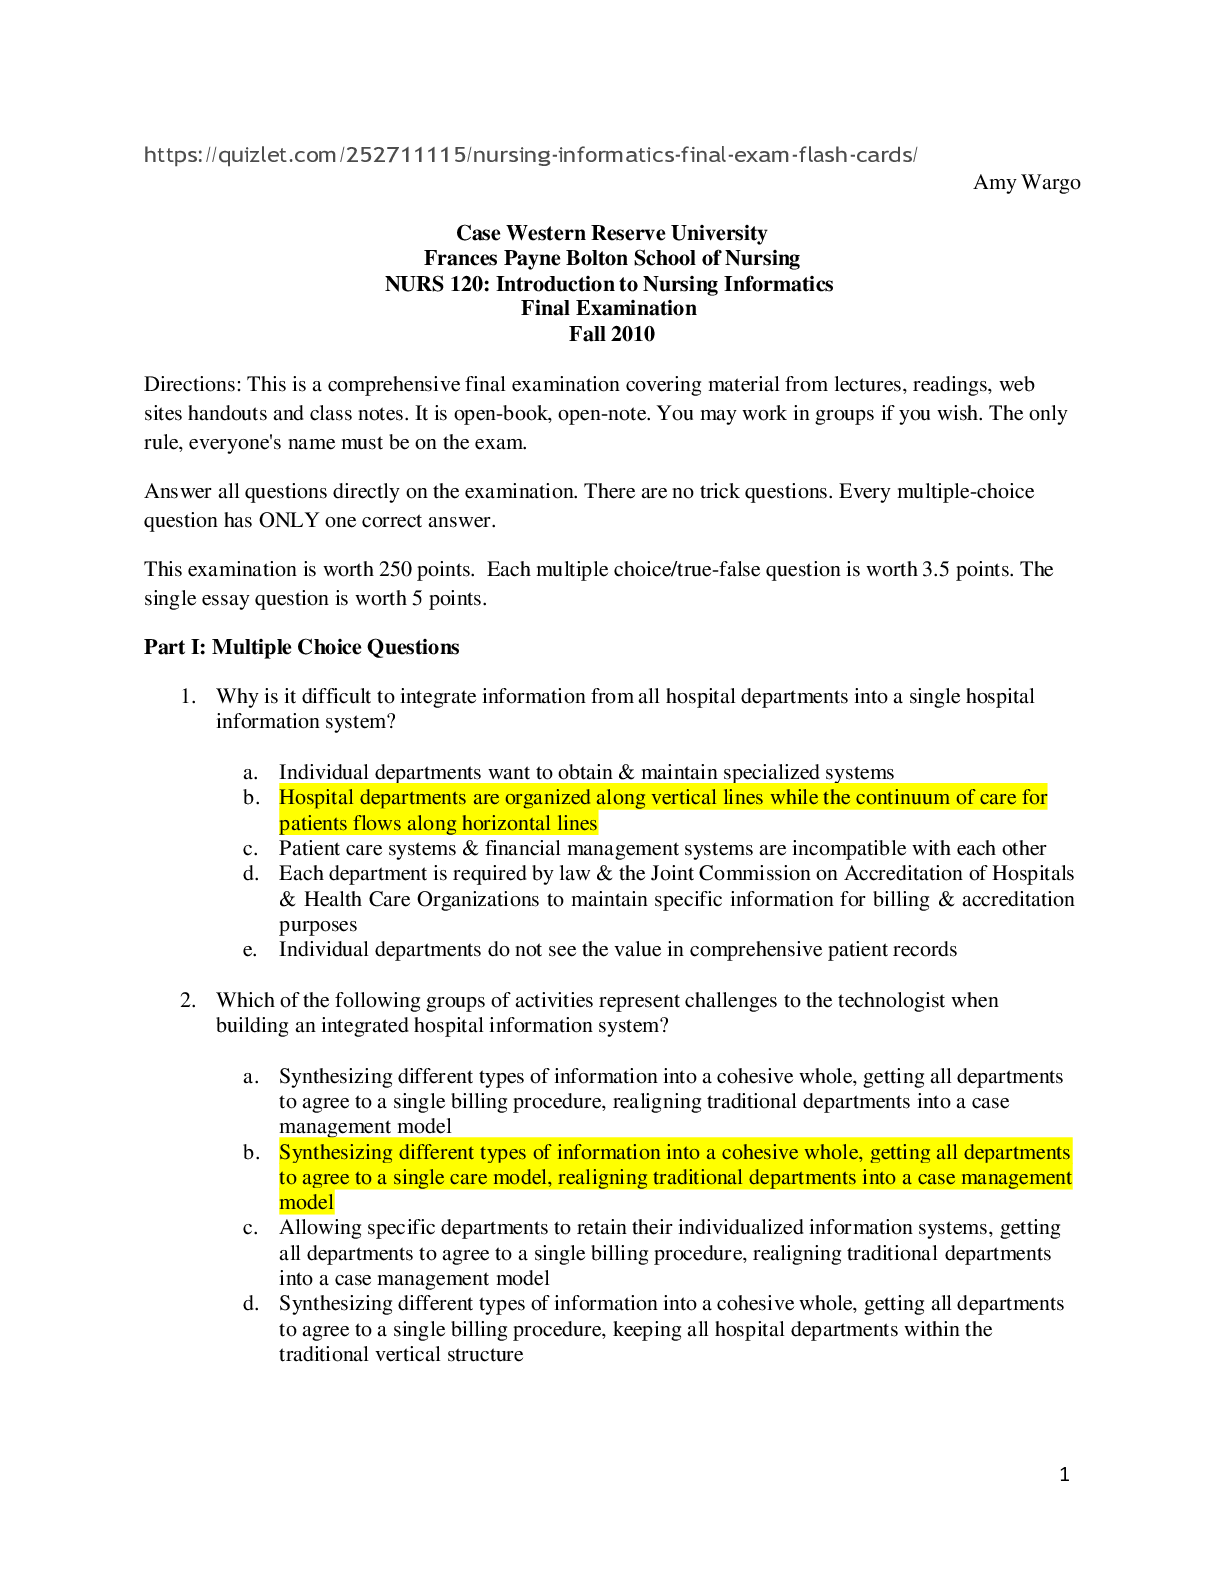
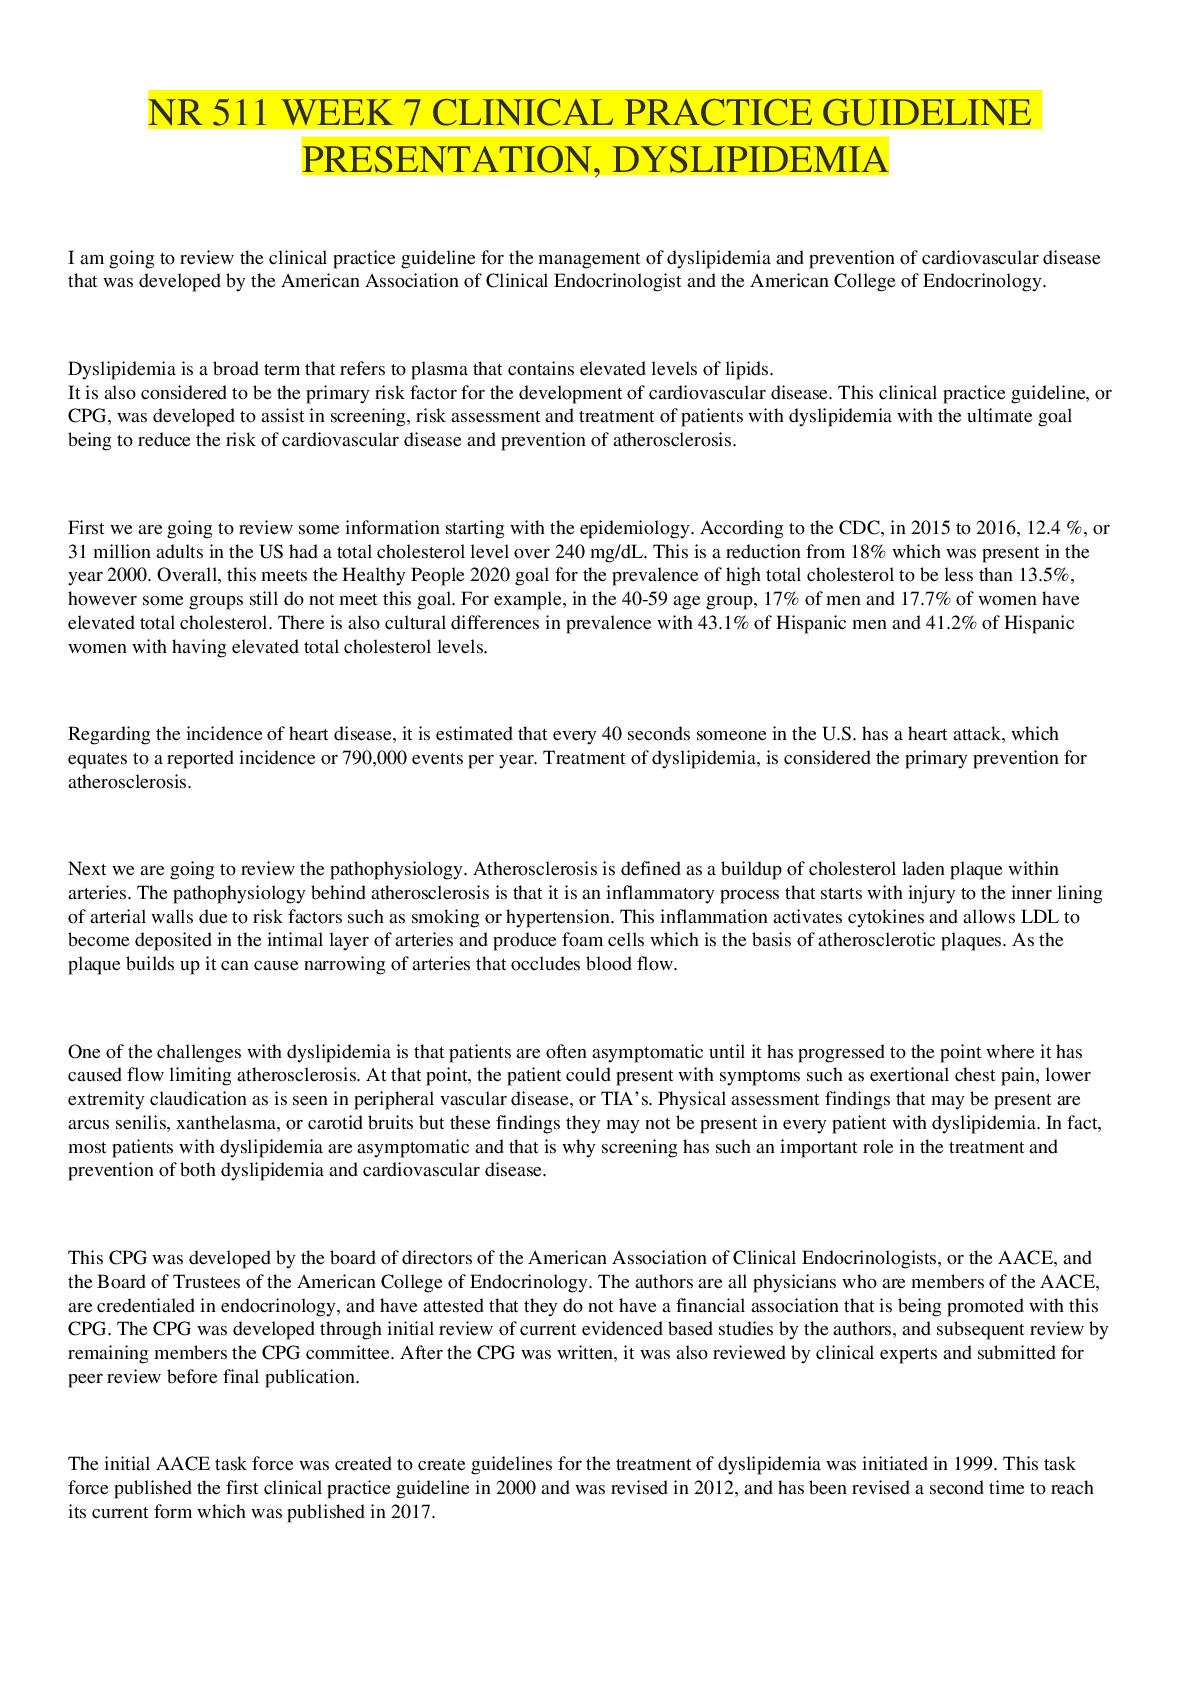
MATH 225N Week 2 Statistics Quiz – Question with Answers all correct 2020 solution docx Devry university Question 1 A company has developed a wristband for monitoring blood sugar levels without requ... iring direct blood samples. It is interested in demonstrating the accuracy of the device for governmental approval and has decided to test the claim "The glucose level reported by the wristband is within 10% of a standard blood test result." Which of the following data collection processes would be appropriate? Select only one answer choice. ________________________________________ Question 2 A farmer divided his piece of land into 4 equivalent groups. The quality of the soil is the same across the 4 groups of land. He planted the same crop in all 4 groups of land and recorded the yield of the crop in all 4 groups for a 4 week period. Is the study observational or experimental? If it is an experiment, what is the controlled factor? ________________________________________ Question 3 To test the effectiveness of a drug proposed to relieve symptoms of headache, physicians included participants for a study. They gave the drug to one group and a drug with no therapeutic effect to another group. Which group receives the placebo? ________________________________________ Question 4 Matthew has created a survey to test whether or not gender has any effect on political party associations. What is the explanatory variable in this situation? ________________________________________ Question 5 Is the statement below true or false? Continuous data are the type of quantitative data that is the result of measuring. ________________________________________ Question 6 A doctor notes her patient's temperature in degrees Fahrenheit every hour to make sure the patient does not get a fever. What is the level of measurement of the data? ________________________________________ Question 7 Karen wants to estimate the mean number of siblings for each student in her school. She records the number of siblings for each of 200 randomly selected students in the school. What is the sample? ________________________________________ Question 8 True or False? In reference to different sampling methods, systematic sampling includes the steps: divide the population into groups; use simple random sampling to identify a proportionate number of individuals from each group. ________________________________________ Question 9 While standing on a highway overpass, Jennifer wonders what proportion of the vehicles that pass on the highway below are trucks. The highway has 4 lanes running in each direction. Jennifer is only interested in the proportion of vehicles that pass over the course of the hour that she spends there. Which of the following sampling methods would be best for Jennifer to employ? ________________________________________ Question 10 As a member of a marketing team, you have been tasked with determining the number of DVDs that people have rented over the past six months. You sample twenty adults and decide that the best display of data is a frequency table for grouped data. Construct this table using four classes. 15,30,28,19,14,18,28,19,10,19,10,24,14,18,24,27,10,18,16,23 ________________________________________ Provide your answer below Question 11 The values and relative frequencies for a set of data are shown below. Complete the cumulative relative frequency table. ________________________________________ ________________________________________ Question 12 The histogram below displays the weights of rainbow trout (in pounds) caught by all visitors at a lake on a Saturday afternoon. According to this histogram, which range of weights (in pounds) contains the lowest frequency? A histogram has a vertical axis labeled Frequency and has a horizontal axis that measures six categories of rainbow trout weight (in pounds). Reading from left-to-right, the weight and frequency of each category are: 4.5 to 6.5 has frequency of 4, 6.5 to 8.5 has frequency 5, 8.5 to 10.5 has frequency 7, 10.5 to 12.5 has frequency 3, 12.5 to 14.5 has frequency 1, 14.5 to 16.5 has frequency 2. ________________________________________ Question 13 Describe the shape of the given histogram. A histogram has a horizontal axis from 0 to 16 in increments of 2 and a vertical axis labeled Frequency from 0 to 10 in increments of 2. The histogram contains vertical bars of width 1 starting at the horizontal axis value 0. The heights of the bars are as follows, where the left horizontal axis label is listed first and the frequency is listed second: 0, 0; 1, 0; 2, 6; 3, 6; 4, 7; 5, 6; 6, 6; 7, 6; 8, 7; 9, 6; 10, 6; 11, 6; 12, 6; 13, 7; 14, 0; 15, 0. ________________________________________ Question 14 A set of data is summarized by the stem and leaf plot below. ________________________________________ There are values in the data set which are greater than or equal to 10 and less than or equal to 19. There are values in the data set which are greater than or equal to 30 and less than or equal to 39. There are values in the data set which are greater than or equal to 20 and less than or equal to 29. Question 15 The bar graph below shows the number of boys and girls in different classes. A bar graph has a horizontal axis labeled Classes and a vertical axis labeled Students from 0 to 16 in increments of 2. There are two vertical bars above each horizontal axis label, with the bar on the left representing Boys and the bar on the right representing Girls. The bars have heights as follows, with the horizontal axis label listed first and the bar heights listed second from left to right: Mrs. Brown, 10 and 15; Ms. James, 11 and 12. How many total students are in Ms. James's class? Do not include the units in your answer. Question 16 The line graph shown below represents the number of TVs in a house by square footage (in hundreds of feet). According to the information above, which of the following is an appropriate analysis of square footage and TVs? A line graph has an x-axis labeled Square Footage (in hundreds of feet) in increments of one, and a y-axis labeled Number of TV's in increments of one. Beginning at the point start parentheses 6,2 end parentheses, a line increases to the point start parentheses 8.5,3 end parentheses. The line remains constant to the point start parentheses 10,3 end parentheses. The line then increases, passing through the point start parentheses 12,5 end parentheses and continues increasing until it reaches the point start parentheses 16,6 end parentheses. ________________________________________ Question 17 Ashley is reviewing past monthly credit card statements. The statements are summarized in the relative frequency table below. What is the cumulative relative frequency of credit card statements that are $1245 or less? ________________________________________ ________________________________________ Question 18 The bar graph below shows the number of men and women in different clubs. A side-by-side bar graph has a horizontal axis labeled Clubs with the classes Drama and Computer and a vertical axis labeled Students from 0 to 16 in increments of 2. Two vertical bars are above each horizontal axis label with the left bar representing Men and the right bar representing Women. The bars have heights as follows, with the horizontal axis label listed first and the bar height listed second: Drama, 11 and 16; Computer, 14 and 14. How many total students are in the Drama Club? ________________________________________ ________________________________________ $$ students Question 19 An English professor asks her students who their favorite character is in the novel they are reading. What is the level of measurement of the data? ________________________________________ Select the correct answer below: ________________________________________ Question 20 Jessica is keeping track of her favorite stock's price. The line graph below shows the data. A line graph titled Stock Price Over Time has a horizontal X-axis labeled Days from 0 to 5 in increments of 1 and a vertical Y-axis labeled Price from 0 to 14 in increments of 2. The graph consists of 6 plotted points connected by line segments from left to right. The coordinates of the plotted points are at left-parenthesis 0 comma 13 right-parenthesis, left-parenthesis 1 comma 3 right-parenthesis, left-parenthesis 2 comma 10 right-parenthesis, left-parenthesis 3 comma 4 right-parenthesis, left-parenthesis 4 comma 14 right-parenthesis, and left-parenthesis 5 comma 12 right-parenthesis. At what day was the price 10? [Show More]
Last updated: 8 months ago
Preview 1 out of 10 pages
Reviews( 1 )

by You Are Beautiful Hair Salon · 3 years ago
Document information
Connected school, study & course
About the document
Uploaded On
Oct 27, 2020
Number of pages
10
Written in

Additional information
This document has been written for:
Uploaded
Oct 27, 2020
Downloads
1
Views
114
.png)
.png)

 – CHAMBERLAIN COLLEGE OF NURSING.png)
 – Chamberlain College of Nursing.png)