Mathematics > QUESTIONS & ANSWERS > MATH 399iLab Week 2 (All)
MATH 399iLab Week 2
Document Content and Description Below
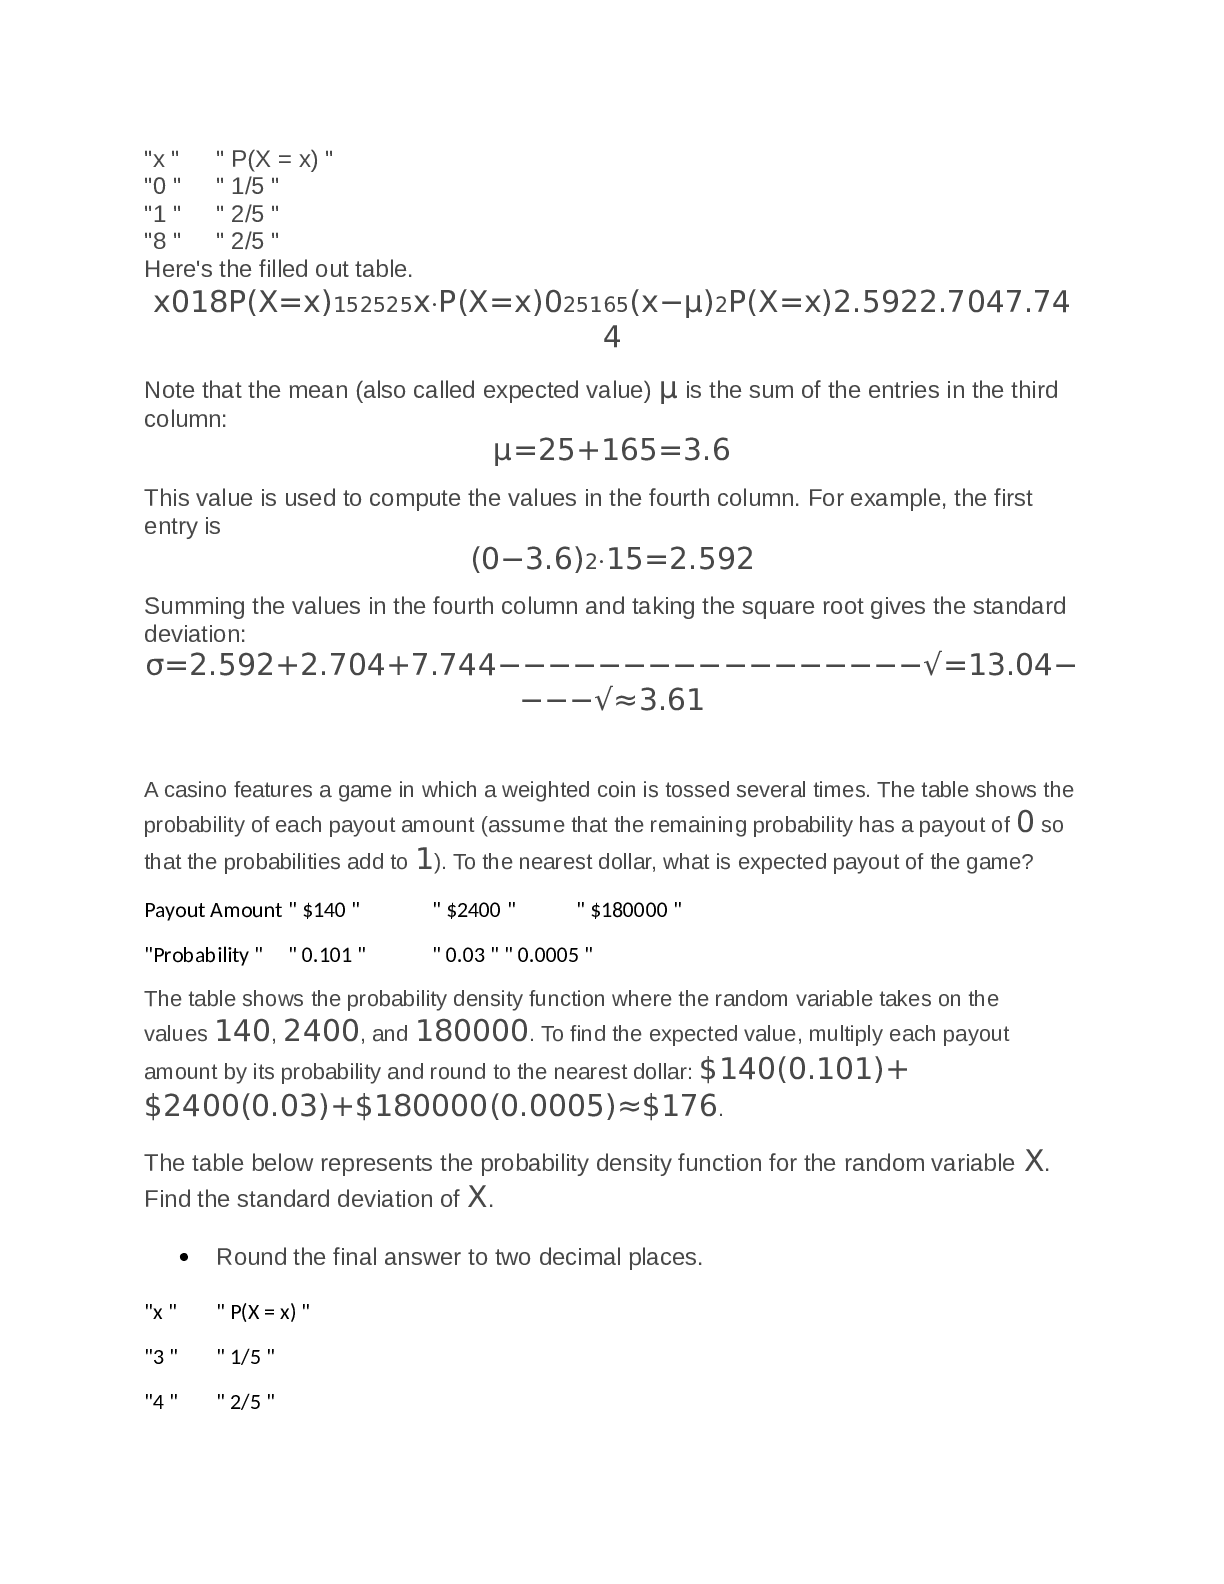
MATH399 Statistics—Lab Week 2 Question 1 is worth 5 points and each question after that is worth 4.5 points, for a total of 50 points for the lab. Name: Statistical Concepts: Using Excel �... �� Graphics Shapes of distributions Descriptive statistics NOTE: Directions for all labs are given based on Excel 2013 for Windows. If you have another version of Excel, you may need to research how to do the same steps. Data in Excel Excel is a powerful, yet user-friendly, data analysis software package. You can launch Excel by finding the icon and double clicking on it. There are detailed instructions on how to obtain the graphs and statistics you need for this lab in each question. There is also a [Show More]
Last updated: 1 year ago
Preview 1 out of 8 pages
.png)
Reviews( 0 )
Document information
Connected school, study & course
About the document
Uploaded On
Jul 31, 2021
Number of pages
8
Written in

Additional information
This document has been written for:
Uploaded
Jul 31, 2021
Downloads
0
Views
47

.png)
.png)


.png)
.png)
.png)
.png)

.png)


.png)
.png)
