Business > Research Paper > Using and Managing Data and Information April cohort (2019 – 2020) BA3020QA - Assignment 3 (All)
Using and Managing Data and Information April cohort (2019 – 2020) BA3020QA - Assignment 3
Document Content and Description Below
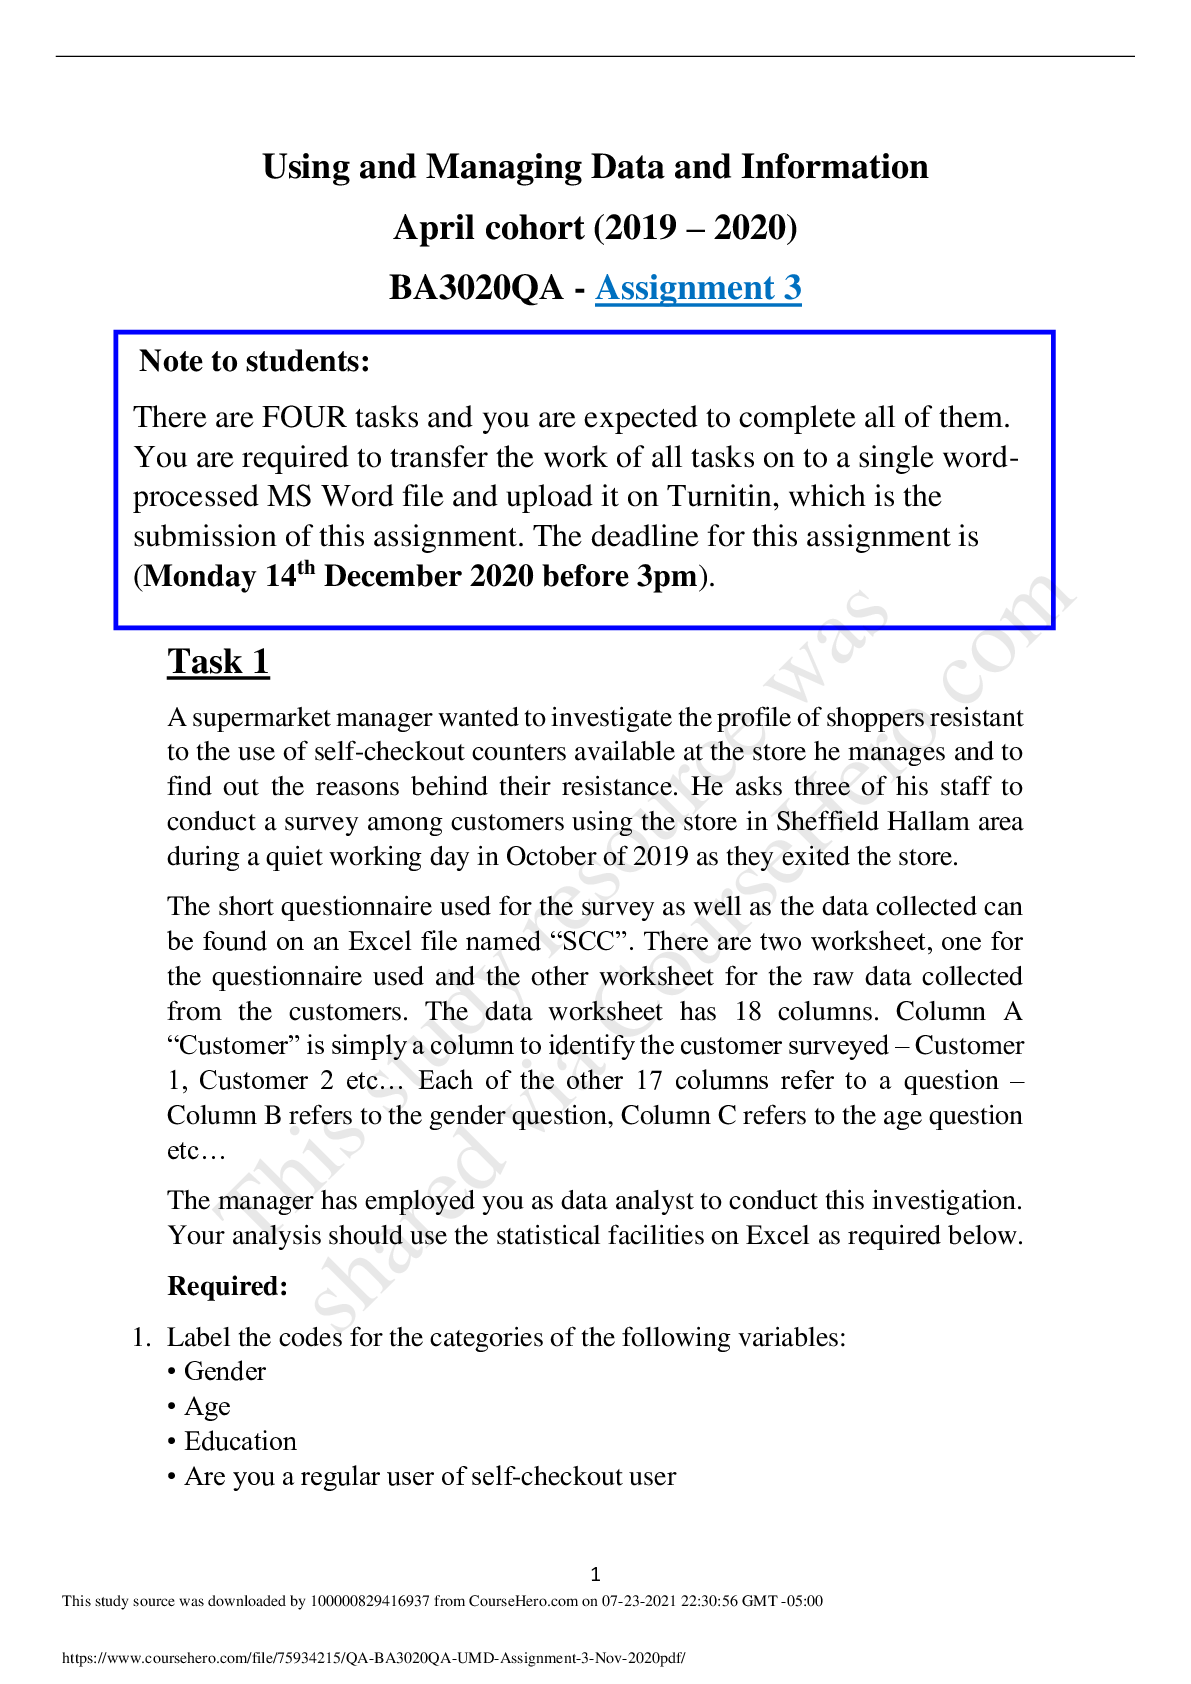
Task 1 A supermarket manager wanted to investigate the profile of shoppers resistant to the use of self-checkout counters available at the store he manages and to find out the reasons behind their ... resistance. He asks three of his staff to conduct a survey among customers using the store in Sheffield Hallam area during a quiet working day in October of 2019 as they exited the store. The short questionnaire used for the survey as well as the data collected can be found on an Excel file named “SCC”. There are two worksheet, one for the questionnaire used and the other worksheet for the raw data collected from the customers. The data worksheet has 18 columns. Column A “Customer” is simply a column to identify the customer surveyed – Customer 1, Customer 2 etc… Each of the other 17 columns refer to a question – Column B refers to the gender question, Column C refers to the age question etc… The manager has employed you as data analyst to conduct this investigation. Your analysis should use the statistical facilities on Excel as required below. Required: 1. Label the codes for the categories of the following variables: • Gender • Age • Education • Are you a regular user of self-checkout user Note to students: There are FOUR tasks and you are expected to complete all of them. You are required to transfer the work of all tasks on to a single wordprocessed MS Word file and upload it on Turnitin, which is the submission of this assignment. The deadline for this assignment is 2. Produce frequency and percentage frequency tables for each of the following variables: • Gender • Education • Age • SCC user • Spending (£) For this last quantitative variable, the categories should be as follows: <100 100- 109 110- 119 120- 129 130- 140 >140 3. Draw the graphical representation for each of the following variables: • Education (Pie chart) • Age (Bar chart) • Spending (Histogram) using the following categories: <100 100- 109 110- 119 120- 129 130- 140 >140 • Spending (Box and whisker) graph 4. Consider now the variable “Spending (£)”. • Calculate the minimum, maximum, median, quartiles and the mean average statistics. • Calculate the mean and standard deviation” split by users (and non-users) of SCC. 5. Produce a cross-table between each of the following two variables and draw an appropriate multiple bar chart: • Are you a regular user of self-checkout user and Gender • Are you a regular user of self-checkout user and Age 6. Draw a scatter diagram and calculate the correlation coefficient of Spending against the reliability total score. [Show More]
Last updated: 1 year ago
Preview 1 out of 5 pages
Reviews( 2 )

by eddiebutnaru · 3 years ago
Hey, thanks for the review. if you also wish to get more quality documents at very cheap prices here is my email [email protected], would you also share with me your email for direct requests. thankyou by Expert Tutor. 2 years ago
by Expert Tutor · 2 years ago
Document information
Connected school, study & course
About the document
Uploaded On
Apr 07, 2021
Number of pages
5
Written in

Additional information
This document has been written for:
Uploaded
Apr 07, 2021
Downloads
2
Views
227


.png)


Interdisciplinary Paper.png)