Mathematics > EXAM > Chamberlain College Of Nursing:MATH 225N Week 8 Latest Questions with Answers–Performing Linear Re (All)
Chamberlain College Of Nursing:MATH 225N Week 8 Latest Questions with Answers–Performing Linear Regressions with Technology (Graded A)
Document Content and Description Below
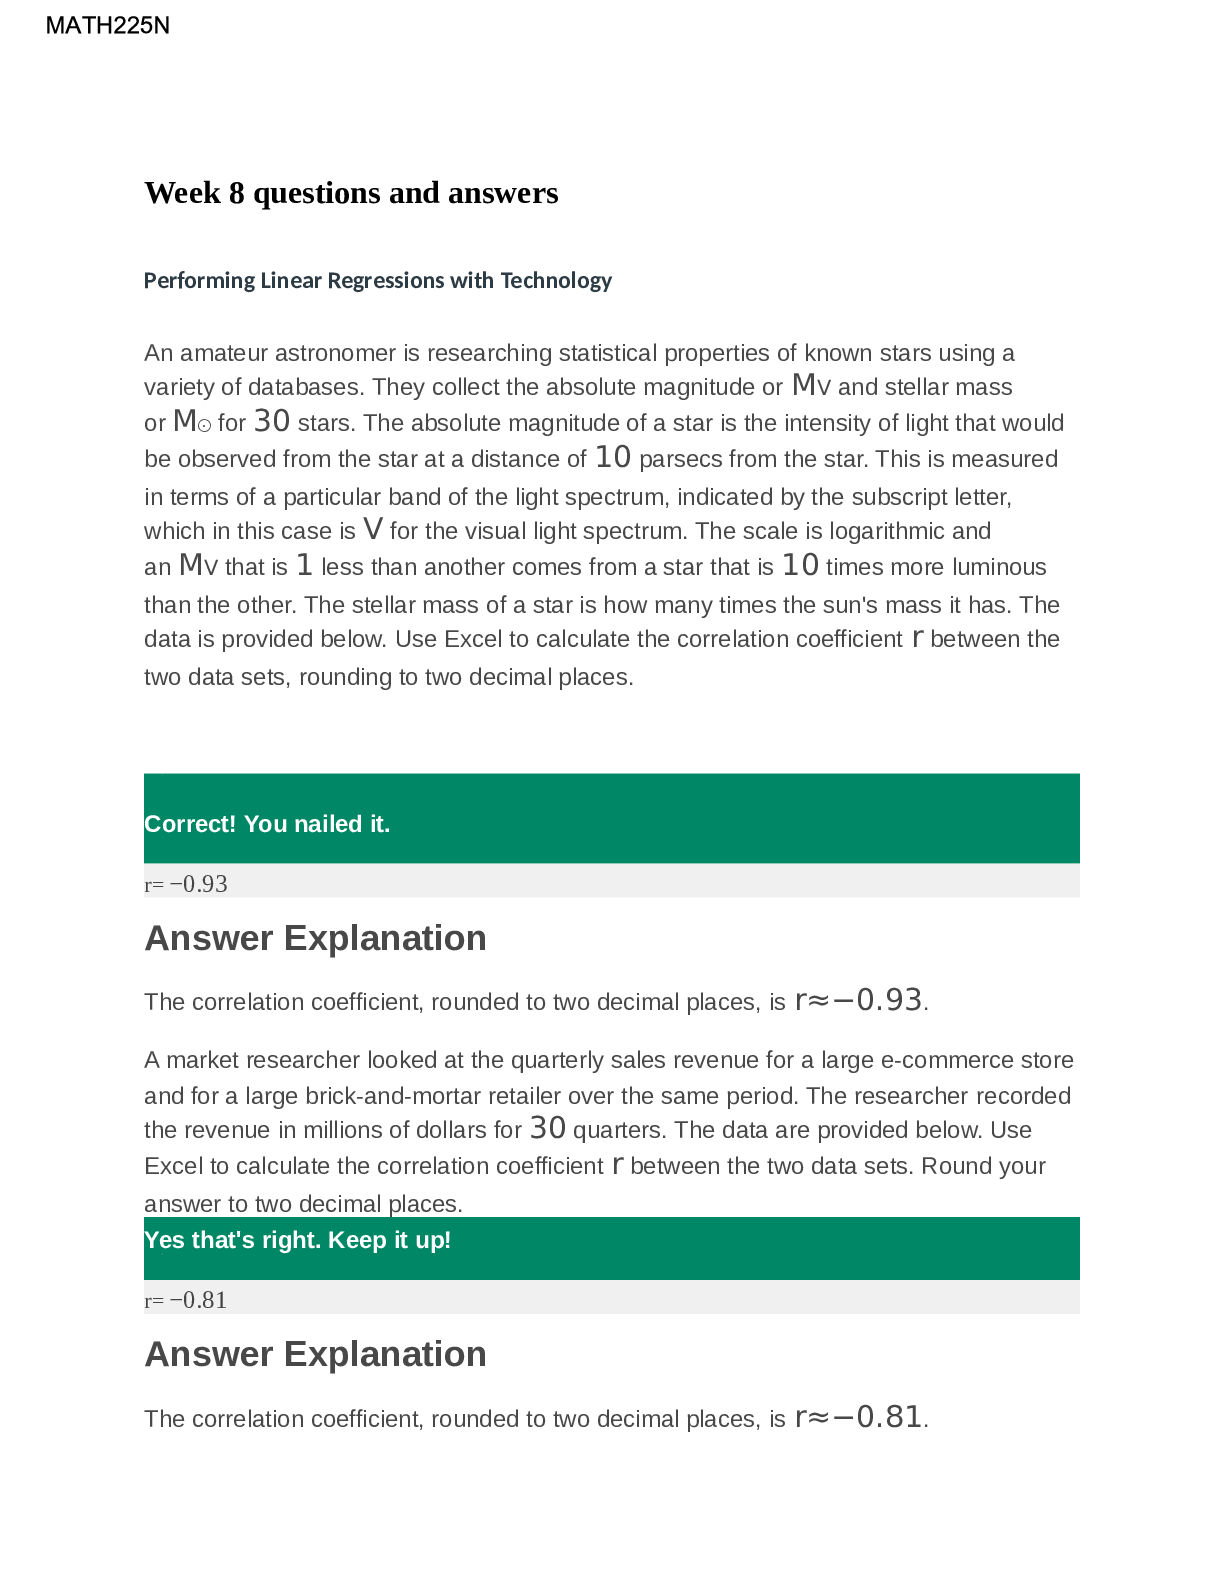
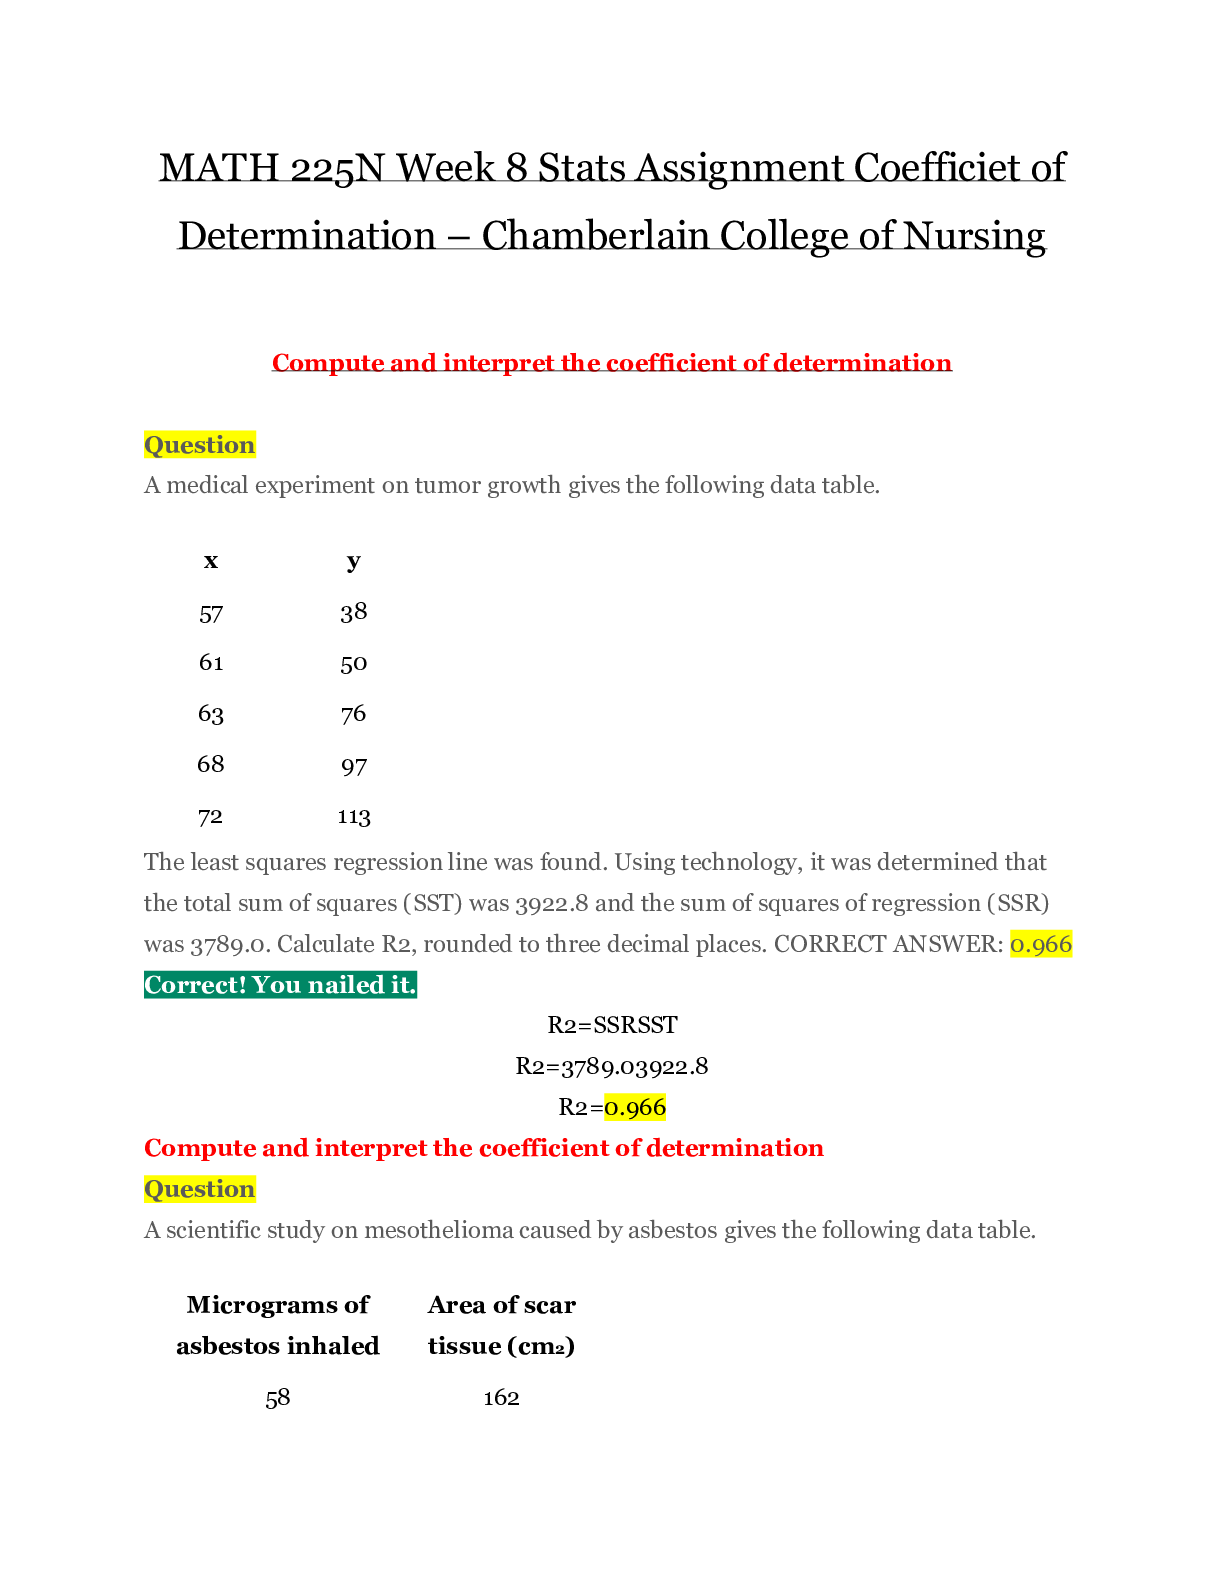
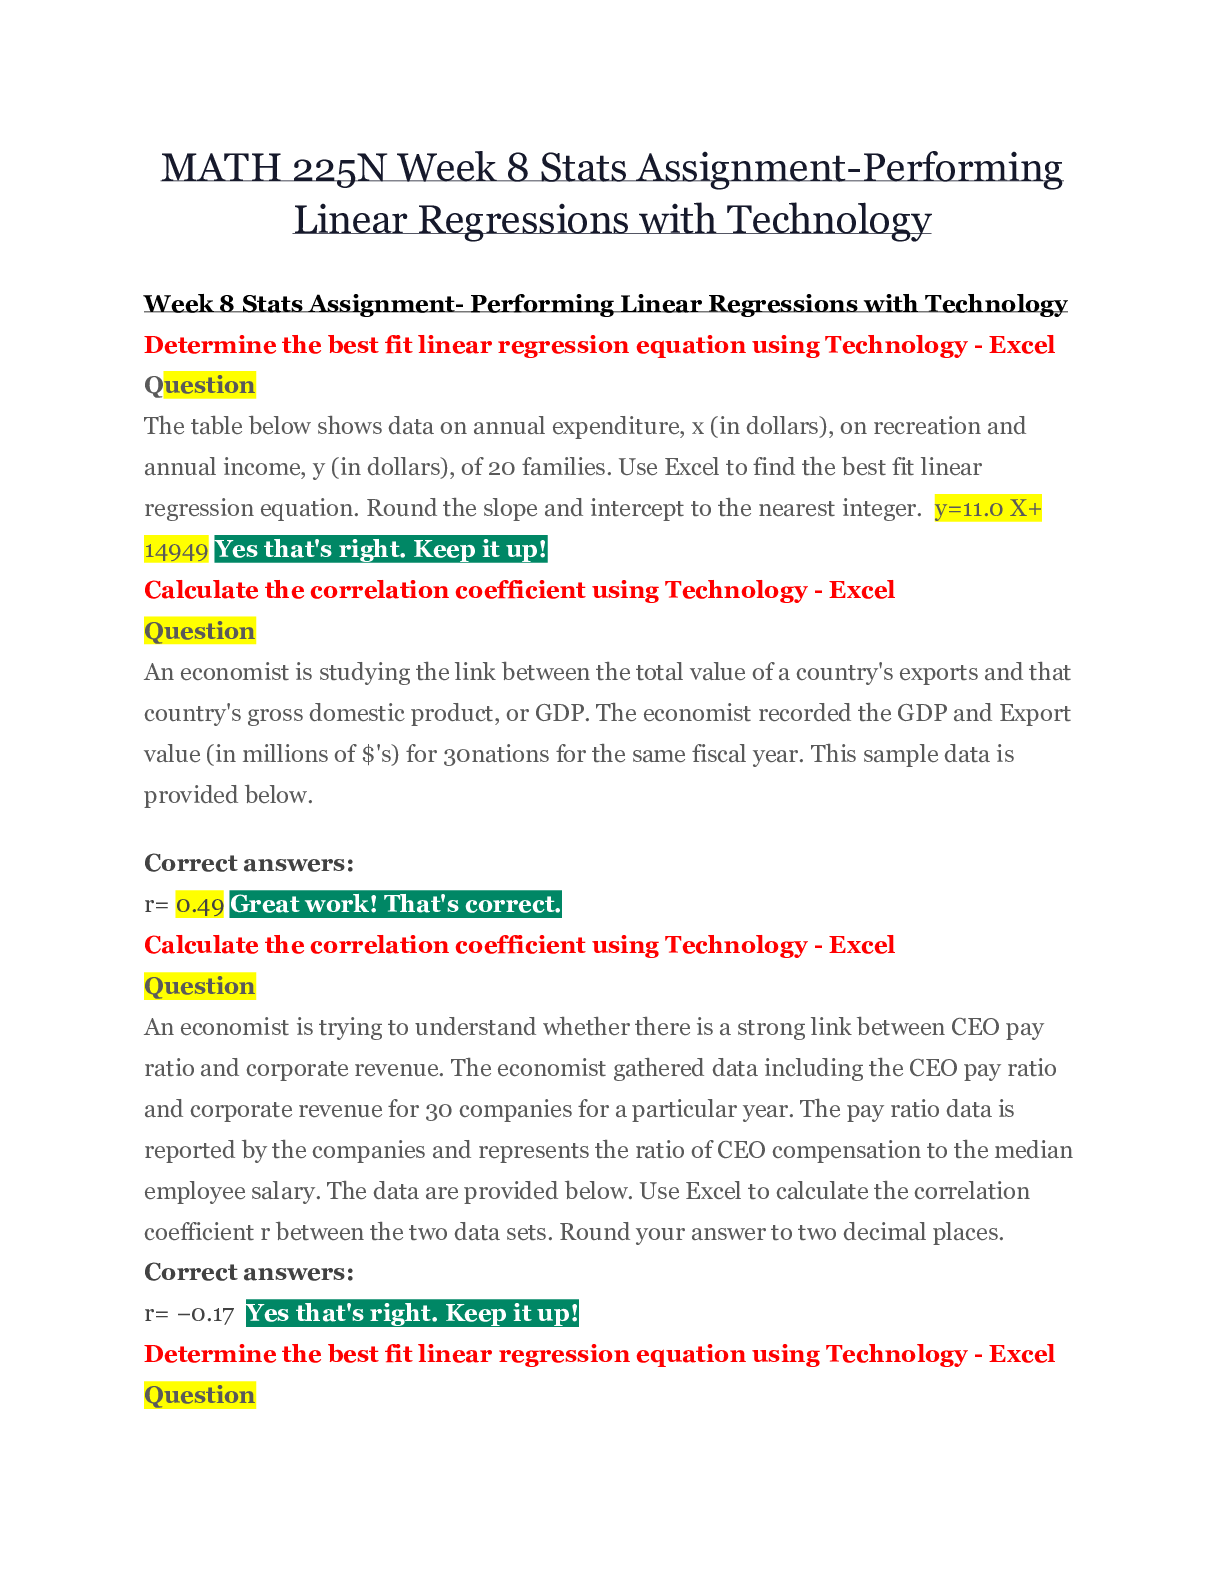
MATH 225N Week 8 Questions with Answers – Performing Linear Regressions with Technology An amateur astronomer is researching statistical properties of known stars using a variety of databases. They ... collect the absolute magnitude or MV and stellar mass or M⊙for 30 stars. The … absolute magnitude of a star is the intensity of light that would be observed from the star at a distance of 10 parsecs from the star. This is measured in terms of a particular band of the light spectrum, indicated by the subscript letter, which in this case is V for the visual light spectrum. The scale is logarithmic and an MV that is 1 less than another comes from a star that is 10 times more luminous than the other. The stellar … mass of a star is how many times the sun’s mass it has. The data is provided below. Use Excel to calculate the correlation coefficient r between the two data sets, rounding to two decimal places. The table shows data collected on the relationship between the time spent studying per day and the time spent reading per day. The line of best fit for the data is yˆ=0.16x 36.2. Assume the line of best fit is significant and there is a strong linear relationship between the variables……. Studying (Minutes) Reading (Minutes) …… (a) According to the line of best fit, what would be the predicted number of minutes spent reading for someone who spent 67 minutes studying? Round your answer to two decimal places. The table shows data collected on the … relationship between the time spent studying per day and the time spent reading per day. The line of best fit for the data is yˆ=0.16x 36.2…… Studying (Minutes) Reading (Minutes) …… (a) According to the line of best fit, the predicted number of minutes spent reading for someone who spent 67 minutes studying is 46.92…… (b) Is it reasonable to use this line of best fit to make the above prediction? Data is collected on the relationship between the average daily temperature and time spent watching television. The data is … shown in the table and the line of best fit for the data is y^=−0.81x 96.7. Assume the line of best fit is significant and there is a strong linear relationship between the variables……. Temperature (Degrees) Minutes Watching Television ……. (a) According to the line of best fit, what would be the predicted number of minutes spent watching television for an average daily temperature of 45 degrees? Round your answer to two … decimal places. Data is collected on the relationship between the average daily temperature and time spent watching television. The data is … shown in the table and the line of best fit for the data is y^=−0.81x 96.7…… Temperature (Degrees) Minutes Watching Television ……. (a) According to the line of best fit, the predicted number of minutes spent watching television for an average daily temperature of 45 degrees is 25……. (b) Is it reasonable to use this line of best fit to make the above prediction? Homer is studying the relationship between the average daily temperature and time spent watching television and … has collected the data shown in the table. The line of best fit for the data is yˆ=−0.6x 94.5. Assume the line of best fit is significant and there is a strong linear relationship between the variables……. Temperature (Degrees) Minutes Watching Television ….. According to the line of best fit, what would be the predicted number of minutes spent watching television for an … average daily temperature of 39 degrees? Round your answer to two decimal places, as needed. Homer is studying the relationship between the average daily temperature and time spent watching television and has collected the data shown in the table. The line of best fit for the data is yˆ=−0.6x 94.5……. Temperature (Degrees) Minutes Watching Television ……. (a) According to the line of best fit, the … predicted number of minutes spent watching television for an average daily temperature of 39 degrees is 1. ……. (b) Is it reasonable to use this line of best fit to make the above prediction? Daniel owns a business consulting service. For each consultation, he charges $95 plus $70 per hour of work. A linear equation that expresses the total amount of money Daniel earns per consultation is y=70x 95. What are the independent and dependent variables? What is the y-intercept and the slope? Given the following line, find the value of y when x=2. ……. y=−4x−12 Evaluate … the linear equation, y=4x−7, at the value x=2. Evan owns a house cleaning service. For each house visit, he charges $55 plus $30 per hour of work. A linear equation that expresses the total amount of money Evan earns per visit is y=55 30x…….. What are the independent and dependent variables? What is the y-intercept and the slope? Using a calculator or statistical software, find the linear regression line for the data in the table below.……. Enter your answer in the form y=mx b, with mand b both rounded to two decimal places. Using a calculator or statistical software, find the linear regression line for the data in the table below.……. Enter your answer in the form y=mx b, with mand b both rounded to two decimal places. A least squares regression line (best-fit line) has the equation, yˆ=2.87x−43.5. What is the slope of this linear regression equation? Researchers want to find the relationship between age and average weight in female children. Using a calculator or … statistical software, find the linear regression line for the 2012 CDC data below for average weights of female children by age. Given that n=31data points are collected when studying the relationship between average daily temperature and time spent sleeping, use the critical values table below to determine if a … calculated value of r=−0.324is significant or not. In studying the relationship between age and eating fast food, suppose you computed r=0.133 using n=19data points. Using the critical values table below, determine if the value of r is significant or not. Data is collected on the relationship between the time spent doing homework per day and the time … spent taking notes per day. The data is shown in the table and the line of best fit for the data is yˆ=0.175x 31.0. Assume the line of best fit is significant and there is a strong linear relationship between the variables…….. (a) According to the line of best fit, what would be the predicted number of minutes spent taking notes for someone who spent 137 minutes doing homework? Round your answer to… two decimal places, as needed. Michelle is studying the relationship between the hours worked (per week) and time spent reading (per day) and has collected the data shown in the table. The line of best fit for the data is yˆ=−0.79x 98.8. Assume the line of best fit is significant and there is a strong linear relationship between the variables….. Hours Worked (per week) Minutes Reading (per day) ……. (a) According to the line of best fit, what … would be the predicted number of minutes spent reading for a person who works 27hours (per week)? Round your answer to two decimal places, as needed. Michelle is studying the relationship between the hours worked (per week) and time spent reading (per day) and has collected the data shown in the table. The line of best fit for the data is yˆ=−0.79x 98.8……. Hours Worked (per week) Minutes Reading (per day) ……. (a) According to the line of best fit, the predicted number of minutes spent reading for a person who works 27 hours (per week) is 77.47…….. (b) Is it reasonable to use this line of best fit to make the above prediction? The table shows data collected on the relationship between time spent playing video games and time spent with family. The line of best fit for the data is yˆ=−0.24x 71.7. Assume the line of best fit is significant and there is a strong linear relationship between the variables…… Video Games (Minutes) Time with Family (Minutes) ……. (a) According to the line of best fit, what … would be the predicted number of minutes spent with family for someone who spent 87 minutes playing video games? Round your answer to two decimal places. The table shows data collected on the relationship between time spent playing video games and time spent with family. The line of best fit for the data is yˆ=−0.24x 71.7……. Video Games (Minutes) Time with Family (Minutes) …… (a) According to the line of best fit, the predicted number of minutes spent with family for someone who spent 87 minutes playing video games is 50.82…….. (b) Is it reasonable to use this line of best fit to make … the above prediction? A scientific study on calorie intake gives the following data table…….. Using technology, it was determined that the total sum of squares (SST)was 76, the sum of squares regression (SSR) was 54.850, and the sum of squares due to error (SSE) was 21.150. Calculate R2 and determine its meaning. Round your answer to four decimal places? A non-profit finds that donations decrease when the economy measured by GDP decreases…….. Identify the relation between donations and GDP. Which of the following data sets or plots … could have a regression line with a negative slope. A gym teacher finds that the distance students run in miles per week in gym class, D, is dependent on the time students warm-up beforehand in minutes per week, x, and can be modeled by the function……. D(x)=2 0.5x…….. Draw the graph of the distance function … by plotting its D-intercept and another point. Which of the following data sets or plots could have a regression line with a negative y-intercept [Show More]
Last updated: 1 year ago
Preview 1 out of 54 pages
Reviews( 0 )
Document information
Connected school, study & course
About the document
Uploaded On
Apr 28, 2020
Number of pages
54
Written in

Additional information
This document has been written for:
Uploaded
Apr 28, 2020
Downloads
0
Views
64