Mathematics > PROJECT REPORT > MATH-533 Week 2 Course Project, Part A – Exploratory Data Analysis- Graded An A+ (All)
MATH-533 Week 2 Course Project, Part A – Exploratory Data Analysis- Graded An A+
Document Content and Description Below
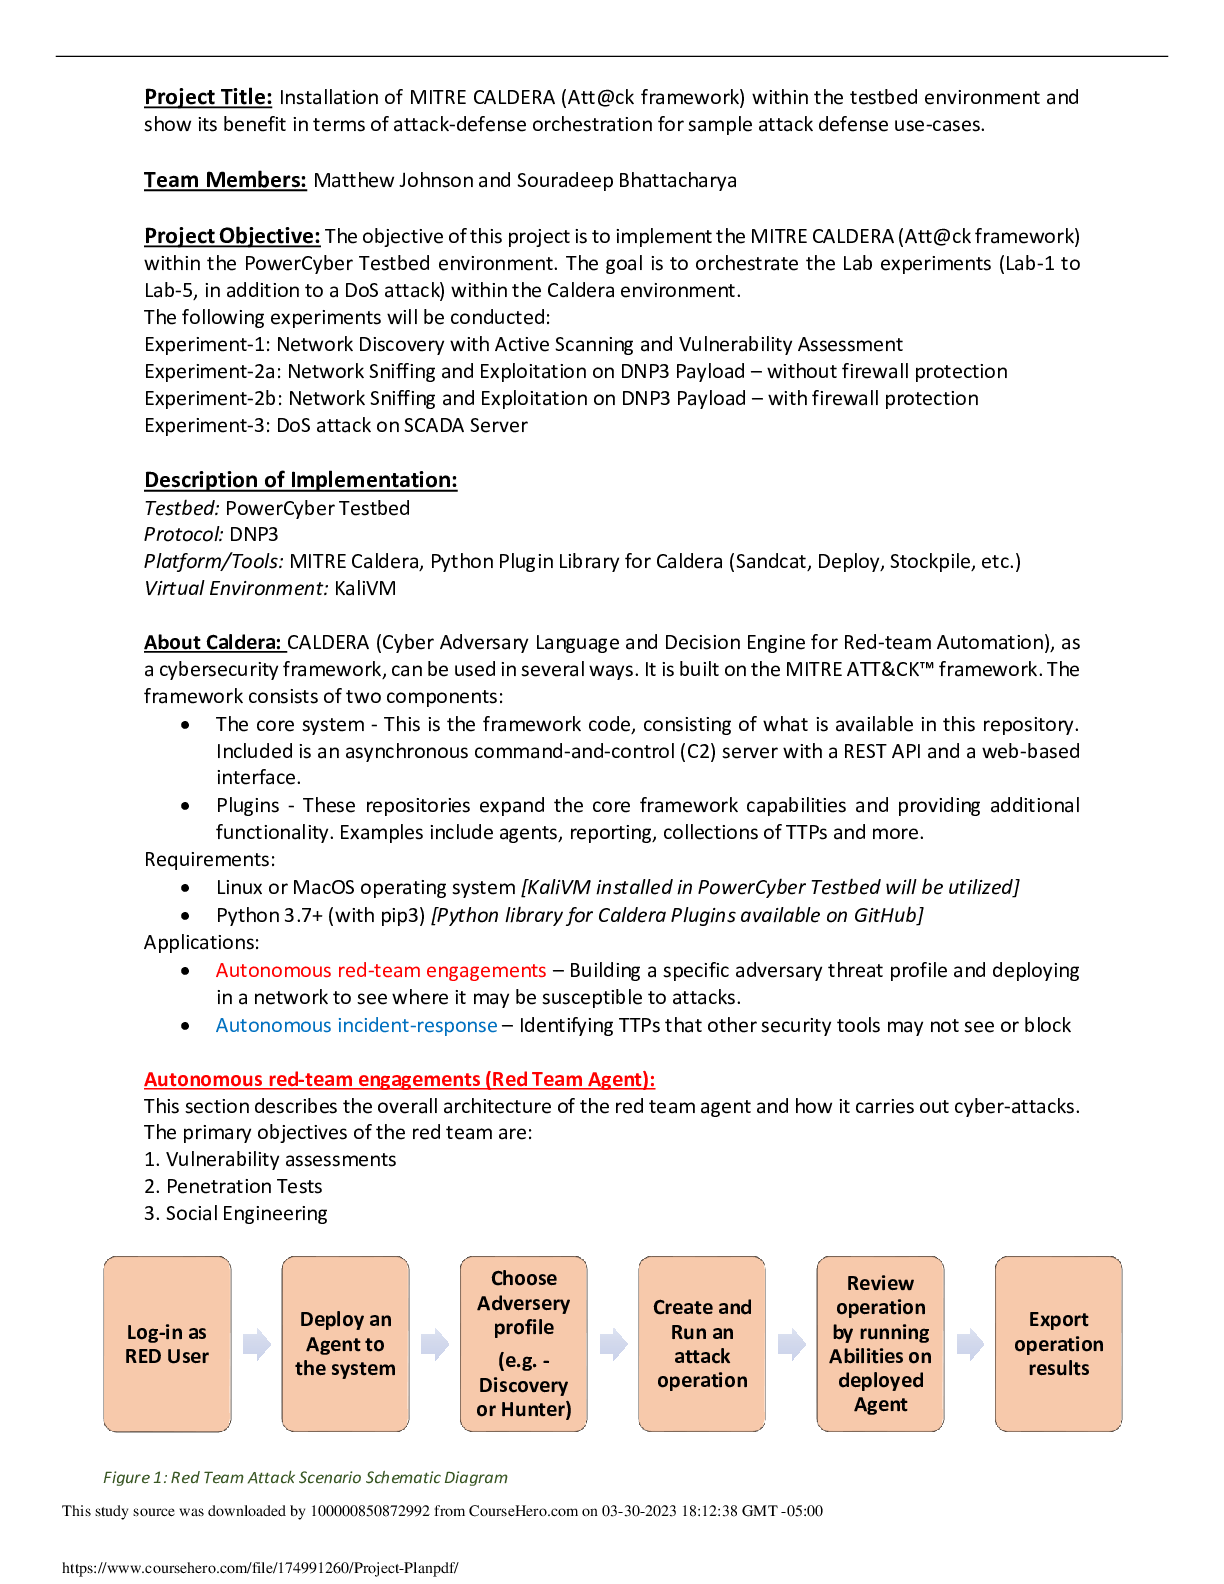
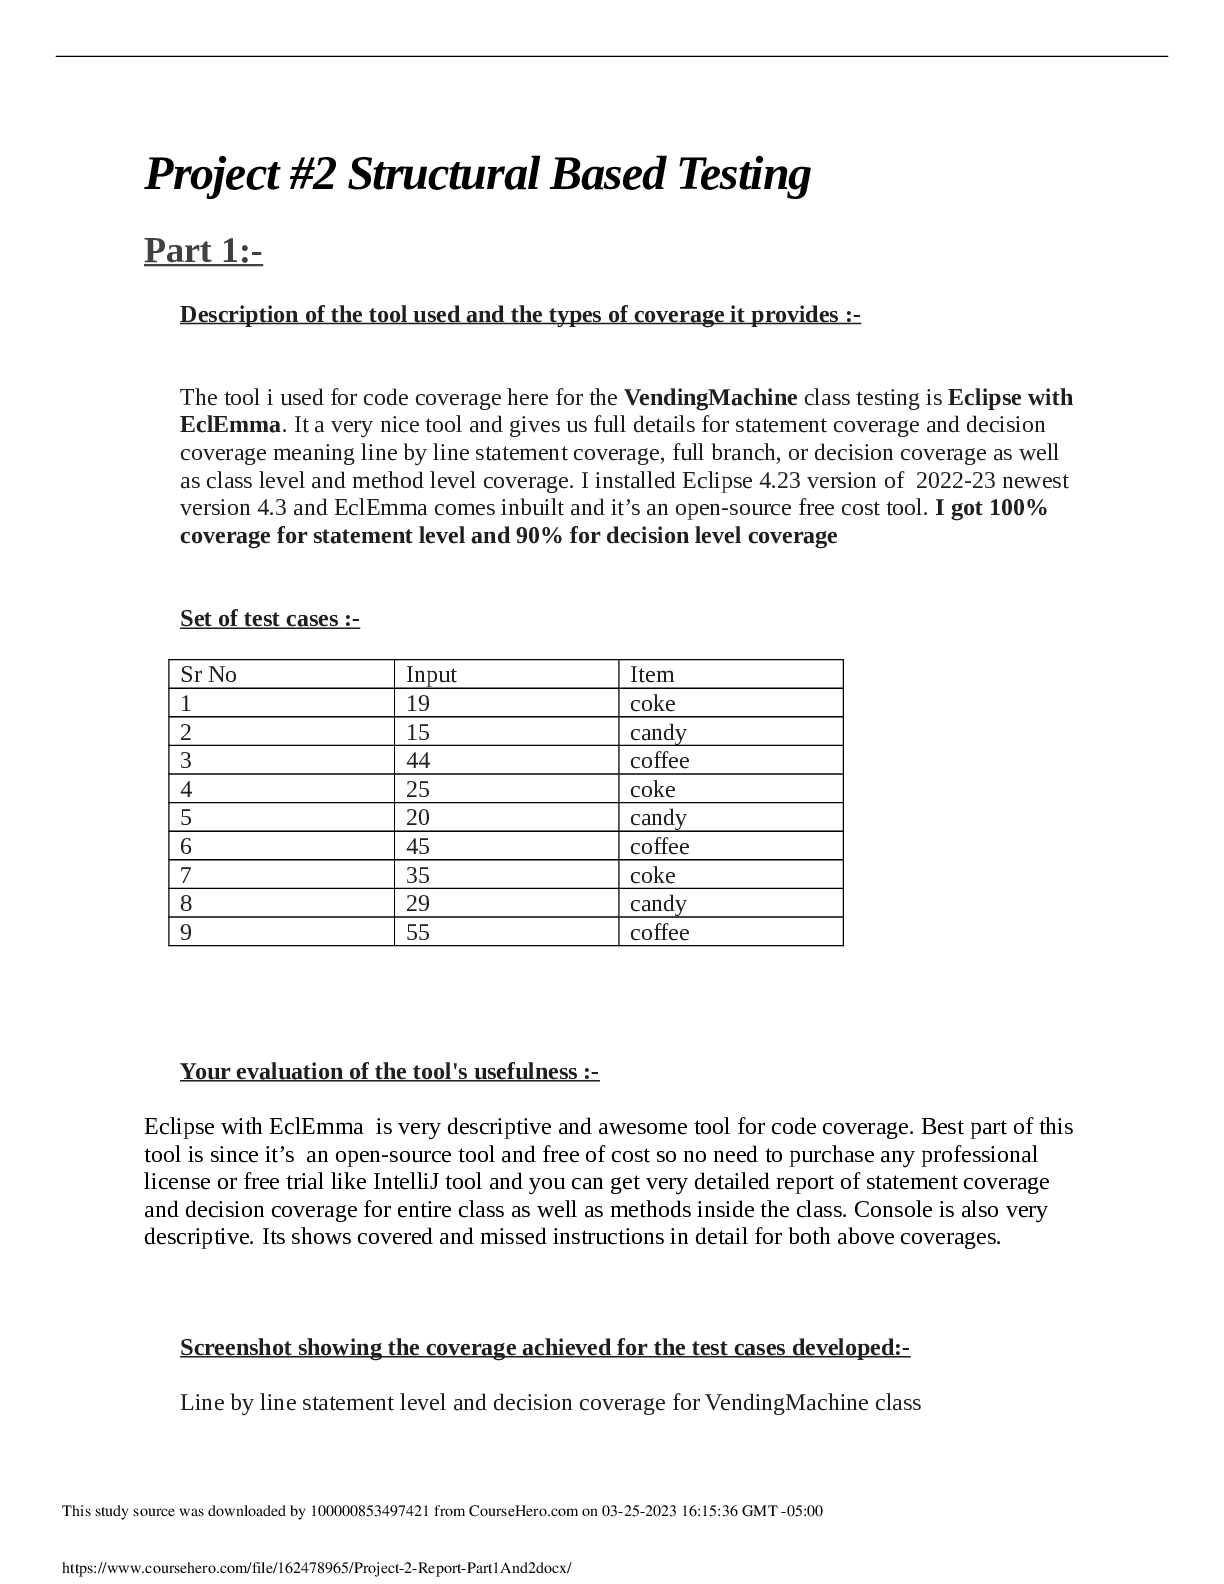
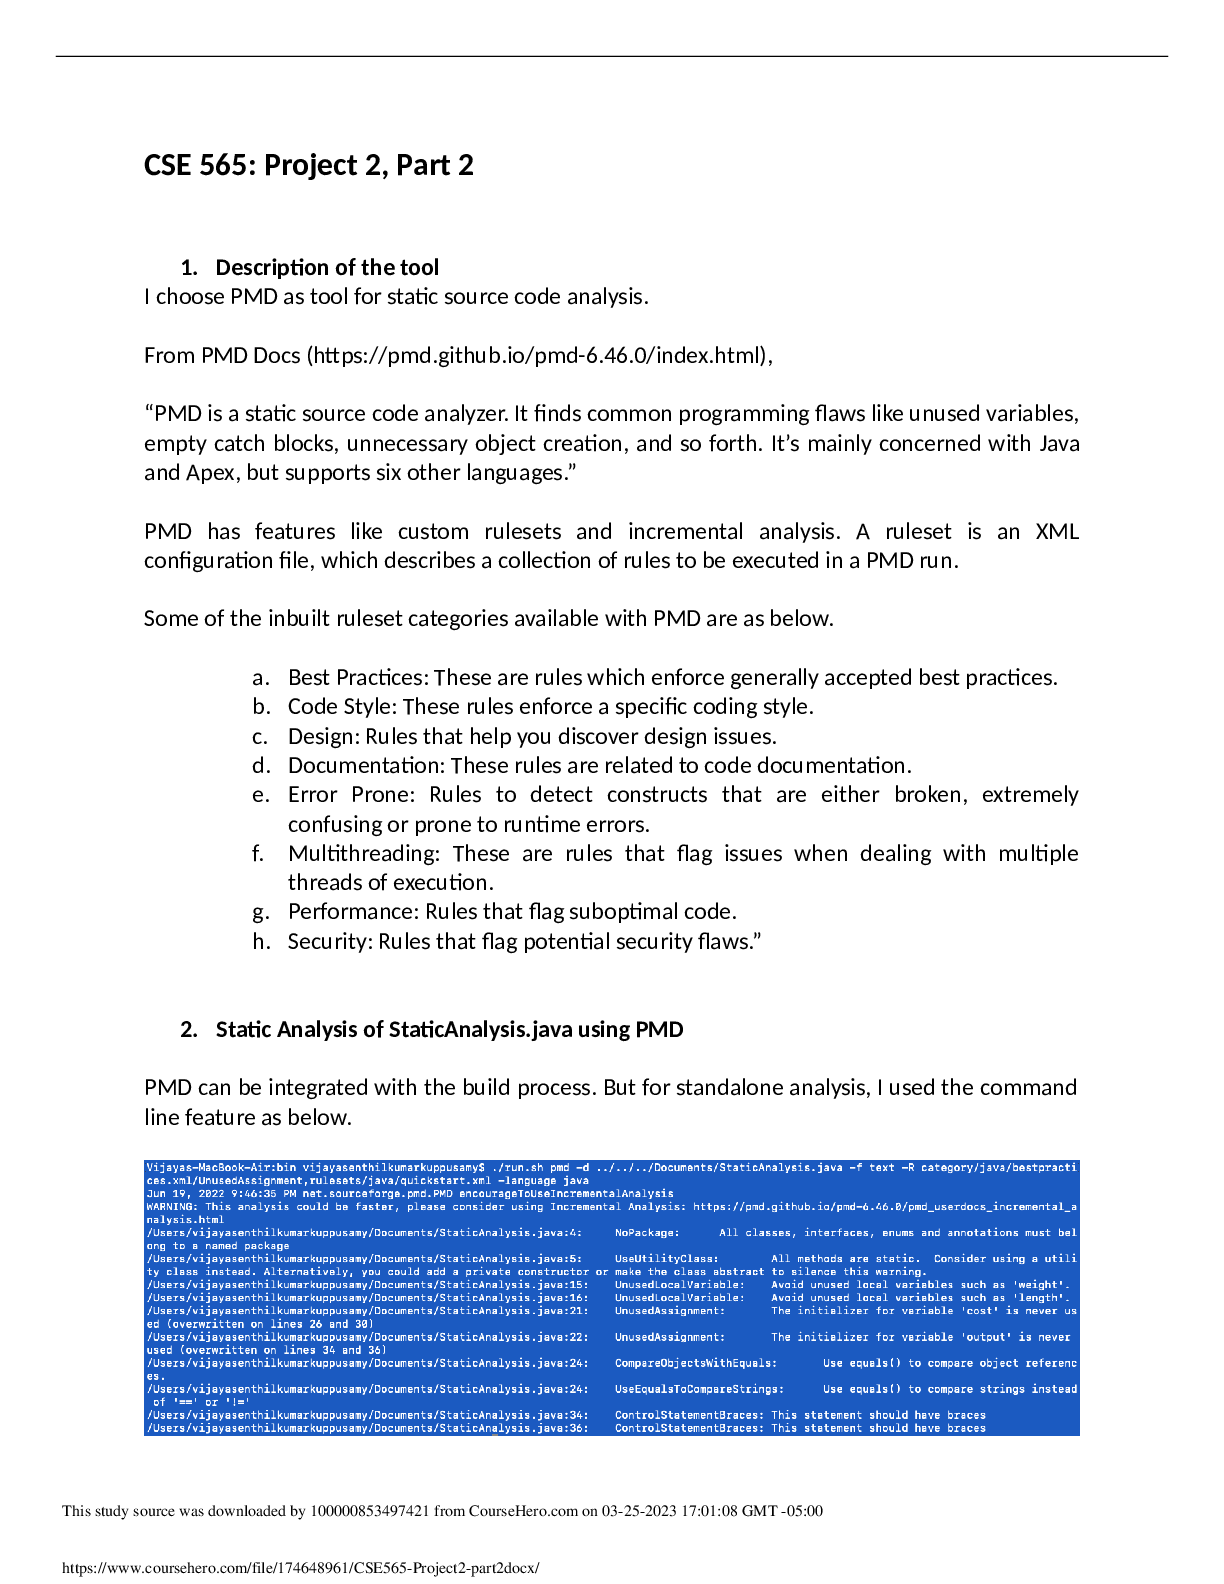
MATH-533 Week 2 Course Project, Part A – Exploratory Data Analysis- Graded An A+ Introduction This study will present a detailed statistical analysis of a given data set from a sam... ple of credit customers in the department chain stores AJ Davis. The purpose of the study is to understand the customers in order for AJ Davis to expand their business The study will try to define the correlation between; income, years, and Credit Balance. For example: Is the longer the customer lives at that current location, the higher the income and credit balance? Which characteristics of customers should AJ Department stores rely on increase their sales. Data Analysis The first variable is location; it is a categorical variable (Qualitative Data). The three subcategories are Urban, Suburban, and Rural. Hence, this variable is a categorical variable, the measures of central tendency and descriptive statistics has not been calculated for this variable. The frequency distribution and pie chart are given as follows: From the frequency distribution and pie chart, it is evident that the urban category (44%) has the maximum number of customers, followed by the suburban category (30%), the remaining (26%) of the customers are belong to the rural category. The second individual variable considered is Size. It is a quantitative variable. The measures of central tendency, variation and other descriptive statistics have been calculated for this variable and are given as follows: Variable N Mean SE Mean StDev Minimu m Q1 Media n Q3 Maximum Size 50 4.5 0.357 2.525 1.000 2.000 4.500 7.000 8.000 The mean household size of the customers is given as 4.5. The median of the data is 4.5 and the mode is 2. The standard deviation is given approximately as 2.525. Maximum number of customers has a household size of 8 and 1 as is evident from the bar graph. The third individual variable considered is Credit Balance. It is a quantitative variable. The measures of central tendency, variation and other descriptive statistics have been calculated for this variable and are given as follows: Variable N Mean SE Mean StDev Minimu m Q1 Media n Q3 Maximum Size 50 4153 132 932 2047 3292 4273 4931 5861 The mean credit balance of the customers is given as $4153. The standard deviation is given approximately as 932. The credit balance of the customers is more or less normally distributed with the peak of the bell shaped distribution lying in the range $3292 - $4931. Thus, maximum number of customers has a credit balance within this range. The relationship between the location and Income is illustrated in the following Bar Chart: From the Bar Chart, we can conclude that urban customers have the higher income, and then followed by suburban and rural. The relationship between the location and size is illustrated in the following Stacked Bar Chart: From the Stacked Bar Chart, we can conclude that most of the family that have size of 1 and 2 are located in the urban area, while the family that have size of 7 and 8 are located in the rural area followed by suburban area. The relationship between the variables Income and Size is illustrated in the following Fitted line Plot: From the fitted line plot, we can conclude that there is no definite relationship or association between the two variables. The points are haphazard and do not exhibit any Size. following scatter plot: versa. following scatter plot: relationship. The points are haphazard and do not exhibit any specific pattern. In other words, there is significant correlation among the variables Years and Credit Balance. strongly conclusive of the Credit Balance of the customers in the respective department store. Conclusion Years, Income, and Credit Balance seem to have a correlation to one another. most credit balance because of higher income generated. [Show More]
Last updated: 1 week ago
Preview 1 out of 8 pages
Reviews( 0 )
Document information
Connected school, study & course
About the document
Uploaded On
Apr 26, 2024
Number of pages
8
Written in
Additional information
This document has been written for:
Uploaded
Apr 26, 2024
Downloads
0
Views
5

