Information Technology > QUESTIONS & ANSWERS > Georgia tech, Question 5.1, All Questions with accurate answers, Graded A (All)
Georgia tech, Question 5.1, All Questions with accurate answers, Graded A
Document Content and Description Below
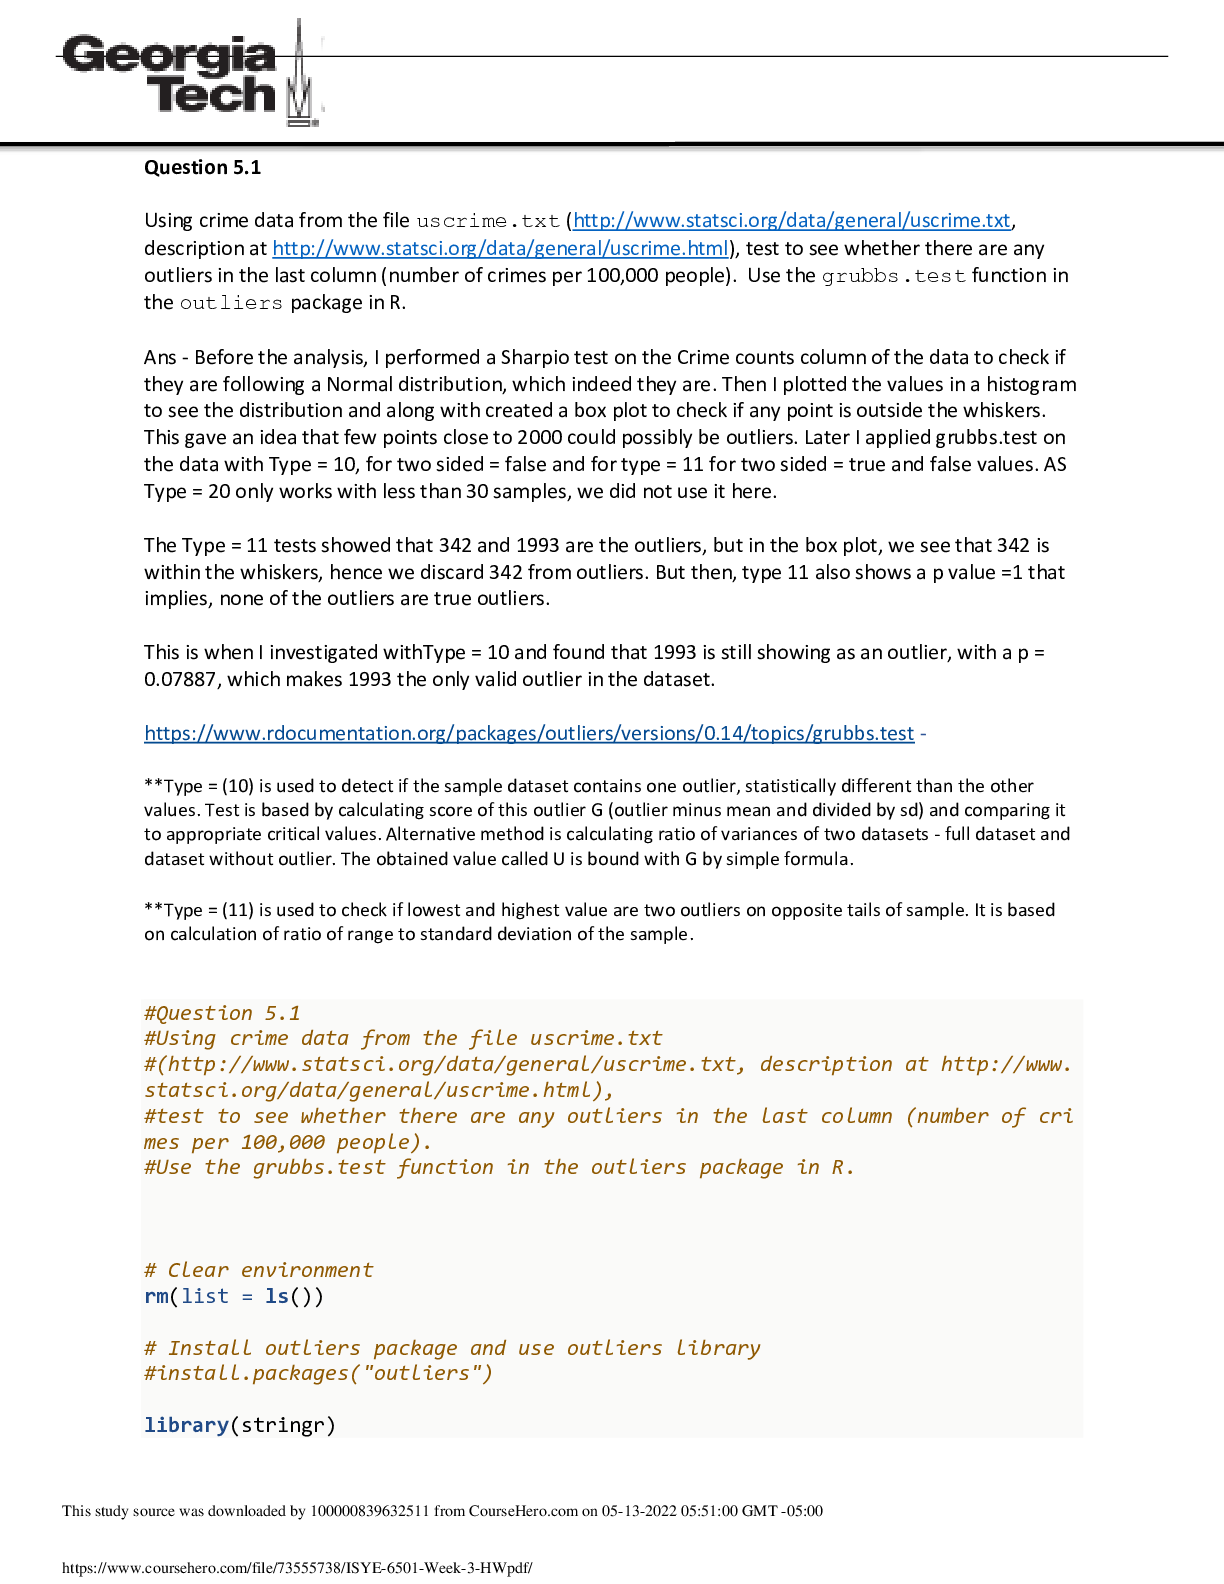
Question 5.1 Using crime data from the file uscrime.txt (http://www.statsci.org/data/general/uscrime.txt, description at http://www.statsci.org/data/general/uscrime.html), test to see whether there ... are any outliers in the last column (number of crimes per 100,000 people). Use the grubbs.test function in the outliers package in R. Ans - Before the analysis, I performed a Sharpio test on the Crime counts column of the data to check if they are following a Normal distribution, which indeed they are. Then I plotted the values in a histogram to see the distribution and along with created a box plot to check if any point is outside the whiskers. This gave an idea that few points close to 2000 could possibly be outliers. Later I applied grubbs.test on the data with Type = 10, for two sided = false and for type = 11 for two sided = true and false values. AS Type = 20 only works with less than 30 samples, we did not use it here. The Type = 11 tests showed that 342 and 1993 are the outliers, but in the box plot, we see that 342 is within the whiskers, hence we discard 342 from outliers. But then, type 11 also shows a p value =1 that implies, none of the outliers are true outliers. This is when I investigated withType = 10 and found that 1993 is still showing as an outlier, with a p = 0.07887, which makes 1993 the only valid outlier in the dataset. https://www.rdocumentation.org/packages/outliers/versions/0.14/topics/grubbs.test - **Type = (10) is used to detect if the sample dataset contains one outlier, statistically different than the other values. Test is based by calculating score of this outlier G (outlier minus mean and divided by sd) and comparing it to appropriate critical values. Alternative method is calculating ratio of variances of two datasets - full dataset and dataset without outlier. The obtained value called U is bound with G by simple formula. **Type = (11) is used to check if lowest and highest value are two outliers on opposite tails of sample. It is based on calculation of ratio of range to standard deviation of the sample. #Question 5.1 #Using crime data from the file uscrime.txt #(http://www.statsci.org/data/general/uscrime.txt, description at http://www. statsci.org/data/general/uscrime.html), #test to see whether there are any outliers in the last column (number of cri mes per 100,000 people). #Use the grubbs.test function in the outliers package in R. # Clear environment rm(list = ls()) # Install outliers package and use outliers library #install.packages("outliers") library(stringr) This study source was downloaded by 100000839632511 from CourseHero.com on 05-13-2022 05:51:00 GMT -05:00 https://www.coursehero.com/file/73555738/ISYE-6501-Week-3-HWpdf/library(outliers) library(outliers) library(data.table) library(ggplot2) library(grid) library(gridExtra) library(gtable) library(stringr) # Import the data data <- read.table("C:\\Users\\AmolJ\\Downloads\\Homework\\week3\\uscrime.txt ", header = TRUE) #take only the crime column Crime_Count <- data[["Crime"]] #check if they are normally distributed shapiro.test(Crime_Count) ## ## Shapiro-Wilk normality test ## ## data: Crime_Count ## W = 0.91273, p-value = 0.001882 #create distribution of the data gg1 <-ggplotGrob(ggplot(data,aes(Crime_Count))+geom_histogram(fill ="blue",co lor ="black",binwidth =50)) #create a box plot of the data gg2 <-ggplotGrob(ggplot(data,aes(y=Crime_Count))+geom_boxplot()+coord_flip()+ theme_void()+theme(legend.position="none")) #combine g <-gtable_matrix("distribution",matrix(list(gg2, gg1),ncol=1),widths =unit(6. 5,"in"),heights =unit(c(0.5,3),"in")) #plot grid::grid.draw(g) [Show More]
Last updated: 1 year ago
Preview 1 out of 5 pages
Reviews( 0 )
Document information
Connected school, study & course
About the document
Uploaded On
Sep 03, 2022
Number of pages
5
Written in
Additional information
This document has been written for:
Uploaded
Sep 03, 2022
Downloads
0
Views
94
