Engineering > QUESTIONS & ANSWERS > ISYE 6501 19SP01 HW-05 Latest Update | TOP RATED (All)
ISYE 6501 19SP01 HW-05 Latest Update | TOP RATED
Document Content and Description Below
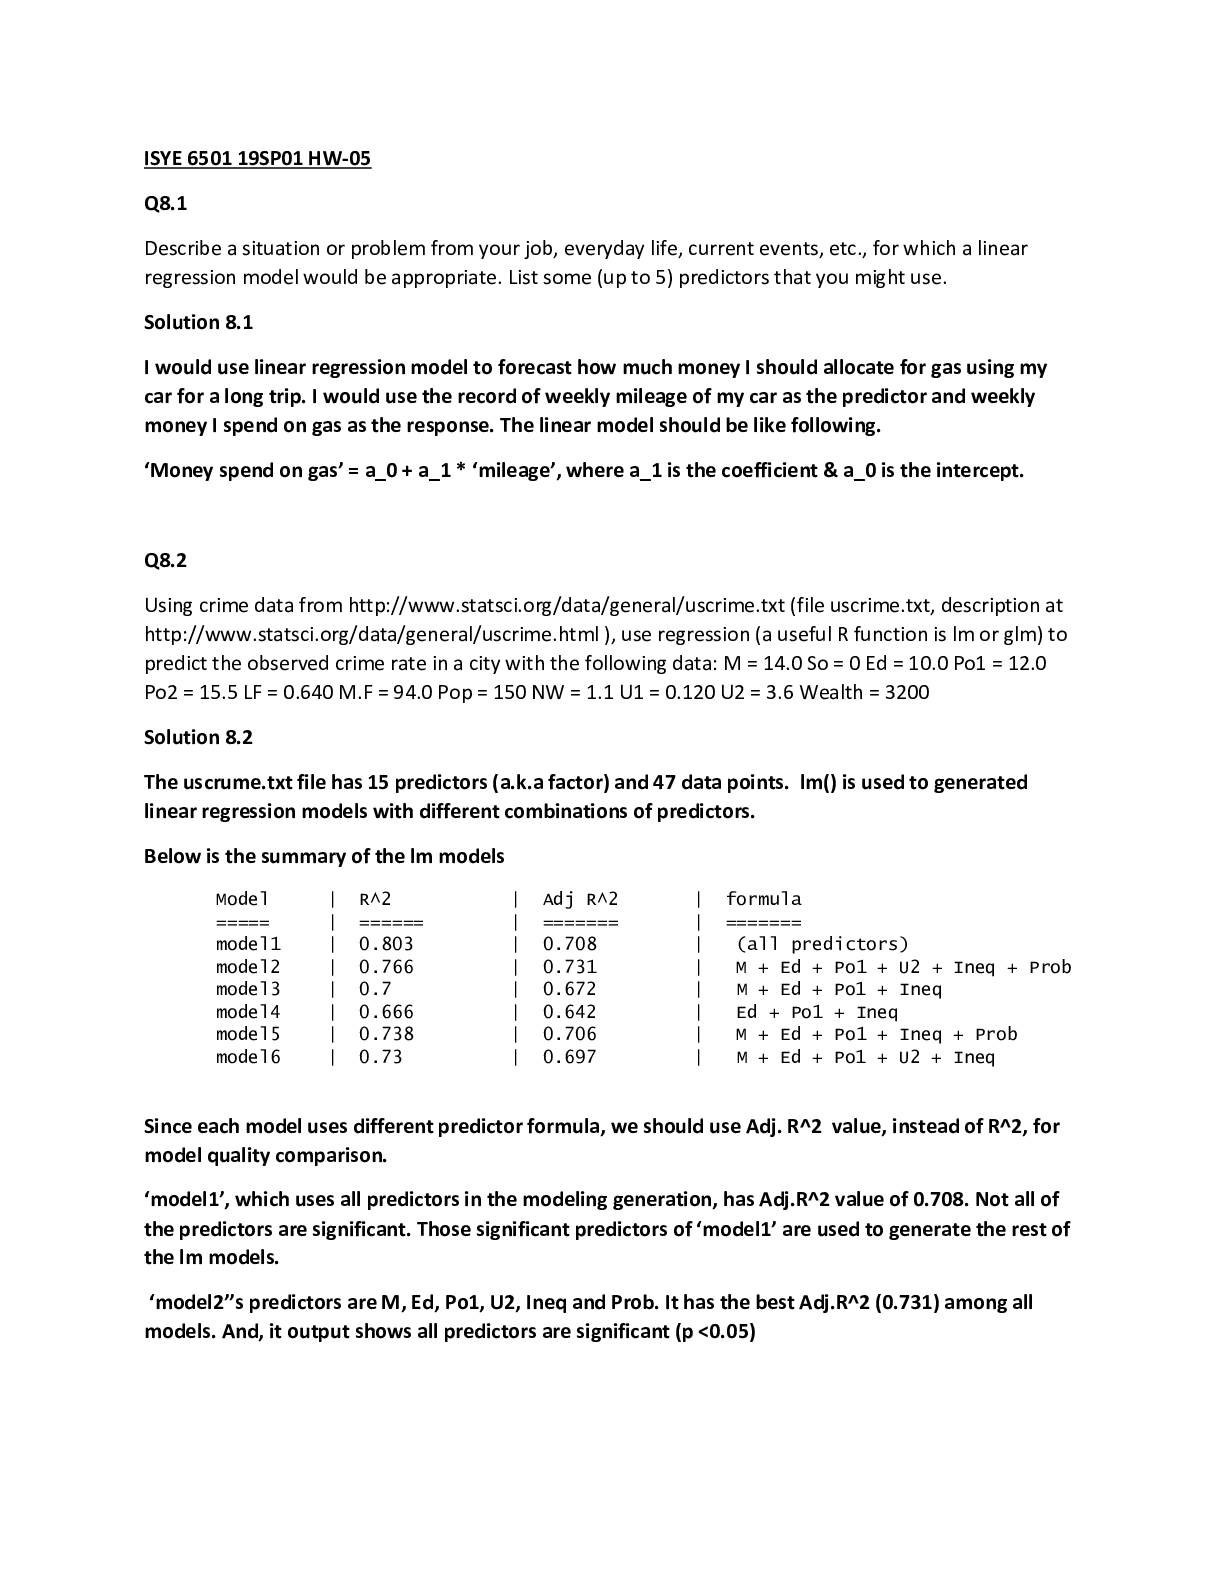
ISYE 6501 19SP01 HW-05 Q8.1 Describe a situation or problem from your job, everyday life, current events, etc., for which a linear regression model would be appropriate. List some (up to 5) predict or... s that you might use. Solution 8.1 I would use linear regression model to forecast how much money I should allocate for gas using my car for a long trip. I would use the record of weekly mileage of my car as the predictor and weekly money I spend on gas as the response. The linear model should be like following. ‘Money spend on gas’ = a_0 + a_1 * ‘mileage’, where a_1 is the coefficient & a_0 is the intercept. Q8.2 Using crime data from http://www.statsci.org/data/general/uscrime.txt (file uscrime.txt, description at http://www.statsci.org/data/general/uscrime.html ), use regression (a useful R function is lm or glm) to predict the observed crime rate in a city with the following data: M = 14.0 So = 0 Ed = 10.0 Po1 = 12.0 Po2 = 15.5 LF = 0.640 M.F = 94.0 Pop = 150 NW = 1.1 U1 = 0.120 U2 = 3.6 Wealth = 3200 Solution 8.2 The uscrume.txt file has 15 predictors (a.k.a factor) and 47 data points. lm() is used to generated linear regression models with different combinations of predictors. Below is the summary of the lm models Model | R^2 | Adj R^2 | formula ===== | ====== | ======= | ======= model1 | 0.803 | 0.708 | (all predictors) model2 | 0.766 | 0.731 | M + Ed + Po1 + U2 + Ineq + Prob model3 | 0.7 | 0.672 | M + Ed + Po1 + Ineq model4 | 0.666 | 0.642 | Ed + Po1 + Ineq model5 | 0.738 | 0.706 | M + Ed + Po1 + Ineq + Prob model6 | 0.73 | 0.697 | M + Ed + Po1 + U2 + Ineq Since each model uses different predictor formula, we should use Adj. R^2 value, instead of R^2, for model quality comparison. ‘model1’, which uses all predictors in the modeling generation, has Adj.R^2 value of 0.708. Not all of the predictors are significant. Those significant predictors of ‘model1’ are used to generate the rest of the lm models. ‘model2’’s predictors are M, Ed, Po1, U2, Ineq and Prob. It has the best Adj.R^2 (0.731) among all models. And, it output shows all predictors are significant (p <0.05) Sample output of ‘model1’ Call: lm(formula = Crime ~ ., data = data) Residuals: Min 1Q Median 3Q Max -395.74 -98.09 -6.69 112.99 512.67 Coefficients: Estimate Std. Error t value Pr(>|t|) (Intercept) -5.984e+03 1.628e+03 -3.675 0.000893 *** M 8.783e+01 4.171e+01 2.106 0.043443 * So -3.803e+00 1.488e+02 -0.026 0.979765 Ed 1.883e+02 6.209e+01 3.033 0.004861 ** Po1 1.928e+02 1.061e+02 1.817 0.078892 . Po2 -1.094e+02 1.175e+02 -0.931 0.358830 LF -6.638e+02 1.470e+03 -0.452 0.654654 M.F 1.741e+01 2.035e+01 0.855 0.398995 Pop -7.330e-01 1.290e+00 -0.568 0.573845 NW 4.204e+00 6.481e+00 0.649 0.521279 U1 -5.827e+03 4.210e+03 -1.384 0.176238 U2 1.678e+02 8.234e+01 2.038 0.050161 . Wealth 9.617e-02 1.037e-01 0.928 0.360754 Ineq 7.067e+01 2.272e+01 3.111 0.003983 ** Prob -4.855e+03 2.272e+03 -2.137 0.040627 * Time -3.479e+00 7.165e+00 -0.486 0.630708 --- Signif. codes: 0 ‘***’ 0.001 ‘**’ 0.01 ‘*’ 0.05 ‘.’ 0.1 ‘ ’ 1 Residual standard error: 209.1 on 31 degrees of freedom Multiple R-squared: 0.8031, Adjusted R-squared: 0.7078 F-statistic: 8.429 on 15 and 31 DF, p-value: 3.539e-07 Sample output of ‘model2’ Call: lm(formula = Crime ~ M + Ed + Po1 + U2 + Ineq + Prob, data = data) Residuals: Min 1Q Median 3Q Max -470.68 -78.41 -19.68 133.12 556.23 Coefficients: Estimate Std. Error t value Pr(>|t|) (Intercept) -5040.50 899.84 -5.602 1.72e-06 *** M 105.02 33.30 3.154 0.00305 ** Ed 196.47 44.75 4.390 8.07e-05 *** Po1 115.02 13.75 8.363 2.56e-10 *** U2 89.37 40.91 2.185 0.03483 * Ineq 67.65 13.94 4.855 1.88e-05 *** Prob -3801.84 1528.10 -2.488 0.01711 * --- Signif. codes: 0 ‘***’ 0.001 ‘**’ 0.01 ‘*’ 0.05 ‘.’ 0.1 ‘ ’ 1 Residual standard error: 200.7 on 40 degrees of freedom Multiple R-squared: 0.7659, Adjusted R-squared: 0.7307 F-statistic: 21.81 on 6 and 40 DF, p-value: 3.418e-11 We use the the following test data to get a predicted crime value from lm models. M = 14.0 So = 0 Ed = 10.0 Po1 = 12.0 Po2 = 15.5 LF = 0.640 M.F = 94.0 Pop = 150 NW = 1.1 U1 = 0.120 U2 = 3.6 Wealth = 3200 The summary of predict value per lm models lm model1 - predicted crime value = 155 lm model2 - predicted crime value = 1304 lm model3 - predicted crime value = 1321 lm model4 - predicted crime value = 1304 lm model5 - predicted crime value = 1326 lm model6 - predicted crime value = 1300 The predicted crime value of model1 is 155, which is way too small comparing the statistics of crime data, where is min. crime value is 342. Therefore, model1 may have problem. All other models has predicted crime value around 1300, which seems to be a reasonable figure w.r.t the statistics of crime data #sample of statistics of crime data stats summary of Crime values: Min. 1st Qu. Median Mean 3rd Qu. Max. 342 658 831 905 1058 1993 Later on, we use cv.lm() function to cross validate the models generated by lm() function above. I use m=4 (4-fold) for the cv.lm() for cross-validation. Below is the summary of cross validation results. Model | lm adj. R^2 | cv.lm Adj R^2 | num of predictors ===== | =========== | ============= | ================= model1 | 0.708 | 0.214 | 15 model2 | 0.731 | 0.677 | 6 model3 | 0.672 | 0.639 | 4 model4 | 0.642 | 0.596 | 3 model5 | 0.706 | 0.649 | 5 model6 | 0.697 | 0.654 | 5 We can see the model1’s cv.lm() adj. R^2 value (0.214) is much small the lm() adj. R^2 (0.708). This implies that model1 has lots of over-fitting and does not have good prediction quality. For model2, its cv.lm() adj. R^2 value (0.677) is still smaller than lm() adj. value ( Show Less [Show More]
Last updated: 1 year ago
Preview 1 out of 15 pages
Reviews( 0 )
Document information
Connected school, study & course
About the document
Uploaded On
May 20, 2022
Number of pages
15
Written in

Additional information
This document has been written for:
Uploaded
May 20, 2022
Downloads
0
Views
42

 And LETRS Unit 8 Final Assessment Test.png)


.png)

.png)


.png)
.png)

.png)


.png)
.png)
