Engineering > STUDY GUIDE > Week 1 Introduction To Analytics Modeling - GTX ISYE 6501 (All)
Week 1 Introduction To Analytics Modeling - GTX ISYE 6501
Document Content and Description Below
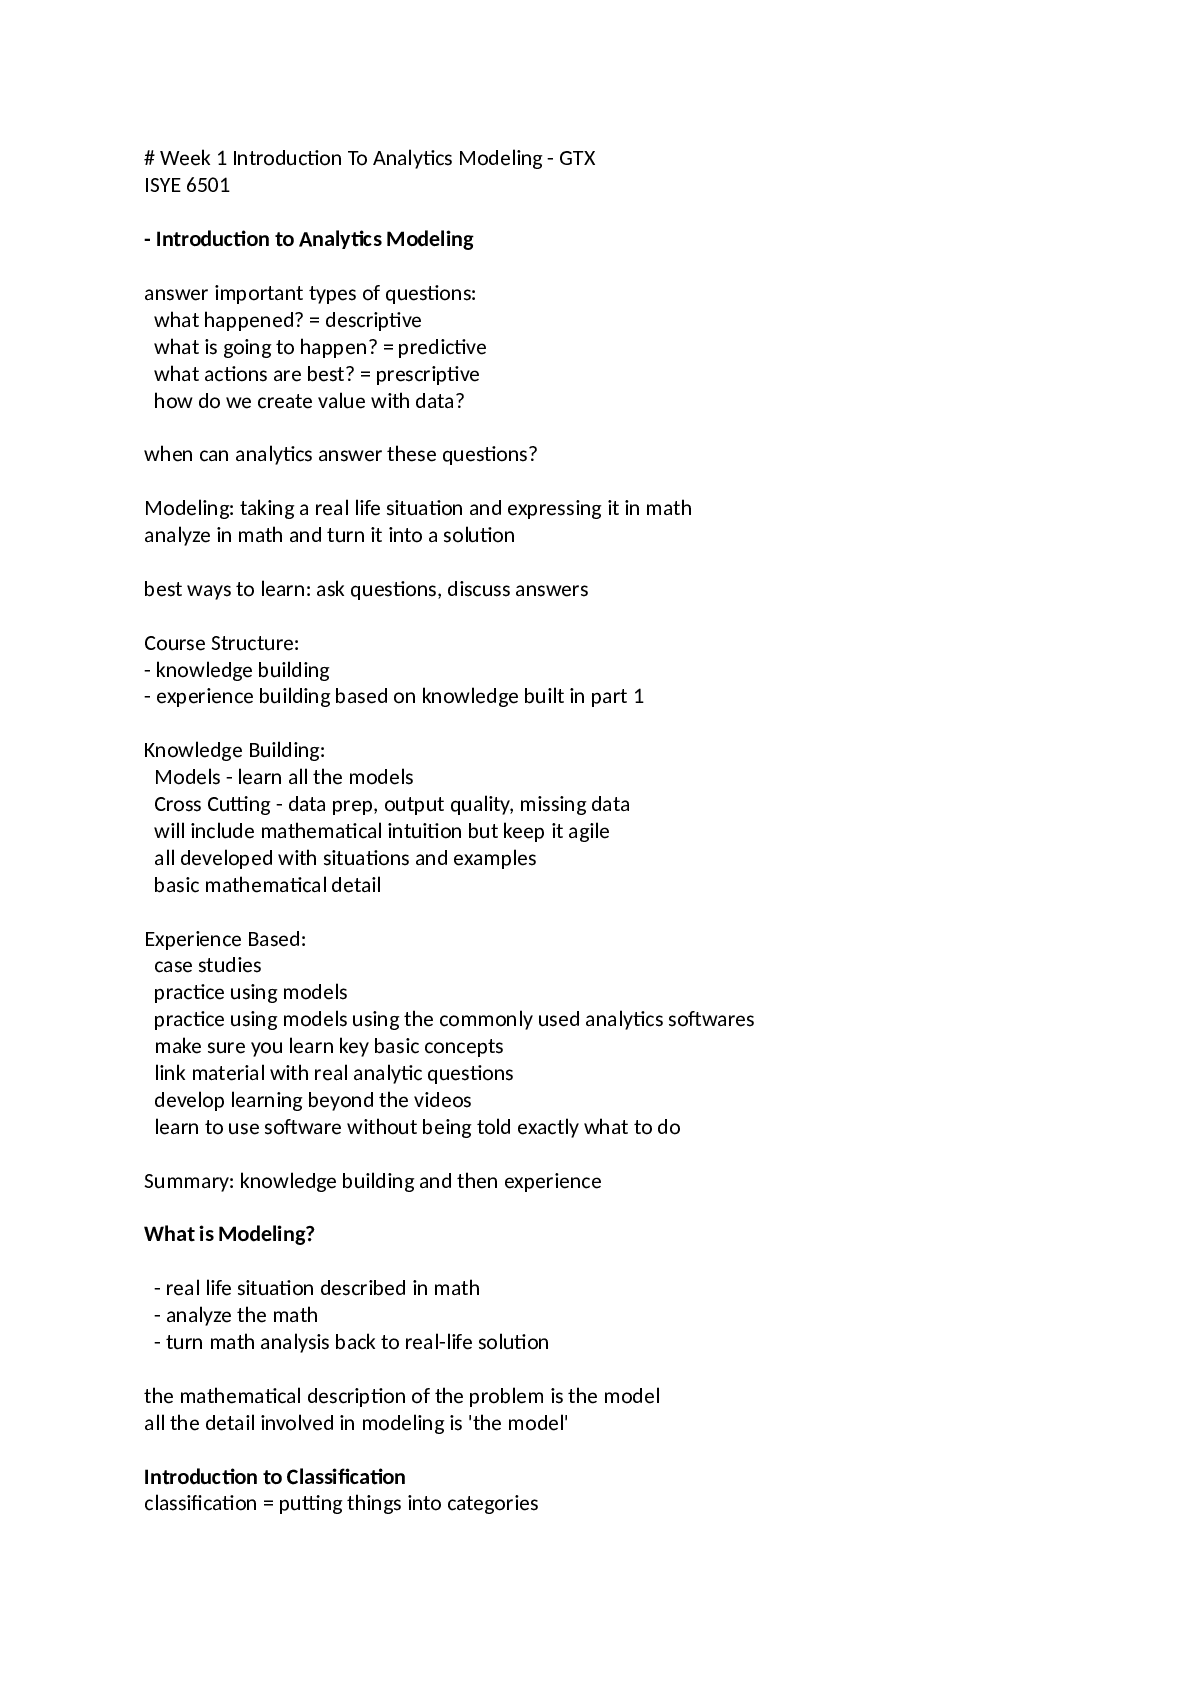
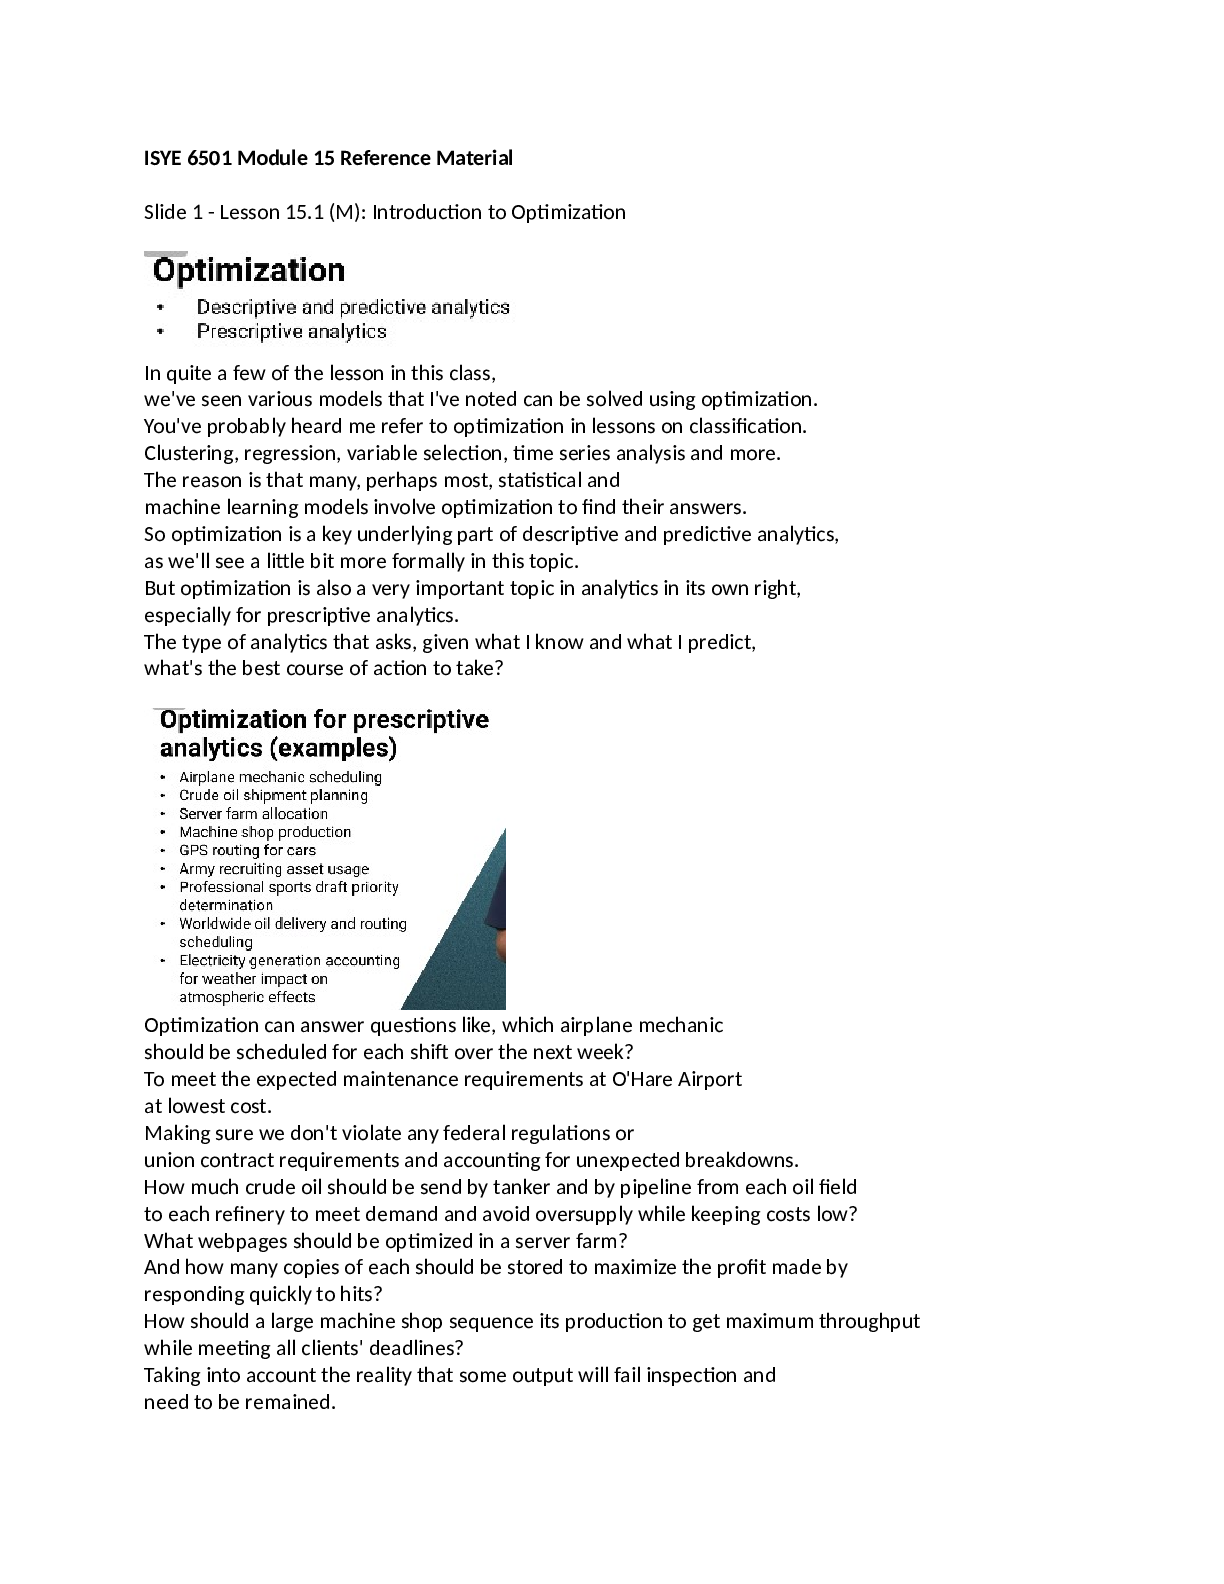
# Week 1 Introduction To Analytics Modeling - GTX ISYE 6501 - Introduction to Analytics Modeling answer important types of questions: what happened? = descriptive what is going to happen? = pre... dictive what actions are best? = prescriptive how do we create value with data? when can analytics answer these questions? Modeling: taking a real life situation and expressing it in math analyze in math and turn it into a solution best ways to learn: ask questions, discuss answers Course Structure: - knowledge building - experience building based on knowledge built in part 1 Knowledge Building: Models - learn all the models Cross Cutting - data prep, output quality, missing data will include mathematical intuition but keep it agile all developed with situations and examples basic mathematical detail Experience Based: case studies practice using models practice using models using the commonly used analytics softwares make sure you learn key basic concepts link material with real analytic questions develop learning beyond the videos learn to use software without being told exactly what to do Summary: knowledge building and then experience What is Modeling? - real life situation described in math - analyze the math - turn math analysis back to real-life solution the mathematical description of the problem is the model all the detail involved in modeling is 'the model' Introduction to Classification classification = putting things into categories put into groups of 'yes' and 'no' many analytic questions need to bin answers into a group based on the past examples we can use classification models to sort these items into these groups we can also have multiple classification groups - not just 'yes' or 'no' we need data to get these answers! we can infer and model from the data to classify a new point into the correct group! credit score and income example: scatterplot if repaid - green if defaulted - red these points could have an entire set of features associated with it we can draw a decision line between the points and sort them based on our decision line there are many lines! how do we know the 'right' line they could all separate the groups evenly! Choosing a Classifier what are the trade-offs in building classification models? we want to put things into categories! should we give someone a loan? we draw a line to sort groups into classification groups... what is the right line to draw? which one should we chose - the line that it further from making mistakes! we might not have all the data - we want find the line that is not close to make misclassifications what if it is impossible to avoid making classification mistakes... i.e. no line to separate between points? we need a 'soft' classifier rather than a 'hard' classifier we need as good as separation as possible - minimize the number of misclassified points we want to trade off between actual mistakes and 'near' mistakes not all mistakes are equal! the best separator - the most costly one type of decision is the further we shift our line away from this group! we can set a high classifier in order to limit cost of classification errors we can use the same idea for 'soft' classification also! we can tell from our decision line which variable is important to the classifier based on the scatterplot between the two variables horizontal line = the classifier only takes the vertical access into account vertical line = the classifier only takes the horizontal axis into account Data Definitions what data comes up in analytics? what terminology do we use in different types of data? important to understand the analytic vernacular Data Tables: rows are data points columns are variables - information about each data point - features, predictors response - the outcome column or the data point we want to predict - this is a column Data Types: Structured - described and stored in a structured way Unstructured - cannot be stored easily - ex. written text Structured Data: quantitative - numbers with meaning categorical - numbers without meaning - categories of data - numbers denote groupings binary - takes on 1 or 0, takes on two values only! unrelated data - no relationships between data points related data - data linked together - time series data - recorded at the same intervals Support Vector Machines basic mathematical model for classification models we want to put things into categories should we give loans to people based on who they are? think of the scatterplot - green is repaid, red is default different lines can be better - be far away from mistakes and further away from more costly mistakes Support Vector Machines n - data points m = number of attributes xij = ith attribute of the jth data point x1j = credit score of person j (i is the attribute associated with the jth row) x2j = income of person j yj = the response for data point j yj = is 1 if data point j is green (repaid) yj = is 0 if data point j is red (default) a line through our classification space (scatterplot) would be defined as: this is a set of coefficients! a1*x1 + a2*x2 + ... + am*xm + a0 = 0 where a1 through am are the number of attributes or features! we can also write this as: Σ(ai*xi + a0) = 0 we can draw to parallel lines through our classification space such that: parallel lines have the same coefficients but different intercepts! we want to draw two parallel lines that separate our red and green points... such that a0 is the line exactly in the middle of the two groups (splitting the two groups) this will be our classifier - the line with intercept evenly splitting the two groups we want to classify we want to find values of a0, a1...am that classify the points correctly and have the maximum MARGIN BETWEEN THE TWO POINTS we need the maximum gap between the parallel lines we are drawing to parallel lines as close as possible to our group of points this means we have a line of a0,a1...am for the green and we have a line of a0, a1...am for the red we will use the midpoint of these two lines to be our classifier the support vector machine aims to find the lines with the largest distance from the classifier (midpoint) to the margin (individual lines separating green points) Distance between solid lines: = 2 / √(Σ(ai)^2) this is 2 divided by the square root of the sum of a coefficients squared this converts to Σ(ai)^2 (sum of coefficients squared for all coefficients) if we can minimize this sum - we can maximize the margin between the two groups of data! this is our objective function - we aim to build lines that minimize this distance and maximize the margin! Hard separation problem: minimize the sum to maximize the margin minimize over all a's the sum of the squares of the a's subject to the sum has to be greater than equal to 1 for all data points we minimize the sum of squares for all a's but only if we can accurately classify the groups! our function is bounded by the original separation lines we want to find two separation lines that accurately classify all points and have the largest distance between the two lines!! what if there is no way to separate between the two groups? we need a 'soft' classifier! this means we account for errors in classification while trade-off the most costly errors we trade off errors vs. maximizing the margin the error for a data point j of our soft classifier wi [Show More]
Last updated: 1 year ago
Preview 1 out of 40 pages
Reviews( 0 )
Document information
Connected school, study & course
About the document
Uploaded On
May 17, 2022
Number of pages
40
Written in

Additional information
This document has been written for:
Uploaded
May 17, 2022
Downloads
0
Views
97


.png)