Statistics > TEST BANK > Test Bank For Probability And Statistics For Engineering And The Sciences 8th Ed by Jay L. Devore. ( (All)
Test Bank For Probability And Statistics For Engineering And The Sciences 8th Ed by Jay L. Devore. (Complete Download). Chapter 1-16.
Document Content and Description Below
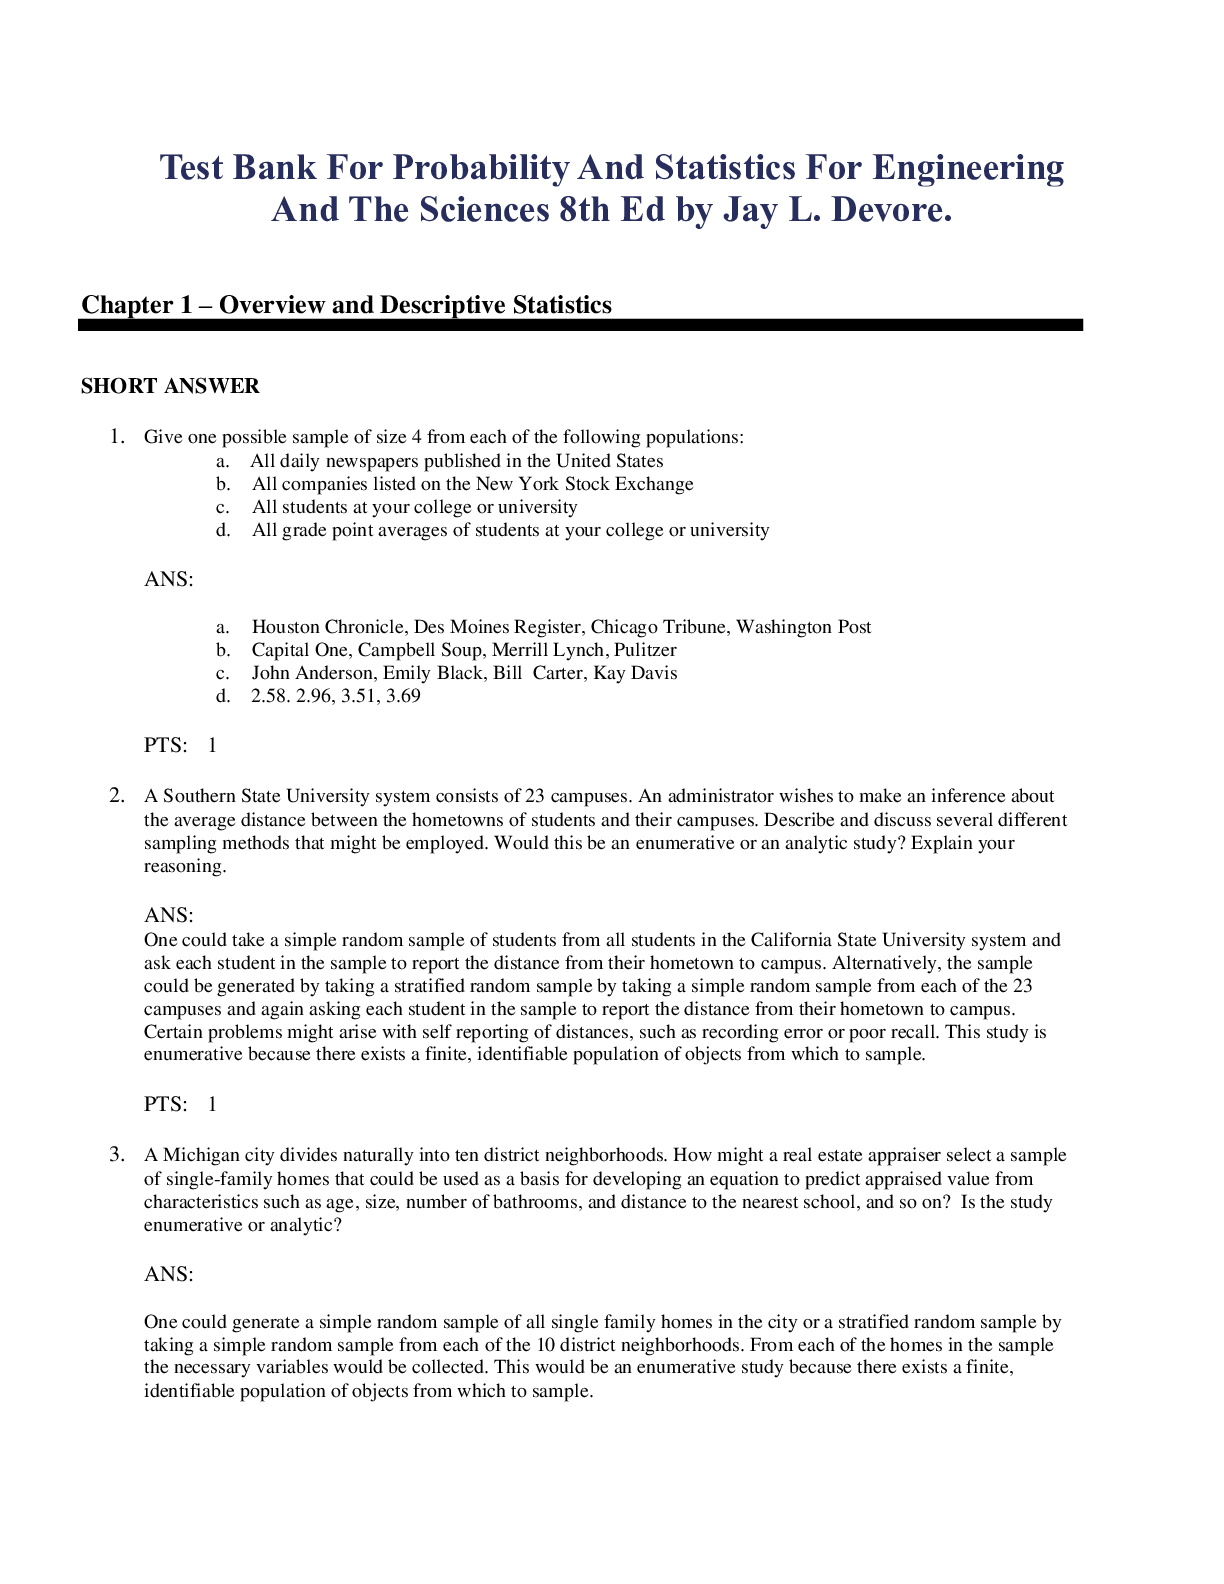
Test Bank For Probability And Statistics For Engineering And The Sciences 8th Ed by Jay L. Devore. Instant Download nSample Chapters nChapter 1 – Overview and Descriptive Statistics Give on... e possible sample of size 4 from each of the following populations: n All daily newspapers published in the United States n All companies listed on the New York Stock Exchange n All students at your college or university n All grade point averages of students at your college or university Houston Chronicle, Des Moines Register, Chicago Tribune, Washington Post n Capital One, Campbell Soup, Merrill Lynch, Pulitzer n John Anderson, Emily Black, Bill Carter, Kay Davis A Southern State University system consists of 23 campuses. An administrator wishes to make an inference about the average distance between the hometowns of students and their campuses. Describe and discuss several different sampling methods that might be S: n nOne could take a simple random sample of students from all students in the California State University system and ask each student in the sample to report the distance from their hometown to campus. Alternatively, the sample could be generated by taking a stratified random sample by taking a simple random sample from each of the 23 campuses and again asking each student in the sample to report n A Michigan city divides naturally into ten district neighborhoods. How might a real estate appraiser select a sample of single-family homes that could be used as a basis for developing an equation to predict appraised value from characteristics such as age, size, number of bathrooms, and distance to the nearest school, and so on? Is the study enumerative or analytic? n nOne could generate a simple random sample of all single family homes in the city or a stratified random sample by taking a simple random sample from each of the 10 district neighborhoods. From each of the homes in the sample the necessary variables would be collected. This would be an enumerative study because there exists a finite, identifiable population of objects from which to sample. An experiment was carried out to study how flow rate through a solenoid valve in an automobile’s pollution-control system depended on three factors: armature lengths, spring load, and bobbin depth. Two different levels (low and high) of each factor were chosen, and a single observation on flow was made for each combination of levels. Number observations equal 222=8 n This could be called an analytic study because the data would be collected on an existing process. There is no sampling frame. nConstruct a stem-and-leaf display using repeated stems and comment on any interesting features of the display. nOne method of denoting the pairs of stems having equal values is to denote the stem by L, for ‘low’ and the second stem by H, for ‘high’. Using this notation, the stem-and-leaf display would appear as follows: nThe stem-and-leaf display on the previous page shows that .45 is a good representative value for the data. In addition, the display is not symmetric and appears to be positively skewed. The spread of the data is .75 – .31 = .44, which is .44/.45 = .978 or about 98% of the typical value of .45. This constitutes a reasonably large amount of variation in the data. The data value .75 is a possible outlier. Temperature transducers of a certain type are shipped in batches of 50. A sample of 60 batches was selected, and the number of transducers in each batch not conforming to design specifications was determined, resulting in the following data: Determine frequencies and relative frequencies for the observed values of x = number of nonconforming transducers in a batch. n What proportion of batches in the sample has at most four nonconforming transducers? What proportion has fewer than four? What proportion has at least four nonconforming units? n The relative frequencies don’t add up exactly to 1because they have been rounded The number of batches with at most 4 nonconforming items is 7+12+13+14+6=52, which is a proportion of 52/60=.867. The proportion of batches with (strictly) fewer than 4 nonconforming items is 46/60=.767. The number of contaminating particles on a silicon wafer prior to a certain rinsing process was determined for each wafer in a sample size 100, resulting in the following frequencies: What proportion of the sampled wafers had at least two particles? At least six particles? n What proportion of the sampled wafers had between four and nine particles, inclusive? Strictly between four and nine particles? n n From this frequency distribution, the proportion of wafers that contained at least two particles is (100-1-2)/100 = .97, or 97%. In a similar fashion, the proportion containing at least 6 particles is (100 – 1-2-3-12-11-15)/100 = 56/100 = .56, or 56%. n The proportion containing between 4 and 9 particles inclusive is (11+15+18+10+12+4)/100 = 70/100 = .70, or 70%. The proportion that contain strictly between 4 and 9 (meaning strictly more than 4 and strictly less than 9) is (15+ 18+10+12)/100= 55/100 = .55, or 55%. n The cumulative frequency and cumulative relative frequency for a particular class interval are the sum of frequencies and relative frequencies, respectively, for that interval and all intervals lying below it. Compute the cumulative frequencies and cumulative relative frequencies for the following data: Consider the following observations on shear strength of a joint bonded in a particular manner: n n n n30.0 4.4 33.1 66.7 81.5 22.2 40.4 16.4 73.7 36.6 109.9 n n n n Determine the value of the sample mean. n Determine the value of the sample median. Why is it so different from the mean? n Calculate a trimmed mean by deleting the smallest and largest observations. What is the corresponding trimming percentage? How does the value of this compare to the mean and median? n n n nANS: n n The sum of the n = 11 data points is 514.90, so = 514.90/11 = 46.81. n The sample size (n = 11) is odd, so there will be a middle value. Sorting from smallest to largest: 4.4 16.4 22.2 30.0 33.1 36.6 40.4 66.7 73.7 81.5 109.9. The sixth value, 36.6 is the middle, or median, value. The mean differs from the median because the largest sample observations are much further from the median than are the smallest values. n Deleting the smallest (x = 4.4) and largest (x = 109.9) values, the sum of the remaining 9 observations is 400.6. The trimmed mean is 400.6/9 = 44.51. The trimming percentage is 100(1/11) = 9.1%. lies between the mean and median. n n n nPTS: 1 n n n n A sample of 26 offshore oil workers took part in a simulated escape exercise, resulting in the accompanying data on time (sec) to complete the escape: n n n n373 370 364 366 364 325 339 393 n n356 359 363 375 424 325 394 402 n n392 369 374 359 356 403 334 397 n n n n Construct a stem-and-leaf display of the data. How does it suggest that the sample mean and median will compare? n Calculate the values of the sample mean and median. n By how much could the largest time, currently 424, be increased without affecting the value of the sample median? By how much could this value be decreased without affecting the value of the sample mean? n What are the values of and when the observations are re-expressed in minutes? n n n nANS: n n A. stem-and-leaf display of this data appears below: n n n n32 55 stem: ones n n33 49 leaf: tenths n n34 n n35 6699 n n36 34469 n n37 03345 n n38 9 n n39 2347 n n40 23 n n41 n n42 4 n nThe display is reasonably symmetric, so the mean and median will be close. n n n n The sample mean is = 9638/26 = 370.7. The sample median is = (369+370)/2=369.50. n The largest value (currently 424) could be increased by any amount. Doing so will not change the fact that the middle two observations are 369 and 170, and hence, the median will not change. However, the value x = 424 can not be changed to a number less than 370 ( a change of 424-370 = 54) since that will lower the values(s) of the two middle observations. n Expressed in minutes, the mean is (370.7 sec)/(60 sec) = 6.18 min; the median 6.16 min. n n n nPTS: 1 n n n n A sample of n = 10 automobiles was selected, and each was subjected to a 5-mph crash test. Denoting a car with no visible damage by S (for success) and a car with such damage by F, results were as follows: S S S F F S S F S S n n n n What is the value of the sample proportion of successes x/n? n Replace each S with a 1 and each F with a 0. Then calculate for this numerically coded sample. How does compare to x/n? n Suppose it is decided to include 15 more cars in the experiment. How many of these would have to be S’s to x/n = .80 for the entire sample of 25 cars? n n n nANS: n n 7/10 = .70 n = .70 = proportion of successes, and x/n have the same value n = .80 so s = (0.80)(25) = 20 total of 20 successes n n20 – 7 = 13 of the new cars would have to be successes. n n n nPTS: 1 n n n n Answer the following two questions: n n n n If a constant c is added to each in a sample, yielding = + c, how do the sample mean and median of the’s relate to the mean and median of the’s? Verify your conjectures. n If each is multiplied by a constant c, yielding = , answer the question of part (a). Again, verify your conjectures. n n n nANS: n n n n= the median of = median of n n n n= n n n nPTS: 1 n n n n Calculate and interpret the values of the sample mean and sample standard deviation for the following observations on fracture strength. n n n n128 131 142 168 87 93 105 114 96 98 n n n nANS: n n n nThe sample mean, n n n nThe sample standard deviation, n n n nOn average, we would expect a fracture strength of 116.2. In general, the size of a typical deviation from the sample mean (116.2) is about 25.75. Some observations may deviate from 116.2 by more than this and some by less. n The first four deviations from the mean in a sample of n = 5 reaction times were .6, .9, 1.0, and 1.5. What is the fifth deviation from the mean? Give a sample for which these are the five deviations from the mean. n nLet d denote the fifth deviation. Then .6+.9+1.0+1.5+d = 0 or 4.0 + d =0, so d =-4.0. One sample for which these are the deviations is = 4.6, = 4.9, = 5.0, = 5.5, = 0. (Obtained by adding 4.0 to each deviation; adding any other number will produce a different sample with the desired property). n A sample of 20 glass bottles of a particular type was selected, and the internal pressure strength of each bottle was determined. Consider the following partial sample information: nThree smallest observations 125.8 188.1 193.7 n nThree largest observations 221.3 230.5 250.2 nAre there any outliers in the sample? Any extreme outliers? n1.5(IQR) = 1.5(216.8-196.0) = 31.2 and 3(IQR) = 3(216.8-196.0) = 62.4. n nMild outliers: observations below 196-31.2 = 164.6 or above 216.8+31.2=248. n nExtreme outliers: observations below 196-62.4 = 133.6 or above 216.8+62.4 = 279.2. n nOf the observations given, 125.8 is an extreme outlier and 250.2 is a mild outlier. nChapter 5 – Joint Probability Distributions and Random Samples n Each front tire on a particular type of vehicle is supposed to be filled to a pressure of 26 psi. Suppose the actual air pressure in each tire is a random variable—X for the right tire and Y for the left tire, with joint pdf n What is the value of K? n What is the probability that both tires are underfilled? n What is the probability that the difference in air pressure between the two tires is at most 2 psi? n Determine the (marginal) distribution of air pressure in the right tire alone. n Are X and Y independent random variables? is obtained by substituting y for x in (d); clearlyare n nnot independent. Let X denote the number of brand X VCRs sold during a particular week by a certain store. The pmf of X is nSeventy percent of all customers who purchase brand X VCRs also buy an extended warranty. Let Y denote the number of purchasers during this week who buy an extended warranty. n What is P(X = 4, Y = 2)? [Hint: This probability equals P(Y = 2/X = 4) P(X = 4); now think of the four purchases as four trials of a binomial experiment, with success on a trial corresponding to buying an extended warranty.] n Calculate P(X =Y). n Determine the joint pmf of X and Y and then the marginal pmf of Y. Two components of a minicomputer have the following joint pdf for their useful lifetimes X and Y: What is the probability that the lifetime X of the first component exceeds 3? n What are the marginal pdf”s of X and Y? Are the two lifetimes independent? Explain. n What is the probability that the lifetime of at least one component exceeds 3? n nANS: The marginal pdf of X is n nIt is now clear that f(x,y) is not the product of the marginal pdf”s, so the two random variables are not independent. The joint pdf of pressures for right (X) and left (Y) front tires is given by . Determine the conditional pdf of Y given that X = x and the conditional pdf of X given that Y = y if you are given n If the pressure in the right tire is found to be 22 psi, what is the probability that the left tire has a pressure of at least 25 psi? Compare this to n If the pressure in the right tire is found to be 22 psi, what is the expected pressure in the left tire, and what is the standard deviation of pressure in this tire? An instructor has given a short test consisting of two parts. For a randomly selected student, let X = the number of points earned on the first part and Y = the number of points earned on the second part. Suppose that the joint pmf of X and Y is given in the accompanying table. If the score recorded in the grade book is the total number of points earned on the two parts, what is the expected recorded score E(X + Y)? n If the maximum of the two scores is recorded, what is the expected recorded score? Abby and Bianca have agreed to meet for lunch between noon and 1:00 P.M. Denote Abby’s arrival time by X, Bianca’s by Y, and suppose X and Y are independent with pdf’s. nWhat is the expected amount of time that the one who arrives first must wait for the other person? [Hint: h(X, Y ) = |X – Y|.] n Show that if X and Y are independent random variables, then n Show that if Under what conditions will A particular brand of dishwasher soap is sold in three sizes: 25oz, 40oz, and 65 oz. Twenty percent of all purchasers select a 25 oz box, fifty percent select a 40 oz box, and the remaining thirty percent choose a 65 oz box. Let denote the package sizes selected by two independently selected purchasers. n Determine the sampling distribution of , calculate , and compare to Determine the sampling distribution of the sample variance It is known that 80% of all brand A zip drives work in a satisfactory manner throughout the warranty period (are “success”). Suppose that n = 10 drives are randomly selected. Let X = the number of successes in the sample. The statistic X/n is the sample proportion (fraction) of successes. Obtain the sampling distribution of this statistic. [Hint: One possible value of X/n is .3, corresponding to X = 3. What is the probability of this value (what kind of random variable is X)?] n [Show More]
Last updated: 1 year ago
Preview 1 out of 2 pages
Reviews( 0 )
Document information
Connected school, study & course
About the document
Uploaded On
Jul 31, 2021
Number of pages
2
Written in

Additional information
This document has been written for:
Uploaded
Jul 31, 2021
Downloads
0
Views
89