*NURSING > EXAM > NR 503 Week 8 Final Exam Student Consult Questions with Rationale Chapters 2-4, 5-6 (All)
NR 503 Week 8 Final Exam Student Consult Questions with Rationale Chapters 2-4, 5-6
Document Content and Description Below
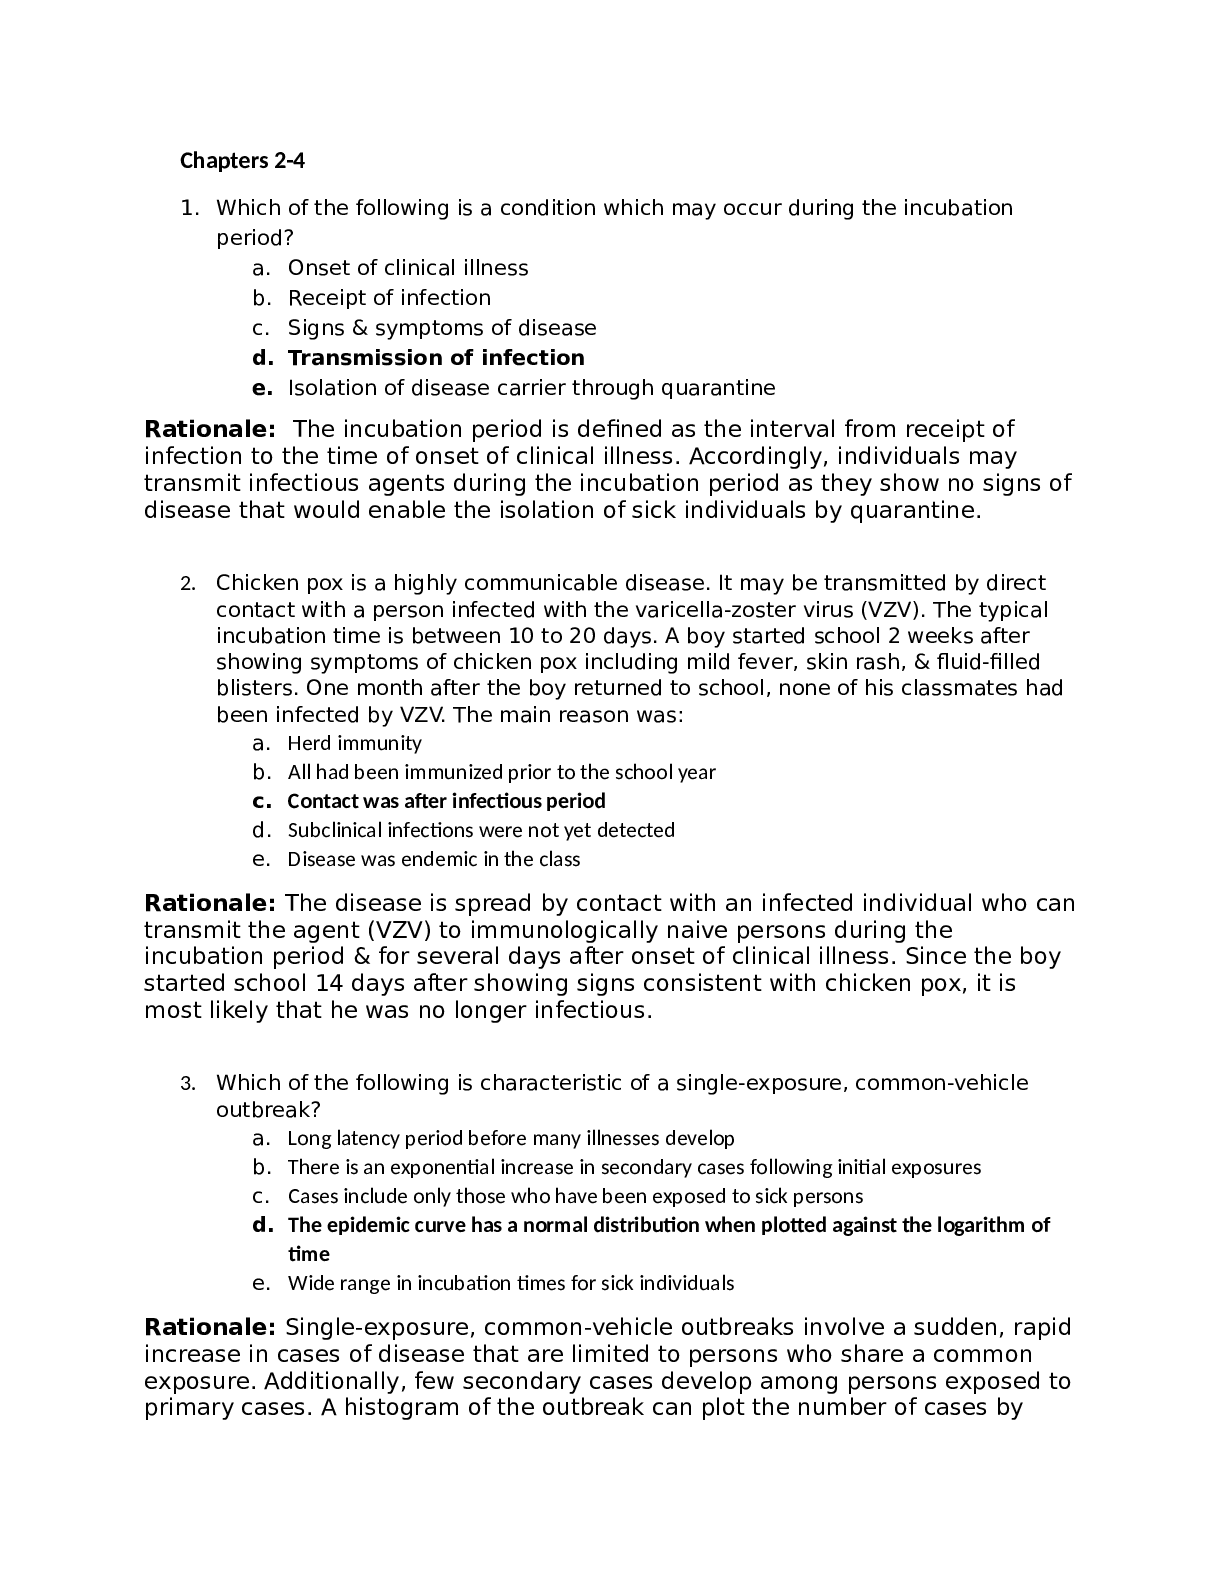
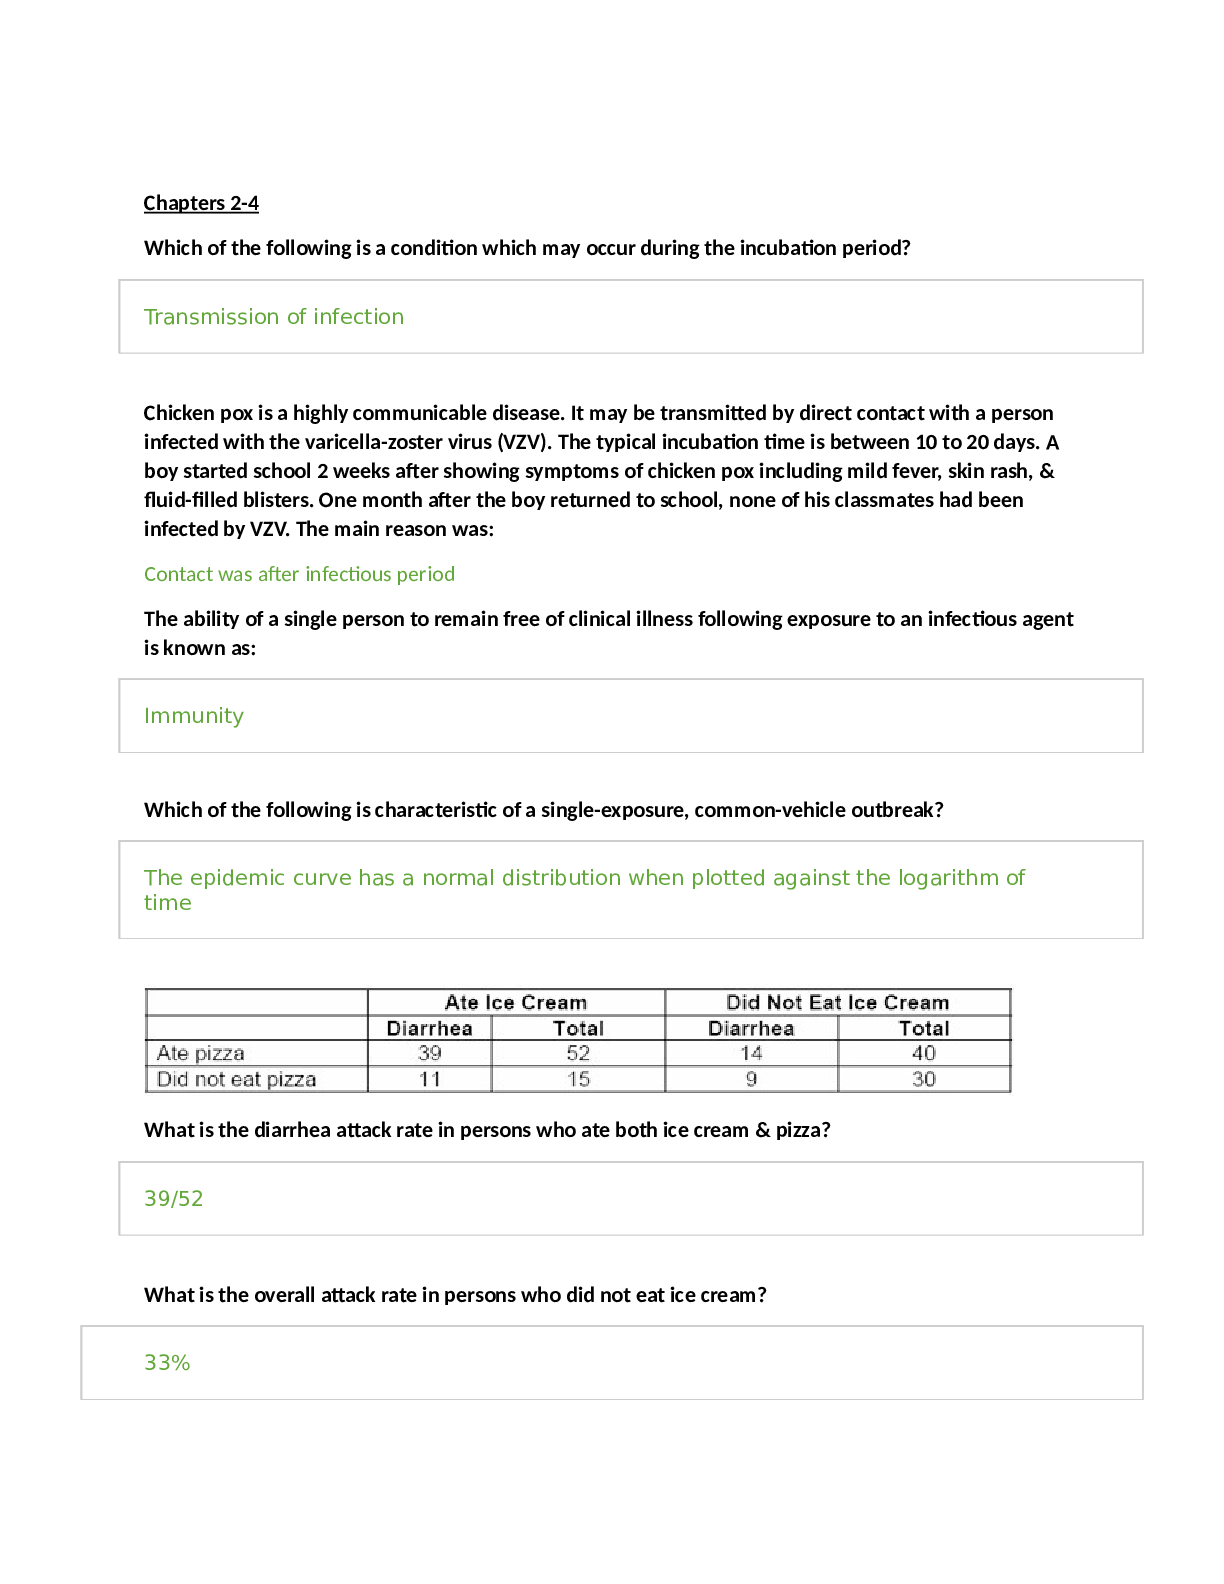
Question 1 Which of the following is a condition which may occur during the incubation period? • Onset of clinical illness • Receipt of infection • Signs and symptoms of disease • Transmission... of infection • Isolation of disease carrier through quarantine The incubation period is defined as the interval from receipt of infection to the time of onset of clinical illness. Accordingly, individuals may transmit infectious agents during the incubation period as they show no signs of disease that would enable the isolation of sick individuals by quarantine. Question 2 Chicken pox is a highly communicable disease. It may be transmitted by direct contact with a person infected with the varicella-zoster virus (VZV). The typical incubation time is between 10 to 20 days. A boy started school 2 weeks after showing symptoms of chicken pox including mild fever, skin rash, and fluid-filled blisters. One month after the boy returned to school, none of his classmates had been infected by VZV. The main reason was: • Herd immunity • All had been immunized prior to the school year • Contact was after infectious period • Subclinical infections were not yet detected • Disease was endemic in the class The disease is spread by contact with an infected individual who can transmit the agent (VZV) to immunologically naive persons during the incubation period and for several days after onset of clinical illness. Since the boy started school 14 days after showing signs consistent with chicken pox, it is most likely that he was no longer infectious. Question 3 The ability of a single person to remain free of clinical illness following exposure to an infectious agent is known as: • Hygiene • Vaccination • Herd immunity • Immunity • Latency Immunity is the capacity of a single individual to avoid disease susceptibility when exposed to an infectious agent. Herd immunity is a population characteristic. For certain diseases, individual immunity can be acquired by vaccination, but this is not true for all infectious Question 4 Which of the following is characteristic of a single-exposure, common-vehicle outbreak? • Long latency period before many illnesses develop • There is an exponential increase in secondary cases following initial exposures • Cases include only those who have been exposed to sick persons • The epidemic curve has a normal distribution when plotted against the logarithm of time • Wide range in incubation times for sick individuals Single-exposure, common-vehicle outbreaks involve a sudden, rapid increase in cases of disease that are limited to persons who share a common exposure. Additionally, few secondary cases develop among persons exposed to primary cases. A histogram of the outbreak can plot the number of cases by time of disease onset. In single-exposure, common-vehicle outbreaks, a log transformation of the time of disease onset will often take on the characteristic shape of a normal distribution (i.e., a bell curve) with the median incubation time found at the peak of the curve. What is the diarrhea attack rate in persons who ate both ice cream and pizza? • 39/52 • 21/70 • 39/67 • 51/67 • none of the above The attack rate in this example is defined as the number of persons who develop diarrhea divided by the total number of people at risk. In this example, the at-risk group is those who have eaten both ice cream and pizza. Of these 52 persons, 39 developed diarrhea. Question 6 What is the overall attack rate in persons who did not eat ice cream? • 30% • 33% • 35% • 44% • 58% The attack rate is the number of persons with diarrhea (14 9) divided by the total number of persons who did not eat ice cream (40 30). Question 7 Which of the food items (or combination of items) is most likely to be the infective item(s)? • Pizza only • Ice cream only • Neither pizza nor ice cream • Both pizza and ice cream • Cannot be assumed from the data shown Among persons eating ice cream, over 70% developed diarrhea regardless of their pizza consumption (39/52 and 11/15). Among both groups of persons who did not eat ice cream, each attack rate was equal to or less than 35% (14/40 and 9/30). Question 8 Which of the following reasons can explain why a person who did not consume the infective food item got sick? • They were directly exposed to persons who did eat the infective food item • Diarrhea is a general symptom consistent with a number of illnesses • There may have been an inaccurate recall of which foods were eaten • All of the above • None of the above Without knowledge as to the specific agent in this instance, it is also likely that it can be spread by direct contact with infected persons. Since diarrhea is a general disease symptom, it is possible that several infectious agents may be present at this meal or others eaten during the same time period. Further, information regarding food consumption may have been collected long after the disease episode. This may have led persons to incorrectly remember the foods that they consumed. Question 9 An outbreak of gastroenteritis occurred at a boarding school with a student enrollment of 846. Fifty-seven students reported symptoms including vomiting, diarrhea, nausea, and low-grade fever between 10 p.m. on September 24 and 8 p.m. on September 25. The ill students lived in dormitories that housed 723 of the students. The table below provides information on the number of students per type of residence and the number reporting illnesses consistent with the described symptoms and onset time. Calculate the attack rate among all students at the boarding school. The answer is found by dividing the total number of cases (57) by the total number of students (846). This equals 6.7%. Question 10 An outbreak of gastroenteritis occurred at a boarding school with a student enrollment of 846. Fifty-seven students reported symptoms including vomiting, diarrhea, nausea, and low-grade fever between 10 p.m. on September 24 and 8 p.m. on September 25. The ill students lived in dormitories that housed 723 of the students. The table below provides information on the number of students per type of residence and the number reporting illnesses consistent with the described symptoms and onset time. Calculate the attack rates for boys and girls separately. For boys, the attack rate includes all cases (40 3) divided by the total number of students who are boys (380 46). The attack rate is 10.1%. For girls, the attack rate includes all cases (12 2) divided by the total number of students who are girls (343 77). The attack rate is 3.3%. Question 11 An outbreak of gastroenteritis occurred at a boarding school with a student enrollment of 846. Fifty-seven students reported symptoms including vomiting, diarrhea, nausea, and low-grade fever between 10 p.m. on September 24 and 8 p.m. on September 25. The ill students lived in dormitories that housed 723 of the students. The table below provides information on the number of students per type of residence and the number reporting illnesses consistent with the described symptoms and onset time. What is the proportion of total cases occurring in boys? The proportion of cases occurring in boys is equal to the number of cases in boys divided by the total number of cases (43/57). This equals 75.4%. Question 12 An outbreak of gastroenteritis occurred at a boarding school with a student enrollment of 846. Fifty-seven students reported symptoms including vomiting, diarrhea, nausea, and low-grade fever between 10 p.m. on September 24 and 8 p.m. on September 25. The ill students lived in dormitories that housed 723 of the students. The table below provides information on the number of students per type of residence and the number reporting illnesses consistent with the described symptoms and onset time. What is the proportion of total cases occurring in students who live in dormitories? The proportion of cases occurring in dormitory residents is equal to the number of cases in residents divided by the total number of cases (52/57). This equals 91.2%. Question 13 An outbreak of gastroenteritis occurred at a boarding school with a student enrollment of 846. Fifty-seven students reported symptoms including vomiting, diarrhea, nausea, and low-grade fever between 10 p.m. on September 24 and 8 p.m. on September 25. The ill students lived in dormitories that housed 723 of the students. The table below provides information on the number of students per type of residence and the number reporting illnesses consistent with the described symptoms and onset time. Which proportion is more informative for the purpose of the outbreak investigation? Both proportions are useful. Dormitory residents account for over 90% of the cases indicating an outbreak of an infectious agent that was transmitted at the school. Furthermore, over 75% of the cases were boys indicating that the responsible agent was more likely to have been transmitted in the boys’ dormitory. Question 14 A group of researchers are interested in conducting a clinical trial to determine whether a new cholesterol-lowering agent was useful in preventing coronary heart disease (CHD). They identified 12,327 potential participants for the trial. At the initial clinical exam, 309 were discovered to have CHD. The remaining subjects entered the trial and were divided equally into the treatment and placebo groups. Of those in the treatment group, 505 developed CHD after 5 years of follow-up while 477 developed CHD during the same period in the placebo group. What was the prevalence of CHD at the initial exam? The prevalence of CHD at the initial exam was 309 cases of CHD divided by 12,327 participants. This equals a prevalence of 25.1 cases of CHD per 1,000 persons. Question 15 A group of researchers are interested in conducting a clinical trial to determine whether a new cholesterol-lowering agent was useful in preventing coronary heart disease (CHD). They identified 12,327 potential participants for the trial. At the initial clinical exam, 309 were discovered to have CHD. The remaining subjects entered the trial and were divided equally into the treatment and placebo groups. Of those in the treatment group, 505 developed CHD after 5 years of follow-up while 477 developed CHD during the same period in the placebo group. What was the incidence of CHD during the 5-year study? The incidence rate reflects the number of new cases developing in the population at risk. Since prevalent CHD cases were excluded from the study, the population at risk was 12,018 (12,327 persons less 309 cases of CHD). During the 5-year study period, 982 incident cases of CHD developed. This equals an incidence rate of 81.7 cases of CHD per 1,000 persons. Question 16 Which of the following are examples of a population prevalence rate? • The number of ear infections suffered by 3-year-old children in March, 2006 • The number of persons with hypertension per 100,000 population • The number of cases of skin cancer diagnosed in a dermatology clinic • b and c • All of the above Prevalence is the number of affected persons in a specified population size at a given time. Only answer (b) fits this definition. Example (a) is more consistent with an incident rate while answer (c) is a selected group of persons who may not be representative of a general population. Question 17 What would be the effect on age-specific incidence rates of uterine cancer if women with hysterectomies were excluded from the denominator of incidence calculations assuming that most women who have had hysterectomies are older than 50 years of age. • The rates in all age groups would remain the same. • Only rates in women older than 50 years of age would tend to decrease. • Rates in women younger than 50 years would increase compared to women older than 50 years of age. • Rates would increase in women older than 50 years of age but may decrease in younger women as they get older. • It cannot be determined whether the rates would increase or decrease. Women who have had hysterectomies (i.e., removal of the uterus) are no longer at risk for uterine cancer. For women older than 50 years of age, this would increase the age-specific incidence rate as there would be the same number of uterine cancers occurring among fewer women at risk. Further, rates may decrease among younger women who have had hysterectomies as they are no longer at risk for uterine cancer and thus may decrease the number of potential cases occurring in their age group over time. Question 18 A survey was conducted among 1,000 randomly sampled adult males in the United States in 2005. The results from this survey are shown below. The researchers stated that there was a doubling of risk of hypertension in each age group younger than 60 years of age. You conclude that the researchers’ interpretation: • Is correct • Is incorrect because prevalence rates are estimated • Is incorrect because it was based on proportions of the population sample • Is incorrect because incidence rates do not describe risk • Is incorrect because the calculations do not include adult females The survey reports the disease status of a population at a specific point in time. In this case, a random sample of adult males in 2005 provides a reliable estimate of the prevalence of hypertension. Since there is no information on duration of hypertension in these men, incidence cannot be calculated. Therefore, the researchers are not able to make a statement concerning risk of hypertension in the population. Question 19 The incidence and prevalence rates of a chronic childhood illness for a specific community are given below. Based on the data, which of the following interpretations best describes disease X? • The duration of disease is becoming shorter. • The duration of disease is becoming longer. • The case-fatality rate of this disease is decreasing. • Efforts to prevent new cases of this disease are becoming more successful. • The risk of the disease has decreased over the past 20 years. Prevalence and incidence are related by the duration of disease. If incidence is increasing over time, then duration of illness has to decrease in order to keep the prevalence rate constant. This may occur through better treatments to cure disease or through higher case-fatality rates as a disease becomes more lethal. Since incidence is increasing over time, it is evident that risk is also increasing and that prevention efforts are not successful. Question 20 A prevalence survey conducted from January 1 through December 31, 2003 identified 580 new cases of tuberculosis in a city of 2 million persons. The incidence rate of tuberculosis in this population has historically been 1 per 4,000 persons each year. What is the incident rate of tuberculosis per 100,000 persons in 2003? The answer is 29 new cases of tuberculosis per 100,000 persons. This is found by dividing the new cases of tuberculosis by the total population at risk (580/2,000,000) and multiplying this rate by 100,000 to standardize the rate. Question 21 A prevalence survey conducted from January 1 through December 31, 2003 identified 580 new cases of tuberculosis in a city of 2 million persons. The incidence rate of tuberculosis in this population has historically been 1 per 4,000 persons each year. Has the risk of tuberculosis increased or decreased during 2003? The risk of tuberculosis has increased over the historic incident rate. This comparison can be made by standardizing the historic rate to a rate per 100,000 persons. To do this, multiply the numerator and denominator by 25. Question 22 Which of the following is an advantage of active surveillance? • Requires less project staff • Is relatively inexpensive to employ • More accurate due to reduced reporting burden for health care providers • Relies on different disease definitions to account for all cases • Reporting systems can be developed quickly Active surveillance entails a concerted effort to collect information about disease occurrence. It typically involves dedicated staff members who have been specifically directed to contact physicians and hospitals in order to collect reports of disease cases in a specified population. This activity requires a large amount of staff and resources in order to accomplish its goals. Question 23 The population of a city on February 15, 2005, was 36,600. The city has a passive surveillance system that collects hospital and private physician reports of influenza cases every month. During the period between January 1 and April 1, 2005, 2,200 new cases of influenza occurred in the city. Of these cases, 775 persons were ill with influenza according to surveillance reports on April 1, 2005. The monthly incidence rate of active cases of influenza for the 3-month period was: • 4 per 1,000 population • 17 per 1,000 population • 20 per 1,000 population • 39 per 1,000 population • 130 per 1,000 population The monthly incidence rate is calculated based on the number of new cases of a disease developing during the 3-month time period. In this example, 2,200 cases of influenza developed among an average population of 36,600 persons at risk during the surveillance period. The incidence rate equals 2,200 divided by 36,600. In order to calculate the average monthly rate, the rate should then be divided by 3. Finally, the monthly rate can be multiplied by 1,000 in order to express it per the responses listed. Question 24 The population of a city on February 15, 2005, was 36,600. The city has a passive surveillance system that collects hospital and private physician reports of influenza cases every month. During the period between January 1 and April 1, 2005, 2,200 new cases of influenza occurred in the city. Of these cases, 775 persons were ill with influenza according to surveillance reports on April 1, 2005. The prevalence rate of active influenza as of April 1, 2005, was: • 10 per 1,000 population • 14 per 1,000 population • 17.5 per 1,000 population • 20 per 1,000 population • Cannot be calculated as there is no information on duration The prevalence rate as of April 1, 2005, is equal to the number of active influenza cases reported divided by the number of persons at risk in the population at that time. The best estimate of the population size is that from the February 15 count, less who are no longer at risk as they have already recovered from influenza and have developed immunity. Therefore, prevalence equals 705 cases divided by 36,600 less 1,495 recovered cases. This number can be multiplied by 1,000 in order to estimate a prevalence rate of 20 cases per 1,000 persons. Question 25 The population of a city on February 15, 2005, was 36,600. The city has a passive surveillance system that collects hospital and private physician reports of influenza cases every month. During the period between January 1 and April 1, 2005, 2,200 new cases of influenza occurred in the city. Of these cases, 775 persons were ill with influenza according to surveillance reports on April 1, 2005. What can be inferred about influenza cases occurring in the city? • Active surveillance would enable better prevention of influenza • The incidence rate would decrease if active surveillance were employed • The average duration of influenza is approximately 1 month • The actual number of influenza cases occurring in the population is less since hospitals and private physicians may be reporting the same patients. • The prevalence rate should be higher since it should be calculated based on all cases of influenza occurring from January 1 through March 30, 2005. Since the average monthly incidence rate is 20 per 1,000 and the prevalence rate is also 20 per 1,000, then the duration of disease must equal 1 month. Question 26 A study found that adults older than age 50 had a higher prevalence of pneumonia than those who were younger than age 50. Which of the following is consistent with this finding? • Younger adults have a higher incidence of pneumonia • Older adults have a higher case-fatality rate from pneumonia • Younger adults with pneumonia are more likely to report being ill than older persons • Incidence rates do not vary by age, but older adults have pneumonia for a longer duration compared to younger adults • None of the above For prevalence to be higher among older adults, either incidence or duration of pneumonia must be increased in this age group. Question 27 Which of the following statements are true? More than one answer may be correct. • Prevalence rates are always larger than incidence rates • In a steady state, the prevalence of disease is equal to the attack rate • Diagnostic criteria rarely impact estimates of disease prevalence and incidence • Prevalence rates are useful for public health planning • Incidence rates can be used to estimate prevalence when the mean duration of the disease is known Question 28 A disease has an incidence of 10 per 1,000 persons per year, and 80% of those affected will die within 1 year. Prior to the year 2000, only 50% of cases of the disease were detected by physician diagnosis prior to death. In the year 2000, a lab test was developed that identified 90% of cases an average of 6 months prior to symptom onset; however, the prognosis did not improve after diagnosis. Comparing the epidemiology of the disease prior to 2000 with the epidemiology of the disease after the development of the lab test, which statement is true concerning the disease in 2000? • Incidence is higher and prevalence is higher than in 1999 • Incidence is higher in 2000 but prevalence remains the same • Incidence is the same in 2000 but prevalence is higher than in 1999 • Both incidence and prevalence remain the same as in 1999 • Incidence is the same in 2000 but prevalence is lower than in 1999 With increased ability to detect cases of the disease at earlier times, both the number of incidence and prevalent cases will increase through better detection. Question 29 A disease has an incidence of 10 per 1,000 persons per year, and 80% of those affected will die within 1 year. Prior to the year 2000, only 50% of cases of the disease were detected by physician diagnosis prior to death. In the year 2000, a lab test was developed that identified 90% of cases an average of 6 months prior to symptom onset; however, the prognosis did not improve after diagnosis. Which statement is true concerning the duration of the disease after the development of the lab test? • Mean duration of a case of the disease is shorter in 2000 • Mean duration of a case of the disease is the same in 2000 • Mean duration of a case of the disease is longer in 2000 • No inference about mean duration can be made since the lab test has only been available for 1 year Though the prognosis is similar after the development of the lab test, the duration of new cases identified by the test can be increased by up to 6 months due to earlier detection. Question 30 A disease has an incidence of 10 per 1,000 persons per year, and 80% of those affected will die within 1 year. Prior to the year 2000, only 50% of cases of the disease were detected by physician diagnosis prior to death. In the year 2000, a lab test was developed that identified 90% of cases an average of 6 months prior to symptom onset; however, the prognosis did not improve after diagnosis. Which statement is true concerning the disease-specific mortality rate after the development of the lab test? • The mortality rate for the disease is decreased in 2000 • The mortality rate for the disease is the same in 2000 • The mortality rate for the disease is increased in 2000 • No inference about the mortality rate can be made since the lab test has only been available for 1 year With the implementation of the lab test, the increase in early detection of cases will increase incidence, duration, and prevalence; however, since the prognosis is still the same, at least 80% of patients will die during the year 2000. This should result in a similar mortality rate as the previous year given no change in transmission, prevention, or medical care of the disease. Question 31 In a coastal area of a country in which a tsunami struck, there were 100,000 deaths in a population of 2.4 million for the year ending December 31, 2005. What was the all-cause crude mortality rate per 1,000 persons during 2005? The answer is 41.7 per 1,000 persons. The rate is calculated by dividing 100,000 deaths by the population of 2,400,000 persons. To express as a rate per 1,000 persons, the rate is multiplied by 1,000. Question 32 In an industrialized nation, there were 192 deaths due to lung diseases in miners ages 20 to 64 years. The expected number of deaths in this occupational group, based on age-specific death rates for lung diseases in all males ages 20 to 64 years, was 238 during 1990. What was the standardized mortality ratio (SMR) for lung diseases in miners? The answer is 81. The ratio is calculated by dividing 192 observed deaths by the 238 expected deaths for this age group. To express it as an SMR, the ratio is often multiplied by 100. Question 33 In 2001, a state enacted a law that required the use of safety seats for all children under 7 years of age and mandatory seatbelt use for all persons. The table below lists the number of deaths due to motor vehicle accidents (MVAs) and the total population by age in 2000 (before the law) and in 2005 (4 years after the law was enacted). What is the age-specific mortality rate due to MVAs for children ages 0 to 18 years in 2000? • 1.8 per 1,000 • 2.9 per 1,000 • 4.0 per 1,000 • 6.1 per 1,000 • Cannot be calculated from information given The rate is found by combining the MVA deaths and total population size for the two age groups under 7 years and 7 to 18 years during the year 2000. This equals (44 105) divided by (3,500 21,000). Multiplying this rate by 1,000 persons gives the answer indicated. Question 34 In 2001, a state enacted a law that required the use of safety seats for all children under 7 years of age and mandatory seatbelt use for all persons. The table below lists the number of deaths due to motor vehicle accidents (MVAs) and the total population by age in 2000 (before the law) and in 2005 (4 years after the law was enacted). Using the pooled total of the 2000 and 2005 populations as the standard rate, calculate the age-adjusted mortality rate due to MVAs in 2005. The correct answer is 2.3 MVA deaths per 1,000 persons. The key to calculating the age-adjusted rate is to pool the observed numbers for both time periods and to calculate the expected numbers of deaths in the 2005 population assuming that a common rate applied to the population. For example, for those under 7 years, the pooled rate equals (44 20) divided by (3,500 4,000). The pooled rate for this group is 8.5 per 1,000 persons. When this rate is multiplied by the 4,000 children under 7 years of age in 2005, the expected number of deaths is 34.13. Performing the same calculation for each age group results in 111.7 deaths in those 7 to 18 years of age, 175.8 deaths in those 19 to 49 years, and 237.35 deaths for those 50 years or more. The total number of deaths expected in 2005 based on this pooled rate is 558.98. Therefore, the age-adjusted overall rate for 2005 is 558.98 deaths divided by 240,000 persons. Question 35 In 2001, a state enacted a law that required the use of safety seats for all children under 7 years of age and mandatory seatbelt use for all persons. The table below lists the number of deaths due to motor vehicle accidents (MVAs) and the total population by age in 2000 (before the law) and in 2005 (4 years after the law was enacted). Based on the information in the table, it was reported that there was an increased risk of death due to MVAs in the state after the law was passed. These conclusions are: • Correct, because there were 1.8 times as many MVA deaths in 2005 as in 2000 • Correct, because for each age group, the mortality rates were higher in 2005 than they were in 2000 • Correct, because both the total and the age-adjusted mortality rates are higher in 2005 than in 2000 • Incorrect, because the age-adjusted mortality rate due to MVA is actually lower in 2005 than in 2000 • Incorrect, because the overall mortality rate is the same in both years The overall crude (unadjusted) mortality rate is 2.6 per 1,000 persons in 2005. This is found by dividing 640 deaths by a population of 240,000 persons. This rate is then multiplied by 1,000. The overall adjusted mortality rate is 2.3 per 1,000 persons as calculated in question 34. Both of these rates are higher than the overall crude mortality rate of 2.0 per 1,000 persons for the year 2000. Question 36 For colorectal cancer diagnosed at an early stage, the disease can have 5-year survival rates of greater than 80%. Which answer best describes early stage colorectal cancer? • Incidence rates and mortality rates will be similar • Mortality rates will be much higher than incidence rates • Incidence rates will be much higher than mortality rates • Incidence rates will be unrelated to mortality rates • None of the above For diseases with a long duration as indicated by high 5-year survival rates for early stage colorectal cancer, the incidence will be much higher than the mortality rate since more persons are being diagnosed with the disease than are dying of it. Question 37 The following table gives the mean annual age-specific mortality rates from measles during the first 25 years of life in successive 5-year periods. You may assume that the population is in a steady state (i.e., migrations out are equal to migrations in). The age-specific mortality rates for the cohort born in 1915-1919 are: • 2.4 2.8 1.7 1.5 0.4 • 2.9 3.7 2.8 2.0 0.6 • 2.9 2.4 1.7 1.3 0.8 • 2.4 3.3 2.0 0.6 0.1 • 1.7 2.8 2.2 1.1 0.2 This is found by tracking the cohort of children born between 1915 and 1919 by each 5-year age group. For example, this group would be 0 to 4 years of age in 1915 to 1919 with a rate of measles mortality of 2.4. In 1920 to 1924, this group of children would be 5 to 9 years of age and have a rate of measles mortality of 3.3. Continuing in a diagonal manner, the remaining three rates can be found in the table. Question 38 The following table gives the mean annual age-specific mortality rates from measles during the first 25 years of life in successive 5-year periods. You may assume that the population is in a steady state (i.e., migrations out are equal to migrations in). Based on the information above, one may conclude: • Age-specific mortality rates for measles decreased for the period 1910–1914 to 1925–1929 • Age-specific mortality rates for measles increased for the period 1910–1914 to 1925–1929 • The case-fatality rate decreased for the period 1910–1914 to 1935–1939 • Children born in 1910–1914 had the highest rate of death in all periods • Children ages 5 to 9 had the highest rate of death in all periods For each 5-year period, the highest mortality rate is reported among those 5 to 9 years of age. This is seen by comparing the rate for this age group to all other age groups in a row. Question 39 Which of the following characteristics indicate that mortality rates provide a reliable estimate of disease incidence? More than one answer may be correct. • Case-fatality rate is low • The case-fatality rate is high • The duration of disease is short • The prevalence of disease is greater than 5% • The proportionate mortality is high Question 40 Which of the following statements are true? More than one answer may be correct. • A mortality rate is an example of an incidence rate • Death certificate data are generally valid regardless of the cause of death • Type of disease is the most important predictor of mortality • Changing diagnostic criteria does not affect estimates of prevalence and incidence • The case-fatality rate is calculated based on the entire population at risk A mortality rate can approximate an incidence rate under conditions of a high case-fatality rate and a short duration of disease. Question 41 Among those who are 25 years of age, those who have been driving less than 5 years had 13,700 motor vehicle accidents in 1 year, while those who had been driving for more than 5 years had 21,680 motor vehicle accidents during the same time period. It was concluded from these data that 25-year-olds with more driving experience have increased accidents compared to those who started driving later. This conclusion is: • Correct based on the data • Incorrect because rates are not reported • Incorrect because prevalence estimates are given when incidence rates should be reported • Incorrect because there are no comparison groups identified • Both b and d are correct The information provided only enumerates motor vehicle accidents in two groups. In order to fully compare these counts, information is needed on the denominator, i.e., the number of persons driving in each group, so that rates can be calculated. Question 42 For a disease such as liver cancer, which is highly fatal and of short duration, which of the following statements is true? Choose the best answer. • Mortality rates will be much higher than incidence rates • Mortality rates will be much higher than prevalence rates • Incidence rates will be much higher than mortality rates • Case-fatality rates will be equal to mortality rates • Incidence rates will be equal to mortality rates Since the 5-year survival rate for liver cancer is 4%, most incident cases of liver cancer will result in a premature mortality. In this case, the mortality and incidence rates will be approximately equal. Question 43 The prevalence rate of a disease is two times greater in women than in men, but the incidence rates are the same in men and women. Which of the following statements may explain this situation? • The duration of disease is shorter in women • Men are at greater risk for developing the disease • The case-fatality rate is lower for women • The age-adjusted mortality rate will be higher for women • The proportionate mortality rate for the disease is higher for men Since men and women develop the disease at the same rate, the survival rate in women must be increased in order to increase duration and prevalence. A low case-fatality rate would contribute to an increased duration of the disease. Question 44 The table below describes the number of illnesses and deaths caused by plague in four communities. The case-fatality rate associated with plague is lowest in which community? • Community A • Community B • Community C • Community D The case-fatality rate equals the number of deaths occurring from plague divided by all persons with the plague. In Community C, the CFR is 300 divided by 400, or 60%. This is lower than A (67%), B (75%), and D (77%). Question 45 The table below describes the number of illnesses and deaths caused by plague in four communities. The proportionate mortality ratio associated with plague is lowest in which community? • Community A • Community B • Community C • Community D The proportionate mortality rate equals the number of deaths occurring from plague divided by all persons with the plague. In Community D, the PMR is 500 divided by 5000, or 10%. This is lower than A (50%), B (75%), and D (38%). [Show More]
Last updated: 1 year ago
Preview 1 out of 21 pages
Reviews( 0 )
Document information
Connected school, study & course
About the document
Uploaded On
Apr 26, 2021
Number of pages
21
Written in

Additional information
This document has been written for:
Uploaded
Apr 26, 2021
Downloads
0
Views
49


.png)

.png)


.png)
