Economics > Text Book Notes > Cracking the AP Economics Micro & Macro Exams, 2020 Edition: Practice Tests & Proven Techniques to H (All)
Cracking the AP Economics Micro & Macro Exams, 2020 Edition: Practice Tests & Proven Techniques to Help You Score a 5 (College Test Preparation)
Document Content and Description Below
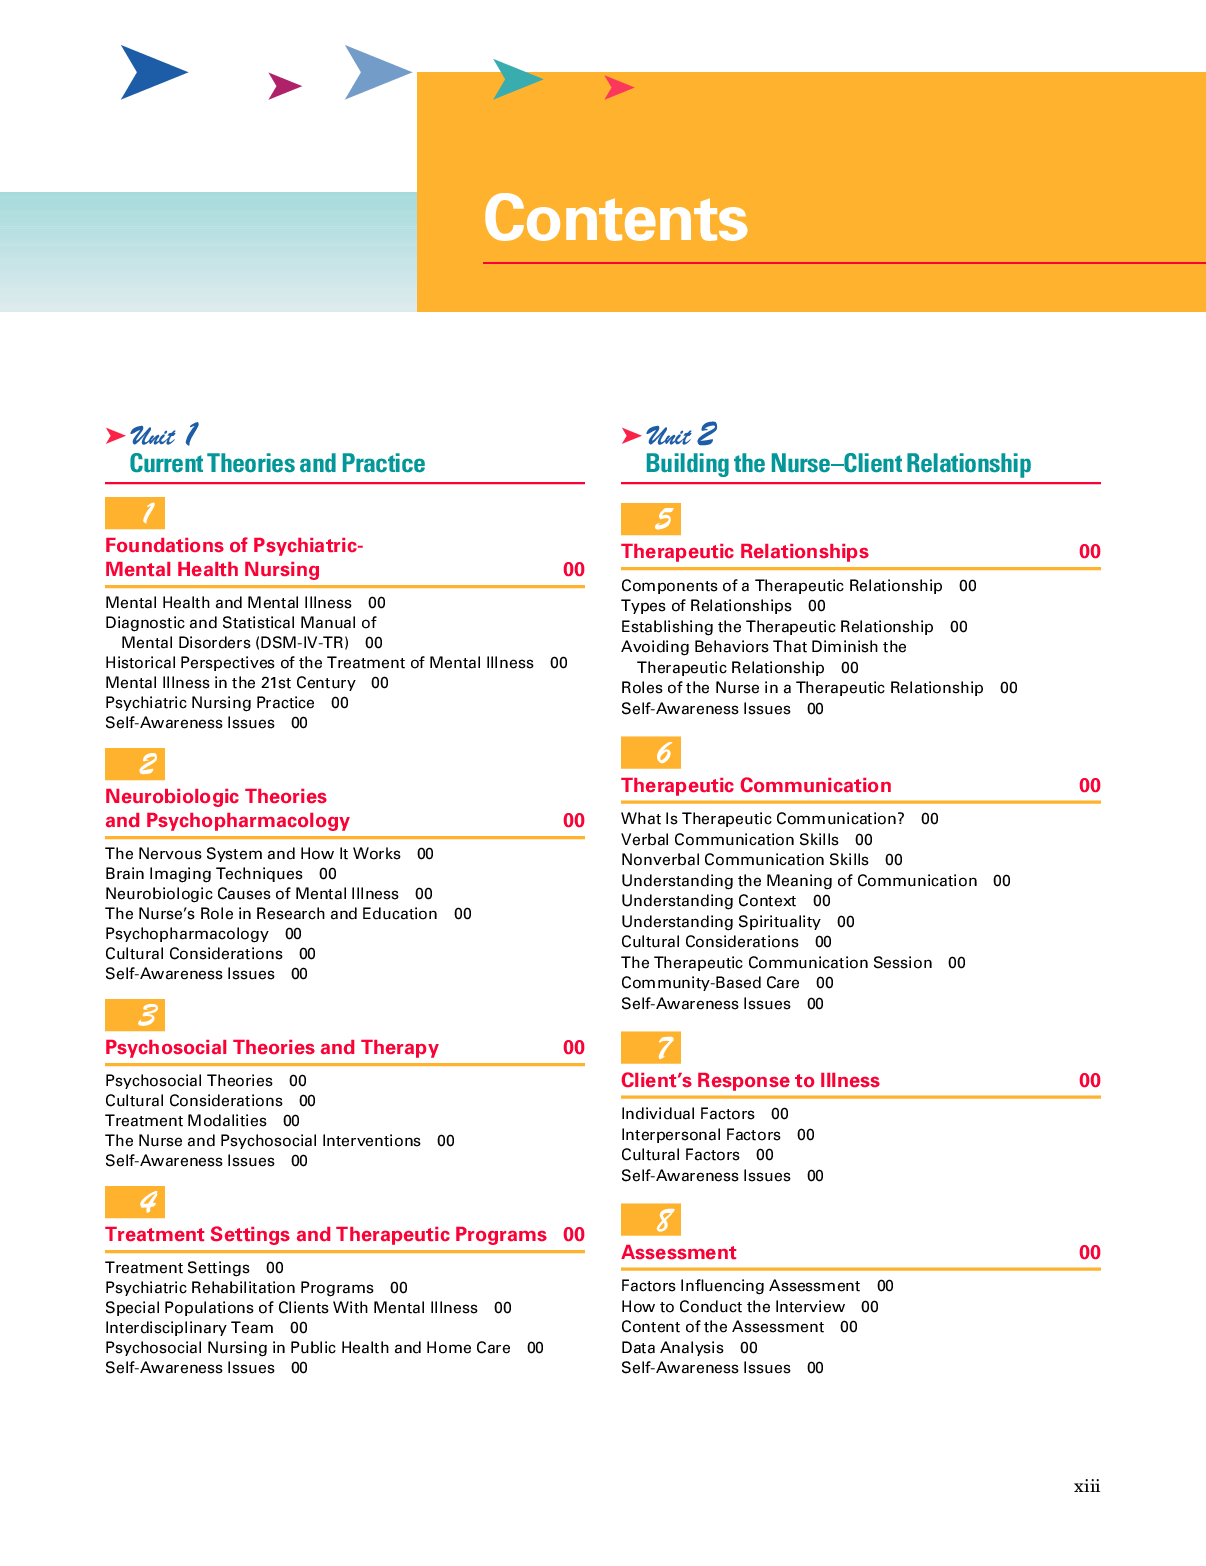
Contents Cover Title Page Copyright Acknowledgments Get More (Free) Content Part I: Using This Book to Improve Your AP Score Preview: Your Knowledge, Your Expectations Your Guide to Using This ... Book How to Begin Part II: About the AP Economics Exams The Structure of the AP Economics Exams How the AP Economics Exams Are Scored Overview of Content Topics How AP Exams Are Used Other Resources Designing Your Study Plan Part III: Test-Taking Strategies for the AP Economics Exams Preview 1 How to Approach Multiple-Choice Questions 2 How to Approach Free-Response Questions 3 Using Time Effectively to Maximize Points 4 Pacing Drills Reflect Part IV: Content Review for the AP Economics Exams Review of Microeconomics Concepts 5 Basic Microeconomics Concepts 6 Supply, Price Determination, and Firm Behavior 7 Demand, Elasticity, and the Factors of Production 8 Government and Microeconomics 9 Microeconomics Review Questions: Answers and Explanations Review of Macroeconomics Concepts 10 Basic Macroeconomics Concepts 11 Aggregate Demand 12 Money and Fiscal Policy 13 Currency Exchange, Inflation, and Growth 14 Macroeconomics Review Questions: Answers and Explanations Part V: Practice Tests 15 Microeconomics Practice Test 16 Microeconomics Practice Test: Answers and Explanations 17 Macroeconomics Practice Test 18 Macroeconomics Practice Test: Answers and Explanations Appendix: Formula Sheets Part II About the AP Economics Exams The Structure of the AP Economics Exams How the AP Economics Exams Are Scored Overview of Content Topics How AP Exams Are Used Other Resources Designing Your Study Plan Part III Test-Taking Strategies for the AP Economics Exams • Preview 1 How to Approach Multiple-Choice Questions 2 How to Approach Free-Response Questions 3 Using Time Effectively to Maximize Points 4 Pacing Drills • Reflect Chapter 1 How to Approach Multiple-Choice Questions What is the name for the idea that governments should actively regulate trade in order to maintain a positive balance of trade? (A) Free trade (B) Mercantilism (C) Elasticity (D) Monopoly (E) Laissez-faire Economic Policy Questions 1. Which of the following policy combinations would most effectively relieve inflationary pressures on the economy? Income Taxes Govt. Spending Open-Market Operations (A) Decrease Increase Buy securities (B) Increase Decrease Buy securities (C) Decrease Decrease Sell securities (D) Increase Increase Buy securities (E) Increase Decrease Sell securities Here’s How to Crack It Question 1 asks which policies would most effectively relieve inflationary pressures on the economy. You might begin by drawing an aggregate demand/aggregate supply (AD/AS) graph to help you visualize what needs to happen to decrease the price level. As you look at the AD/AS graph, you should be able to see that the price level will decrease when aggregate demand decreases (shifts left) or aggregate supply increases (shifts right). This information alone allows you to begin the Process of Elimination. Start with government spending. Since government spending is part of aggregate demand (AD), any increase in government spending will increase AD, thus shifting it to the right, which would increase prices. Therefore, you can eliminate (A) and (D). Now keep going! If income taxes decrease, then people would have more money in their pockets, which has the same effect as an increase in income, which increases AD. Thus since increasing AD leads to higher prices, you can eliminate (C). Finally, you know that buying securities increases the money supply, lowers the interest rate, increases investment, and thus increases AD and the price level. Therefore, you can rule out (B), and you are left with (E) as the correct answer. Interpret Graph Questions 2. A firm is in a perfectly competitive industry. Given the cost and demand schedules depicted in the graph above, what should the firm do in the short run? (A) Shut down (B) Stay open and produce q* (C) Stay open and produce more than q* (D) Stay open and produce less than q* (E) Stay open but produce zero units Here’s How to Crack It Question 2 asks you to interpret a graph and determine the optimal behavior for a firm in the short run. Since the price for this firm’s product is below its average total cost (ATC), it is losing money. However, if you read carefully, you’ll see that the question is asking what the firm should do in the short run, in which the current price exceeds average variable cost (AVC) and covers some of the fixed costs (average fixed costs are the difference between ATC and AVC). The firm should therefore stay open, as it will lose less than if it shuts down. Get rid of (A). In a perfectly competitive industry, marginal revenue (MR) = demand. When the price is less than ATC but greater than AVC, a firm should engage in loss minimization and produce at the level at which marginal cost (MC) = MR. This means that q* is the optimal quantity to produce, making (B) the correct answer. If a firm produces more than q*, then the cost of making each additional unit is more than the revenue the firm would receive. Eliminate (C). If the firm produces less than q*, then revenue would exceed the cost and the firm would keep producing. Eliminate (D). If a firm produced 0 units, it would not cover its fixed costs, so you can eliminate (E). Distinguishing True from False Statements Questions 3. Which of the following characterize a non-price-discriminating monopoly? I. Large barriers to entry II. MR = P III. Perfectly elastic demand IV. A unique product (A) I and II only (B) III and IV only (C) I and IV only (D) IV only (E) I, II, and IV only Here’s How to Crack It Question 3 asks you to identify characteristics of a non-price- discriminating monopoly. Price-discrimination means that a firm charges different prices to different clients. If a firm is non-price- discriminating, it charges the same price to all its clients. By drawing a typical monopoly graph, you immediately see that demand is not perfectly elastic (horizontal) and that price is above marginal revenue. This rules out items II and III and (A), (B), and (E). The distinguishing question between (C) and (D) is whether or not there are large barriers to entry in a monopoly. Because a monopoly by definition has no successful competitors, the barriers to entry must be large and the correct answer must be (C). AP Microeconomics Concepts I. Basic Economic Concepts (8–14%) A. Scarcity, choice, and opportunity cost B. Production possibilities curve C. Comparative advantage, absolute advantage, specialization, and trade D. Economic systems E. Property rights and the role of incentives F. Marginal analysis II. The Nature and Functions of Product Markets (55–70%) A. Supply and demand (15–20%) 1. Market equilibrium 2. Determinants of supply and demand 3. Price and quantity controls 4. Elasticity - Price, income, and cross-price elasticities of demand - Price elasticity of supply 5. Consumer surplus, producer surplus, and allocative efficiency 6. Tax incidence and deadweight loss B. Theory of consumer choice (5–10%) 1. Total utility and marginal utility 2. Utility maximization: equalizing marginal utility per dollar 3. Individual and market demand curves 4. Income and substitution effects C. Production and costs (10–15%) 1. Production functions: short and long run 2. Marginal product and diminishing returns 3. Short-run costs 4. Long-run costs and economies of scale 5. Cost minimizing input combination and productive efficiency D. Firm behavior and market structure (25–35%) 1. Profit - Accounting versus economic profits - Normal profit - Profit maximization: MR = MC rule 2. Perfect competition - Profit maximization - Short-run supply and shutdown decision - Behavior of firms and markets in the short run and in the long run - Efficiency and perfect competition 3. Monopoly - Sources of market power - Profit maximization - Inefficiency of monopoly - Price discrimination - Natural monopoly 4. Oligopoly - Interdependence, collusion, and cartels - Game theory and strategic behavior - Dominant strategy - Nash equilibrium 5. Monopolistic competition - Product differentiation and role of advertising - Profit maximization - Short-run and long-run equilibrium - Excess capacity and inefficiency III. Factor Markets (10–18%) A. Derived factor demand B. Marginal revenue product C. Hiring decisions in the markets for labor and capital D. Market distribution of income IV. Market Failure and the Role of Government (12–18%) A. Externalities 1. Marginal social benefit and marginal social cost 2. Positive externalities 3. Negative externalities 4. Remedies B. Public goods 1. Public versus private goods 2. Provision of public goods C. Public policy to promote competition 1. Antitrust policy 2. Regulation D. Income distribution 1. Equity 2. Sources and measures of income inequality Chapter 2 How to Approach Free-Response Questions (b) Because a drought decreases supply from S0 to S1 and successful advertising increases demand from D0 to D1, the new equilibrium price will be higher and the quantity may increase or decrease depending on the size of the supply and demand curve shifts. Common Mistakes Don’t lose points by making the following common mistakes: • Mislabeled or Unlabeled Graphs Labels matter. Just because you drew lines shaped like supply and demand curves when the question clearly is looking for them doesn’t mean the graders will assume you knew what you were doing. Label every line and every axis. • Skipped Steps in the Story Don’t hold back information that is part of the answer even if it seems obvious. The graders want to read about every step between cause and effect. Don’t just say, for example, that expansionary monetary policy increases aggregate demand. Explain how the Fed’s expansionary action shifts the money supply curve to the right, thus lowering interest rates. Explain how the lower interest rates attract more investment, shifting the aggregate expenditure function upward. Explain how the autonomous shift in aggregate expenditures results in an ultimate increase in aggregate demand equal to the change in investment times the multiplier. • Illegible Graphs or Writing Don’t be in such a hurry that your brilliant answers turn into wasted ink. • Saying Too Much Don’t stray into unquestioned territory. You won’t get points for the right answer to the wrong question and your reader might think you don’t know what you’re talking about! • The Punt Even if you don’t think you can answer a question or a part of a question, first answer the parts about which you are more confident, and then use any spare time to make your best attempt at writing something logical and coherent. Some questions might not be asking for as much complexity as you think. You might pick up a point or two if you show enough signs of intelligent life. Unfortunately, some students give up and write down jokes instead. Not even the best joke will earn any partial credit. GRAPH DRILL Now use the advice above to help you answer the following sample of a free-response question. 1. The formula for the price elasticity of demand is (i) Explain why price elasticity of demand values is typically negative. (ii) Explain the relationship between the price elasticity of demand and the slope of a demand curve. (iii) Explain why a monopoly should never operate on the inelastic portion of its demand curve. MICROECONOMICS DRILL 1. Suppose that there are only two goods: x and y. Which of the following is NOT correct? (A) One can have comparative advantage in producing both goods. (B) One can have both an absolute advantage and a comparative advantage in producing x. (C) One can have absolute advantage and no comparative advantage in producing x. (D) One can have comparative advantage and no absolute advantage in producing x. (E) All the statements above are true. 2. A change in which of the following will NOT cause a shift in the demand curve for hamburgers? (A) The price of hot dogs (B) The price of hamburgers (C) The price of hamburger buns (D) Income levels of hamburger consumers (E) The price of ketchup 3. The ability for firms to enter and exit a market over time means that (A) the marginal cost is zero (B) the marginal revenue is zero (C) the long run supply curve is more elastic (D) the long run supply curve is more inelastic (E) the firms make positive economic profit 4. When a good is taxed, the tax burden falls mainly on the consumer if (A) the demand is inelastic and the supply is inelastic (B) the demand is inelastic and the supply is elastic (C) the demand is elastic and the supply is inelastic (D) the demand is elastic and the supply is elastic (E) the tax is levied on the consumers 5. Elsa values her time at $50 per hour, and tutors David for two hours. David is willing to pay $175 for two hours of tutoring, but they negotiate a price of $125 for the entire two hours. Which of the following statements is true about the transaction above? (A) Consumer surplus is greater than producer surplus by between $50 and $75. (B) Producer surplus is greater than consumer surplus by between $50 and $75. (C) Consumer surplus is greater than producer surplus by more than $75. (D) Producer surplus is greater than consumer surplus by more than $75. (E) The difference between consumer and producer surplus is $25. 6. An externality (A) causes the equilibrium price to be artificially high (B) causes the equilibrium price to be artificially low (C) exists when markets cannot reach equilibrium (D) results in an equilibrium that does not maximize the total benefit to society (E) is an action taken by the government to bring the equilibrium price to a more equitable level MICROECONOMICS FREE-RESPONSE QUESTION 1. The graph below shows the rental market for 1-bedroom apartments in Beach City. The city government is considering intervening in this rental market. (a) Calculate the total consumer surplus at the market equilibrium price and quantity. Show your work. (b) If the city imposes rent control—that is, sets a maximum price that landlords can charge for rent—at $1,500 per month, is there a housing shortage, a surplus, or neither? Explain. (c) If instead the city sets a price floor of $2,400 per month, is there a housing shortage, a surplus, or neither? Explain. (d) If instead the city tries to limit overcrowding by restricting the number of 1-bedroom apartments that can be put up for rent to 6,000 apartments, calculate the deadweight loss. Show your work. MACROECONOMICS DRILL 1. An American buys an entertainment system that was manufactured in China. How do the U.S. national income accounts treat this transaction? (A) Net exports and GDP both rise. (B) Net exports and GDP both fall. (C) Net exports and GDP go in opposite directions. (D) Net exports fall, and there is no change in GDP. (E) There is no change in net exports, and GDP falls. 2. Which of the following would be included in U.S. GDP calculations? (A) An auto mechanic fixing his dentist’s car for a filling (B) A stay-at-home dad providing childcare for his children (C) A worker donating $200 to the Red Cross (D) High school students spending their Saturdays building homes for the homeless (E) A college student paying another student $50 in cash for a used laptop 3. Suppose a country produces only crude oil. Which of the following statements is true based on the production and price data below? Production (millions of barrels) Price (per barrel) 2014 300 $25.00 2015 250 $30.00 (A) Real GDP decreased and nominal GDP increased. (B) Both real and nominal GDP increased. (C) Both real and nominal GDP decreased. (D) Real GDP decreased and nominal GDP remained unchanged. (E) Real GDP remained unchanged and nominal GDP increased. 4. A financial planner on a popular TV show convinces more Americans to save for retirement. What is the result on the supply and demand for loanable funds? (A) The supply curve would shift up, increasing the equilibrium interest rate. (B) The demand curve would shift up, increasing the equilibrium interest rate. (C) The supply curve would shift down, decreasing the equilibrium interest rate. (D) The demand curve would shift down, decreasing the equilibrium interest rate. (E) Both the supply and demand curves would shift. 5. Suppose the reserve ratio is 0.1. If a bank gets $200 in deposits, what is the maximum amount it can lend? (A) $20 (B) $180 (C) $2,000 (D) Greater than $200 but less than $500 (E) None of the above MACROECONOMICS FREE-RESPONSE QUESTION 1. The following is a simplified balance sheet for Java Bank in the United States. Assets Liabilities Required Reserves: $5,000 Demand Deposits: $50,000 Excess Reserves: $3,000 Government Bonds: $7,000 Loans: $35,000 (a) What is the reserve requirement? (b) Assume that Kingston deposits $10,000 in his checking account. (i) By how much will Java Bank’s required reserves change based on Kingston’s deposit? (ii) As a result of the deposit, what is the new value of excess reserves based on the reserve requirement? (c) Suppose that the Federal Reserve Bank purchases $6,000 worth of bonds from Java Bank. What will be the immediate change in dollar value of each of the following after the purchase? (i) excess reserves (ii) the M1 measure of the money supply Part IV Content Review for the AP Economics Exams Review of Microeconomics Concepts 5 Basic Microeconomics Concepts 6 Supply, Price Determination, and Firm Behavior 7 Demand, Elasticity, and the Factors of Production 8 Government and Microeconomics 9 Microeconomics Review Questions: Answers and Explanations Review of Macroeconomics Concepts 10 Basic Macroeconomics Concepts 11 Aggregate Demand 12 Money and Fiscal Policy 13 Currency Exchange, Inflation, and Growth 14 Macroeconomics Review Questions: Answers and Explanations Review of Microeconomics Concepts Chapter 5 Basic Microeconomics Concepts “Supply”—Use your left arm to make a line sloping upward to the right. “Demand”—Use your right arm to make a line sloping downward to the right. “Equilibrium”—Touch your nose to the point where the demand curve (your right arm) intersects the supply curve (your left arm). “Elastic”—Represent a perfectly elastic (horizontal) demand curve by placing horizontal arms side by side. “Inelastic”—Represent a perfectly inelastic (vertical) demand curve by placing arms vertically on either side of your body. “Substitutes”—Pump one hand up into the air twice, showing that the demand for one item goes up when the price of a substitute goes up. “Complements”—Pump one hand up and then down, showing that when the price of one item goes up, the demand for a complement goes down. “Production Possibilities”—Move your left hand back and forth from a twelve o’clock position to a three o’clock position, mapping out the shape of a production possibilities frontier. “The Floor’s Up High”—Place your arm, with your hand horizontal, above your head to represent an effective price floor (which must be above the equilibrium price). “The Ceiling’s Down Low”—Place your arm, with your hand horizontal, below your torso to represent an effective price ceiling (which must be below the equilibrium price). “And That’s the Way the Econ Cheer goes!”—If all onlookers are giggling, you did it right. CHAPTER 5 REVIEW QUESTIONS See Chapter 9 for answers and explanations. 1. A demand curve slopes downward for an individual as the result of (A) diminishing marginal utility (B) diminishing marginal returns (C) the Fisher effect (D) diminishing returns to scale (E) increasing marginal cost 2. The supply curve for lawn-mowing services is likely to slope upward because of (A) decreasing marginal costs (B) increasing opportunity cost of time (C) diminishing marginal utility (D) increasing returns to scale (E) economies of scope 3. If both supply and demand increase, the result is (A) a definite increase in price and an indeterminate change in quantity (B) a definite increase in quantity and an indeterminate change in price (C) a definite decrease in quantity and an indeterminate change in price (D) a definite decrease in price and a definite increase in quantity (E) a definite increase in price and a definite increase in quantity 4. For the market supply and demand graph above, when the demand curve shifts from D to D1 and the supply curve shifts from S to S1, then (A) the equilibrium price falls and the equilibrium quantity is undetermined (B) the equilibrium price falls and the equilibrium quantity is unchanged (C) the equilibrium price is unchanged and the equilibrium quantity rises (D) the equilibrium price is undetermined and the equilibrium quantity falls (E) None of the above 5. The above diagram represents the production possibilities of Country A and Country B, with the use of the same resources. Which of the following would be true for both Country A and Country B? (A) Countries A and B cannot benefit from trade with each other. (B) Country A has a comparative advantage in TVs and Country B has a comparative advantage in DVD players. (C) Country A has a comparative advantage in DVD players and Country B has a comparative advantage in TVs. (D) Country A has an opportunity cost of DVD players when they produce 1 TV. (E) Country B has an opportunity cost of TV when they produce one DVD player. 6. Which of the following would NOT be considered a factor of production for a car company? (A) the cost of the car designer’s studio (B) the car designer’s time (C) the car designer’s creativity (D) the car designer’s preference for designing homes instead of cars. (E) the steel and rubber used in car production. Chapter 5 Summary: Basic Microeconomics Concepts Basic Concepts Positive economics describes the way things are; normative economics describes the way things should be. Economics is the study of how to allocate scarce resources among competing ends. The resources used in the production process are called inputs, or factors of production. They include the following factors: capital labor (human capital) entrepreneurship natural resources/land Opportunity Cost and Production Possibilities Opportunity cost is the value of the best alternative sacrificed as compared to what actually takes place. A production-possibilities frontier is a curve that represents all of the combinations of the two goods that could be produced using all of the available resources and technology. Efficiency in this context means that the economy is using all of its resources productively, as is true at every point on the PPF. Chapter 6 Supply, Price Determination, and Firm Behavior CHAPTER 6 REVIEW QUESTIONS See Chapter 9 for answers and explanations. 1. The long-run average cost curve (A) is always below the short-run average cost curve (B) is always above the short-run average cost curve (C) always intersects the short-run average cost curve at the minimum of short-run average cost (D) is above the short-run average cost except at one point (E) is below the short-run average cost except at one point 2. A monopoly with a straight, downward-sloping demand curve has a marginal revenue curve that is (A) upward sloping (B) halfway between the demand curve and the vertical axis (C) initially downward sloping and then upward sloping (D) parallel to the demand curve (E) parallel to the vertical axis 3. Marginal cost always intersects average variable cost at (A) the profit-maximizing quantity (B) the minimum of marginal cost (C) the maximum of average variable cost (D) the minimum of average variable cost (E) the maximum of marginal cost 4. In an oligopoly market, firms (A) cannot earn economic profits (B) are interdependent (C) are not subject to antitrust legislation (D) are large in number (E) have no market power 5. Relative to a competitive product market with the same costs, a monopoly can be expected to involve (A) more deadweight loss (B) lower prices (C) higher production levels (D) more firms (E) higher-quality products 6. Company A and Company B are competing firms that are deciding whether or not to expand their operations. The payoff matrix provided shows the profit to be earned (expressed in thousands) from any decision that is made. Based on the data provided (A) Company A has a dominant strategy and Company B does not. (B) Company B has a dominant strategy and Company A does not. (C) Neither company has a dominant strategy and a Nash equilibrium exists. (D) Both companies have a dominant strategy and a Nash equilibrium exists. (E) Company A and Company B should expand their operations. 7. Consider a profit-maximizing firm in a perfectly competitive market with several sellers and several buyers (i.e., the firm is a “price taker” of the goods it sells and a “price taker” of the hourly wages it pays its workers). If a technological innovation made by someone in this firm were to significantly raise the firm’s marginal physical product (but not that of any other firm’s), then this innovation would (A) reduce the firm’s employment level, because fewer workers are now needed (B) raise the workers’ hourly wage as they now contribute more marginal revenue (C) lead the firm to hire more workers but not to raise their wages (D) lead the firm to hire more workers and to pay them higher wages (E) None of the above 8. A competitive firm’s demand for labor is determined directly by (A) profits (B) the opportunity cost of workers’ time (C) the wage and the average (physical) product of labor (D) the marginal (physical) product of labor and the output price (E) marginal utility and marginal cost 9. Assume a firm hires labor for $15 each and sells its products for $3 each. If the MP of the third worker is 10, which of the following statements would be the most true? (A) The firm should hire more labor so that the MRPL will increase. (B) The firm should hire more labor so that the MRPL will decrease. (C) The firm should hire less labor so that the MRPL will increase. (D) The firm should hire less labor so that the MRPL will decrease. (E) The firm should do nothing because it is currently maximizing profit. 10. Marginal revenue equals marginal cost at the point where (A) total revenue is greater than total cost at its greatest distance (B) total revenue is equal to total cost (C) marginal product is at its highest point (D) total product is at its highest point (E) average total cost is at its minimum 11. A price discriminating monopoly differs from a non- discriminating monopoly because a discriminating monopoly (A) has a demand curve that is more elastic than a non- discriminating monopoly (B) earns less revenue than a non-discriminating monopoly (C) earns more revenue than a non-discriminating monopoly (D) will produce less than a non-discriminating monopoly (E) has a marginal revenue curve that is less than a non- discriminating monopoly 12. Company A and Company B above operate in a non-collusive oligopolistic market. Each needs to decide whether to have a large or small advertising strategy. According to the data, the dominant strategy for Company A and Company B would be (A) Company A small, Company B small (B) Company A small, Company B large (C) Company A large, Company B small (D) Company A large, Company B large (E) There is no dominant strategy for A or B. 13. A monopoly is less efficient than a perfect competitor because (A) a monopoly produces more output and sells for a higher price (B) a monopoly produces less output and sells for a higher price (C) a monopoly can make profit in the short run but not in the long run (D) a perfect competitor breaks even in the short run and the monopoly does not (E) a monopoly is allocatively efficient whereas the perfect competitor is productively efficient 14. For this monopolist, profit is the area represented by (A) P1OAC (B) triangle P3PD (C) triangle DBE (D) POFB (E) PDEP2 15. In the graph above, the shift in the supply curve from S to S1 for ice cream could occur because (A) consumer incomes declined and ice cream is an inferior good (B) the price of ice cream rose (C) chocolate sauce production increased (D) the cost of milk, which is used in the production of ice cream, fell (E) the cost of milk, which is used in the production of ice cream, rose Chapter 6 Summary Understanding and Manipulating Supply The supply curve shifts with Resource costs Other goods’ prices Taxes and subsidies Technology changes Expectations of suppliers Number of suppliers The Functions of an Economic System An economy reaches allocative efficiency, or efficiency in output, when the marginal cost (the cost of producing one more unit) equals the marginal value (the value of one more unit). Allocative efficiency is reached when P = MC. An economy reaches efficiency in production, or technical efficiency, when factors of supply are used to maximize production. The cost-minimizing production condition requires that the wage (w), divided by the rental rate (r) equal the marginal product of labor (MPL) divided by the marginal product of capital (MPK), the additional output produced by one more unit of capital. Efficiency of production is calculated by the following formula: An economy reaches distributive efficiency, or efficiency in exchange, when those who place the highest relative value on goods receive them; distributive efficiency is when the marginal rate of substitution (the ratio of marginal utility for two given goods) is equal for every consumer. Analyzing Costs of Production Marginal product is the additional output produced per period when one more unit of an input is added, holding the quantities of other inputs constant. Using Δ to represent change, TP to represent total product, and L to represent the number of units of labor hired per hour, the marginal product of labor is calculated as follows: The law of diminishing marginal returns states that as the amount of one input is increased, holding the amounts of all other inputs constant, the incremental gains in output (“marginal returns”) will eventually decrease. Average product is calculated as follows: The total product curve shows the relationship between the total amount of output produced and the number of units of an input used, holding the amounts of other inputs constant. Fixed costs do not change when more output is produced; variable costs are those that do change as more output is produced. Total Costs (TC) = Total Fixed Costs (TFC) + Total Variable Costs (TVC) The marginal cost is the amount by which costs increase when one more unit of output is produced. The short run is a time frame of analysis in which at least one factor of production is held constant and firms can neither enter nor exit the market; in the long-run view, all factors of production are variable and there are no fixed costs. Economies of scale exist over the range of output where the long-run average cost curve slopes downward, meaning that the cost per unit is falling. Diseconomies of scale exist over the range of output where LRAC is increasing. Increasing returns (to scale) exist when output increases proportionately more than increases in all inputs, as compared to decreasing returns and constant returns. Diminishing (marginal) returns exist when an additional unit of an input increases total output by less than the previous unit of input. An increasing cost firm faces decreasing returns to scale; a decreasing cost firm faces increasing returns to scale. An increasing cost industry experiences increases in average production costs as industry output increases; a constant cost industry is one that does not experience increased production costs as output grows; a decreasing cost industry experiences decreasing average production costs as industry output increases. Productive efficiency occurs when a firm produces at the lowest unit cost, where MC = AC. Economies of scope exist when a firm’s average production costs decrease because multiple products are being produced. Market and Individual Firm Product Pricing and Outputs Perfect competition is characterized by many sellers standardized products firms that are price takers, they accept the market price firms that can enter and exit the market freely Economic profits are total revenues minus total costs (as opposed to normal profits or accounting profits). Firm production levels are a product of total revenue, the amount of money taken in for the sale of a good; marginal revenue, the addition to revenue gained when one more unit is sold; and average revenue, total revenue divided by quantity. Profit is the difference between total revenue and total cost. A monopoly is the sole provider of a unique good. Price discrimination occurs when a seller can provide the same good to different buyers at different prices; perfect price discrimination occurs when a seller can charge each buyer the most they are willing to pay. An oligopoly is an industry in which a few firms sell a standardized or differentiated product. Market power is the ability of an individual firm to influence price. Game Theory Strategic decision making occurs anytime one individual must make a choice, but the consequences of that choice depend on factors unknown to the decision maker. Game theory considers strategic decisions individuals in a game (or in a market place) will make in anticipation of their rivals’ actions. The prisoner’s dilemma identifies a situation in which distrust leads two individual actors to choose a less than optimal result. CHAPTER 7 REVIEW QUESTIONS See Chapter 9 for answers and explanations. 1. Which of the following could have caused an increase in the demand for ice cream cones? (A) A decrease in the price of ice cream cones (B) A decrease in the price of ice cream, a complimentary good to ice cream cones (C) An increase in the price of ice cream, a complimentary good to ice cream cones (D) A decrease in the price of lollipops, a close substitute for ice cream (E) An increase in the supply of ice cream cones 2. The total utility from sardines is maximized when they are purchased until (A) marginal utility is zero (B) marginal benefit equals marginal cost (C) consumer surplus is zero (D) distributive efficiency is achieved (E) deadweight loss is zero 3. If a 3 percent increase in price leads to a 5 percent increase in the quantity supplied (A) supply is unit elastic (B) demand is inelastic (C) demand is elastic (D) supply is elastic (E) supply is inelastic 4. Normal goods always have a/an (A) elastic demand curve (B) inelastic demand curve (C) elastic supply curve (D) negative income elasticity (E) positive income elasticity 5. When the cross-price elasticity of demand is negative, the goods in question are necessarily (A) normal (B) inferior (C) complements (D) substitutes (E) luxuries 6. If a business wants to increase its revenue and it knows that the elasticity quotient of demand of its product is equal to 0.78, it should (A) decrease price because demand is elastic (B) decrease price because demand is unit elastic (C) decrease price because demand is inelastic (D) increase price because demand is inelastic (E) increase price because demand is elastic 7. A student eats 3 slices of pizza while studying for his Economics exam. The marginal utility of the first slice of pizza is 10 utils, the second slice is 7 utils, and the third slice is 3 utils. Which of the statements below holds true with the above data? (A) The student would not eat any more pizza. (B) The marginal utility of the fourth slice of pizza will be 0. (C) The student should have stopped eating pizza after 2 slices. (D) The total utility this student received from eating pizza is 20 utils. (E) The total utility decreases after the first slice of pizza because of diminishing marginal utility. 8. Relative to a competitive input market, a monopsony (A) pays less and hires more workers (B) pays less and hires the same number of workers (C) pays more and hires more workers (D) pays more and hires fewer workers (E) pays less and hires fewer workers 9. Which of the following is NOT among the methods unions use to increase wages? (A) Negotiations to obtain a wage floor (B) Restrictive membership policies (C) Efforts to decrease the prices of substitute resources (D) Featherbedding or make-work rules (E) Efforts to increase the demand for the product they produce 10. A bilateral monopoly exists when (A) a monopsony buys from a monopoly (B) a monopoly sells to two different types of consumers (C) a monopoly buys from a monopsony (D) a monopolist sells two different types of goods (E) a monopoly sells at two different prices Chapter 7 Summary Understanding and Manipulating Demand The demand curve shifts with Tastes and preferences of consumers the prices of Related goods the Income of buyers the number of Buyers Expectations for the future Measuring Consumer Preference Marginal utility is the additional utility gained from consuming one more unit of a good. Total utility is the sum of all marginal utility values gained from each unit consumed. Consumer surplus is the value a buyer receives from the purchase of a good in excess of what the consumer pays for it; producer surplus is the difference between the price a seller receives for a good and the minimum price for which she would be willing to supply a quantity of the good. Elasticity The price elasticity of demand for a given good describes the extent to which consumer behavior will change as the price of the good changes. The elasticity of a good relates to the Proportion of the consumer’s income spent on the good the Availability of close substitutes the Importance of a good the ability to Delay the purchase of a good A good is elastic (a luxury) if %ΔQd > %ΔP A good is unit elastic if %ΔQd = %ΔP A good is inelastic (a necessity) if %ΔQd < %ΔP Knowing the elasticity of a demand curve tells sellers how much their total revenue will change with a change in price: elastic goods: P TR unit elastic goods: P TR constant inelastic goods: P The elasticity of supply measures the responsiveness of the quantity supplied to price changes. Elasticity of supply is calculated by Income Elasticity Income elasticity of demand measures the responsiveness of the quantity demanded to changes in income. Income elasticity is calculated by Individuals buy more normal goods (positive income elasticity) when their income increases; they buy more inferior goods (negative elasticity) when their income decreases. Cross-Price Elasticity of Demand The cross-price elasticity of demand measures the responsiveness of the quantity demanded of one good to the price of another. Cross-price elasticity of good x in relation to good y is calculated by When cross-price elasticity is negative, then goods x and y are complements; when cross-price elasticity is positive, then goods x and y are substitutes. Deriving the Value of Factors of Demand The marginal revenue product of labor is the amount of revenue generated by one additional unit of labor; calculate using this formula: MRPL = MPL × Poutput The above equation can be used for any of the factors of demand. Determining Wages and Other Factor Prices A monopsony occurs when one firm is the sole purchaser of labor services. The marginal factor cost (MFC) is the additional cost of one more unit of labor. A monopsony will choose an employment level at which MRPL = MFCL. Unions Workers increase their collective bargaining and lobbying strengths by forming labor unions. They attempt to increase the demand for labor decrease the supply of labor negotiate higher wages Bilateral Monopoly A bilateral monopoly occurs when there is only one buyer and one seller in the market. CHAPTER 8 REVIEW QUESTIONS See Chapter 9 for answers and explanations. 1. Suppose the supply and demand for cotton in the United States are represented by curves S and D respectively in the figure above. Also assume that the world supply for cotton is so large that the United States would be a “price taker” in the world market (as represented by WS). If the United States were to open its cotton market to free trade with the world, then (A) the domestic price of cotton would rise, and the United States would export cotton (B) the domestic price of cotton would fall, and the United States would export cotton (C) the domestic price of cotton would rise, and the United States would import cotton (D) the domestic price of cotton would fall, and the United States would import cotton (E) there would be no change in the price of cotton in the United States 2. When the labor demand curve is downward-sloping, an increase in the minimum wage is (A) beneficial to some workers and harmful to other workers (B) beneficial to all workers and harmful to some employers (C) harmful to all workers and employers (D) beneficial to all workers and employers (E) none of the above 3. Because people with relatively low incomes spend a larger percentage of their income on food than people with relatively high incomes, a sales tax on food would fall into which category of taxes? (A) Progressive (B) Proportional (C) Regressive (D) Neutral (E) Flat 4. If the government regulates a monopoly to produce at the allocative efficient quantity, which of the following would be true? (A) The monopoly would break even. (B) The monopoly would incur an economic loss. (C) The monopoly would make an economic profit. (D) The deadweight loss in this market would increase. (E) The deadweight loss in this market would decrease. 5. If the government subsidizes producers in a perfectly competitive market, then (A) the demand for the product will increase (B) the demand for the product will decrease (C) the consumer surplus will increase (D) the consumer surplus will decrease (E) the supply will decrease 6. If corn is produced in a perfectly competitive market and the government placed a price ceiling above equilibrium, which of the following would be true? (A) There would be no change in the amount of corn demanded or supplied. (B) There would be a shortage created of corn. (C) There would be a surplus created of corn. (D) The producers of corn would lose revenue due to the decreased price. (E) Illegal markets may develop for corn. 7. Which of the following examples would result in consumers paying for the largest burden of an excise tax placed on a producer? (A) If the demand curve is price elastic and the supply curve is price inelastic (B) If the demand curve is price elastic and the supply curve is perfectly elastic (C) If the demand curve is price inelastic and the supply curve is price elastic (D) If the demand curve is price inelastic and the supply curve is price inelastic (E) If the demand curve is perfectly inelastic and the supply curve is price elastic Chapter 8 Summary Systems of Government and Economic Decisions Communism is a system in which the government owns all the resources in society and answers the three economic questions: what, how, and for whom are goods produced. Socialism is a system in which the government maintains control of some resources in society, such as energy distribution, education, or health care. Capitalism is a system in which individuals and private firms own the resources in society and answer the three economic questions: what, how, and for whom are goods produced. Basic Government Interventions A price ceiling is an artificial cap on the price of a good. A price floor is an artificially imposed minimum price. Deadweight loss (also known as efficiency loss or excess burden) is the loss to former consumer and producer surplus in excess of total revenue of the tax. Calculating the effects of a new tax is tricky: the burden of the tax does not depend on who has to pay for it. Rather, the weight of the tax burden depends on the relative elasticity of the supply and demand curves for the good in question. Responding to Market Failure Natural monopolies occur when fixed costs are so high as to prohibit a second firm from entering the market. The Sherman Act, the Clayton Act, the Robinson-Patman Act, and the Celler-Kefauer Act are important pieces of antitrust legislation. A vertical merger is a merger of firms at various steps in the production process. A conglomerate merger is a combination of firms from unrelated industries. A horizontal merger is a merger of direct competitors. A market failure occurs whenever resources aren’t allocated optimally. This can result from imperfect competition externalities: costs or benefits felt beyond those causing the effects public goods: goods that many individuals benefit from at the same time imperfect information: buyers and/or sellers do not have full knowledge about available markets, prices, products, customers, suppliers Negative externalities lead to overconsumption; positive externalities lead to underconsumption. The marginal private cost (MPC) of a good is the cost paid by the consumer for an additional unit of a good; the marginal external cost is the cost paid by people other than the buyer for an additional unit of a good. A nonrival good is one for which the consumption of that good does not affect its consumption by others. Nonexcludable goods cannot be held back from those who desire access. A free rider is one who attempts to benefit from a public good without paying for it. The Gini coefficient uses the Lorenz curve to calculate income inequality. The poverty line is the official benchmark for poverty; it is set at three times the minimum food budget as established by the Department of Agriculture. CHAPTER 10 REVIEW QUESTIONS See Chapter 14 for answers and explanations. 1. Gross Domestic Product is a close approximation of (A) national income (B) societal welfare (C) the consumer price index (D) the GDP deflator (E) the current account balance 2. The government measures inflation using the (A) GNP (B) URL (C) CPI (D) FED (E) GDP 3. If global warming raises temperatures so high that snow can never again exist anywhere, snow ski instructors will experience which type of unemployment? (A) Structural (B) Frictional (C) Seasonal (D) Institutional (E) Cyclical 4. Long-run aggregate supply is most likely to increase as the result of (A) an increase in the real interest rate (B) increased investment in capital (C) an increase in aggregate demand (D) an increase in the unemployment rate (E) an increase in the exchange rate 5. The diagram above shows data about the change in prices for a variety of goods. What happened to the CPI for this consumer from year 1 to year 2? (A) It rose by 3%. (B) It fell by 3%. (C) It fell by one-third. (D) It rose by one-third. (E) It remained unchanged. 6. Which of the following would be classified under C when calculating GDP? (A) A homeowner mowing her own lawn (B) $50.00 spent eating out at a restaurant (C) The purchase of new computer software by an accounting firm (D) Flour purchased by a baker to make donuts (E) Donating old clothing to charitable causes 7. Which transactions will NOT be counted in GDP? (A) Pirated DVDs entering the nation illegally (B) The services of a physician (C) A retiree’s social security benefits (D) A and C (E) B and C Chapter 10 Summary Measurement of Economic Performance A country’s annual Gross Domestic Product (GDP) is the total value of all final goods and services produced in a year within that country. GDP is calculated using either the expenditure approach or the income approach. National income (NI) is the sum of income earned by the factors of production owned by a country’s citizens. Personal income (PI) is the money income received by households before personal income taxes are subtracted, and disposable income (DI) is personal income minus personal income taxes. Depreciation is the decline in the value of capital over time due to wear or obsolescence. Inflation is a sustained increase in the overall price level. Deflation is a sustained decrease in the overall price level. One’s nominal salary is the actual number of dollars that person earns; one’s real salary is the purchasing power of those dollars. The Consumer Price Index (CPI) is the government’s gauge of inflation. Calculate CPI using the following formula: Inflation between years Y and Z = The Producer Price Index (PPI) measures changes in the prices of wholesale goods such as lumber and steel. The Gross Domestic Product Deflator is an alternative general price index that reflects the importance of products in current market baskets, rather than in base year market baskets, which become less relevant over time. The labor force includes employed and unemployed adults. To be unemployed, a labor force participant must be willing and able to work, and must have made an effort to seek work in the past four weeks. The labor force participation rate is the number of people in the labor force divided by the working-age population. Discouraged workers are those who are willing and able to work, but become so frustrated in their attempts to find work that they stop trying; dishonest workers claim to be unemployed to receive benefits, but are able to work or working for cash in an unreported job. Full employment is the level of unemployment that corresponds with the natural rate of unemployment (about 5% in the United States). Okun’s Law states that for every one percentage point increase in the unemployment rate above the natural rate, output falls by 2 to 3 percentage points. National Income and Price Determination The aggregate supply (AS) curve indicates the total value of output that producers are willing and able to supply at alternative price levels in a given time period, holding other influences constant. Aggregate demand (AD) is the total demand for goods and services in the economy. The price level is the average level of all prices. The long-run aggregate supply curve (LAS) is vertical and stands at the level of output that corresponds with full employment. Say’s law is the idea that supply creates its own demand. British economist John Maynard Keynes theorized a flat AS curve in the depression range and argued that wages cannot adjust to match changes in prices levels. Further, he argued that deviations from full employment output might persist until the government steps in with monetary or fiscal policy. The theory of rational expectations suggests that people learn to anticipate government policies designed to influence the economy, thereby making the policies ineffectual. CHAPTER 11 REVIEW QUESTIONS See Chapter 14 for answers and explanations. 1. Operating in the intermediate range of the aggregate supply curve, an increase in aggregate demand results in an increase in (A) price level only (B) real GDP only (C) neither price level nor real GDP (D) nominal GDP only (E) price level and real GDP 2. If the marginal propensity to consume is 0.8, what is the largest total increase in GDP that can result from $500 of new spending? (A) $400 (B) $500 (C) $625 (D) $2,500 (E) $5,000 3. Stagflation occurs when (A) the price level rises for two consecutive quarters (B) the price level rises and output falls (C) the price level stays the same and output increases (D) the price level stays the same and output decreases (E) the price level and output both fall 4. A recessionary gap exists when the short-run equilibrium level of real GDP (A) decreases over time (B) equals the full-employment level of real GDP (C) is above the full-employment level of real GDP (D) is below the full-employment level of real GDP (E) increases over time 5. On the graph of the aggregate supply and demand model above, a recessionary gap exists, and the economy is in (A) neither short-run nor long-run equilibrium (B) long-run, but not short-run, equilibrium (C) short-run equilibrium (D) both long- and short-run equilibrium (E) neutral equilibrium Chapter 11 Summary Circular Flow Aggregate income = Aggregate expenditure = GDP Components of Aggregate Demand Aggregate demand is the total demand for goods and services in the economy. Three effects cause the inverse relationship between price and GDP. The Real Wealth Effect The Foreign Trade Effect The Interest Rate Effect Equilibrium of AD and AS Cost-push or supply-side inflation occurs when inflation results from an increase in resource costs that shifts the AS curve to the left. Stagflation is defined by the combination of rising prices and falling output. Demand pull inflation is the result of the AD curve shifting out to the right relative to the AS curve. Inflation that remains steady for a long period at a low rate is called creeping inflation. Unsteady inflation that exceeds 10 percent per year and grows month after month is galloping inflation. Hyperinflation is very rapid price increases in excess of 50 percent per year. A recessionary gap exists as the amount by which equilibrium real GDP would have to increase to reach LAS. An inflationary gap exists as the amount by which equilibrium real GDP would have to decrease to reach LAS. The spending multiplier is the number by which the initial amount of new spending should be multiplied to find the total resulting increase in real GDP. The marginal propensity to consume (MPC) is the amount by which consumption increases for every additional dollar of real income. The marginal propensity to save (MPS) is the fraction of each additional dollar of income that is saved. The formula for the spending multiplier or expenditure multiplier is Multiplier CHAPTER 12 REVIEW QUESTIONS See Chapter 14 for answers and explanations. 1. Which of the following statements is correct in regard to the federal budget deficit and the federal debt? (A) When the debt is negative, the deficit decreases. (B) When the debt is positive, the deficit decreases. (C) The deficit is the accumulation of past debts. (D) When the deficit is negative, the debt decreases. (E) When the deficit is negative, the debt increases. 2. There is relatively more crowding out as the result of expansionary fiscal policy when (A) expansionary monetary policy accompanies the fiscal policy (B) the investment demand curve is inelastic (C) government spending improves profit expectations among businesses (D) aggregate supply is vertical (E) the investment demand curve is elastic 3. Which of the following would be considered contractionary monetary policy? (A) The purchase of bonds (B) The sale of bonds (C) An increase in taxes (D) An increase in government spending (E) A decrease in the discount rate 4. In what ways is contractionary fiscal policy in the United States likely to affect domestic interest rates and the international value of the dollar? (A) Interest rates increase and the dollar depreciates. (B) Interest rates decrease and the dollar appreciates. (C) Interest rates increase and the dollar appreciates. (D) Interest rates decrease and the dollar is not affected. (E) Interest rates decrease and the dollar depreciates. 5. Which of the following policies might the Fed adopt to counter a recession? (A) A decrease in taxes (B) An increase in government spending (C) An increase in the discount rate (D) An increase in the required reserve ratio (E) The purchase of bonds 6. Which of the following statements would “supply-side” economists disagree with? (A) Tax changes cause shifts in aggregate supply that work against shifts in aggregate demand, thus reducing the effect of the tax change on real GDP. (B) A tax cut is likely to increase aggregate supply by boosting saving, investment, and thus capital accumulation. (C) A tax increase is likely to decrease aggregate supply by decreasing after-tax wages and thus providing disincentives to work. (D) A tax cut is likely to increase aggregate supply by providing greater rewards for risk taking. (E) A decrease in tax rates does not necessarily result in a decrease in tax revenues. 7. The Fed decides to sell bonds on the open market. How is this likely to affect interest rates and the value of the dollar? (A) The interest rate decreases, and the value of the dollar decreases. (B) The interest rate decreases, and the value of the dollar increases. (C) The interest rate increases, and the value of the dollar increases. (D) The interest rate increases, and the value of the dollar decreases. (E) The interest rate increases, and the value of the dollar remains the same. 8. How will an increase in investment from businesses and consumers affect aggregate demand? (A) Investment from businesses and consumers doesn’t affect aggregate demand. (B) Aggregate demand will increase. (C) Aggregate demand will decrease. (D) Aggregate will spike before equalizing. (E) Aggregate demand will remain the same. Chapter 12 Summary Money and Banking Money is anything that is commonly accepted as a means of payment for goods and services. Money has three functions. Medium of exchange Store value Unit of account Currency is any item that is used as money that does NOT act as a store of value or carry intrinsic value. Commodity money is any raw material with intrinsic value that is used in exchange for other goods in an economy (such as a silver coin). Fiat money is a currency without intrinsic value (such as paper cash). Fiat money is also known as currency. Wealth is the value of the total assets owned by an individual or entity. Money supply is the amount of money available on the market; liquidity refers to how easily that money can be accessed. M1 is the sum of coin and paper money plus checking deposits and travelers’ checks. M2 is M1 plus investments. The United States has a fractional reserve banking system in which only a fraction of total deposits is held on reserve and the rest is lent out. Money creation is the generation of assets caused by an initial deposit to a bank being held partially in reserve and partially redistributed as a loan over and over again. The money multiplier is the total amount of deposits resulting from an initial deposit that is ultimately held as reserves. Money multiplier = The discount rate is the interest rate banks pay to borrow money from the Fed. Open market operations involve the Fed’s purchase and sale of government securities. Fiscal Policy The government exercises fiscal policy when it tries to counter fluctuations in aggregate expenditure with changes in purchases, transfer payments, or taxes. Expansionary fiscal policy involves increasing government purchases, increasing transfers, or decreasing taxes in order to shift aggregate demand to the right and boost real GDP. To summarize the effects Contractionary fiscal policy involves decreasing purchases, decreasing transfers, or increasing taxes, thus shifting aggregate demand to the left, which will lower the price level and decrease real GDP. Because government purchases are a component of autonomous expenditures, the government spending multiplier is the same as the autonomous spending multiplier. Government spending multiplier = The tax multiplier is the total change in real GDP resulting from each $1 change in taxes. Tax multiplier = – Crowding out is the decrease in real investment stemming from higher interest rates due to government purchases. Monetary policy is the use of money and credit controls to influence interest rates, inflation, exchange rates, unemployment, and real GDP. The effects of expansionary monetary policy are The effects of contractionary monetary policy are Fiscal-Monetary Mix A liquidity trap exists when the demand for money is perfectly flat, meaning that changes in the money supply will have no effect on interest rates. The equation of exchange states that the number of dollars multiplied by the number of times they are used per year must equal the total number of dollars spent in a year. MV = PQ The velocity of money (V) is the number of times per period that the average dollar is spent on final goods and services. The quantity theory of money states that Q is stable in addition to V. Monetarists believe that there is a fairly stable natural rate of real interest, in which case fluctuations in the nominal interest rate simply reflect changes in anticipated inflation. The Fisher effect occurs when market participants can predict that the Fed will counter inflation by reducing money supply growth, causing anticipated inflation and nominal interest rates to fall when the Fed tightens the money supply. Deficits The budget deficit is the difference between federal government spending and tax collections in one year. The national debt is the accumulation of past deficits—the total amount that the federal government owes at a given time. The Ricardian Equivalence theory states that deficit financing is no different from tax financing because if the former is chosen, people will simultaneously increase their savings by the amount they would have been taxed in preparation for the inevitable repayment of the debt at a later time. CHAPTER 13 REVIEW QUESTIONS See Chapter 14 for answers and explanations. 1. Depreciation of the dollar is most likely to (A) increase imports (B) increase travel abroad (C) increase exports (D) decrease a trade surplus (E) increase a trade deficit 2. The short-run Phillips curve indicates a (A) direct relation between unemployment and inflation (B) direct relation between price and quantity demanded (C) inverse relation between price and quantity demanded (D) inverse relation between unemployment and inflation (E) vertical relation between unemployment and inflation 3. Income in Japan grows at a faster rate than income in the U.S. How does this affect the demand for the US dollar and the value of the US dollar? (A) Demand for the dollar will increase, and the dollar will depreciate. (B) Demand for the dollar will increase, and the dollar will appreciate. (C) The supply of the dollar increases, and the dollar appreciates. (D) Demand for the dollar decreases, and the dollar will appreciate. (E) The supply of the dollar decreases, and the dollar will remain the same. 4. A crisis in the U.S. causes investors to prioritize opportunities in Europe and Japan. How does this affect the demand for the US dollar? (A) Demand for the dollar increases, and the value depreciates. (B) Demand for the dollar increases, and the value appreciates. (C) Demand for the dollar decreases, and the value depreciates. (D) Demand for the dollar decreases, and the value appreciates. (E) The supply of the dollar increases, and value will remain the same. 5. Japan decides to reduce taxes, causing growth. How does this affect the US dollar? (A) Reducing taxes in Japan has no effect on the US dollar. (B) Reducing taxes in Japan increases the demand of the US dollar. (C) Reducing taxes in Japan decreases the demand for the US dollar. (D) Reducing taxes in Japan causes the Fed to reduce taxes in the U.S. (E) Reducing taxes in Japan causes the Fed to keep taxes in the U.S. the same. Chapter 13 Summary International Currency Exchange When a central bank sets a fixed exchange rate, changes in demand affect only the quantity of dollars purchased; with a flexible exchange rate, a central bank can fix the quantity of assets denominated in the home currency. The balance of payments is a statement of all international flows of money over a given period. A trade deficit exists when imports exceed exports; the opposite is a trade surplus. A currency that depreciates or becomes weaker is one that falls in value relative to other currencies; appreciation occurs when a currency gains value relative to others. Arbitrage is the practice of buying at a low price and selling at a high price for a certain profit. Monetary inflation occurs when prices increase due to an oversupply of currency Economic Growth Sources of growth include increased investments in human capital increased investments in physical capital improvements in technology enhanced resource utilization A Phillips curve illustrates the inverse relationship between the inflation rate and unemployment. [Show More]
Last updated: 1 year ago
Preview 1 out of 517 pages

Reviews( 0 )
Document information
Connected school, study & course
About the document
Uploaded On
Jun 03, 2020
Number of pages
517
Written in
Additional information
This document has been written for:
Uploaded
Jun 03, 2020
Downloads
0
Views
108


