Mathematics > QUESTIONS & ANSWERS > MATH 225 Central Limit Theorem for Proportions Week 5 Assignment : complete solutions (2019/20) Cham (All)
MATH 225 Central Limit Theorem for Proportions Week 5 Assignment : complete solutions (2019/20) Chamberlain.
Document Content and Description Below
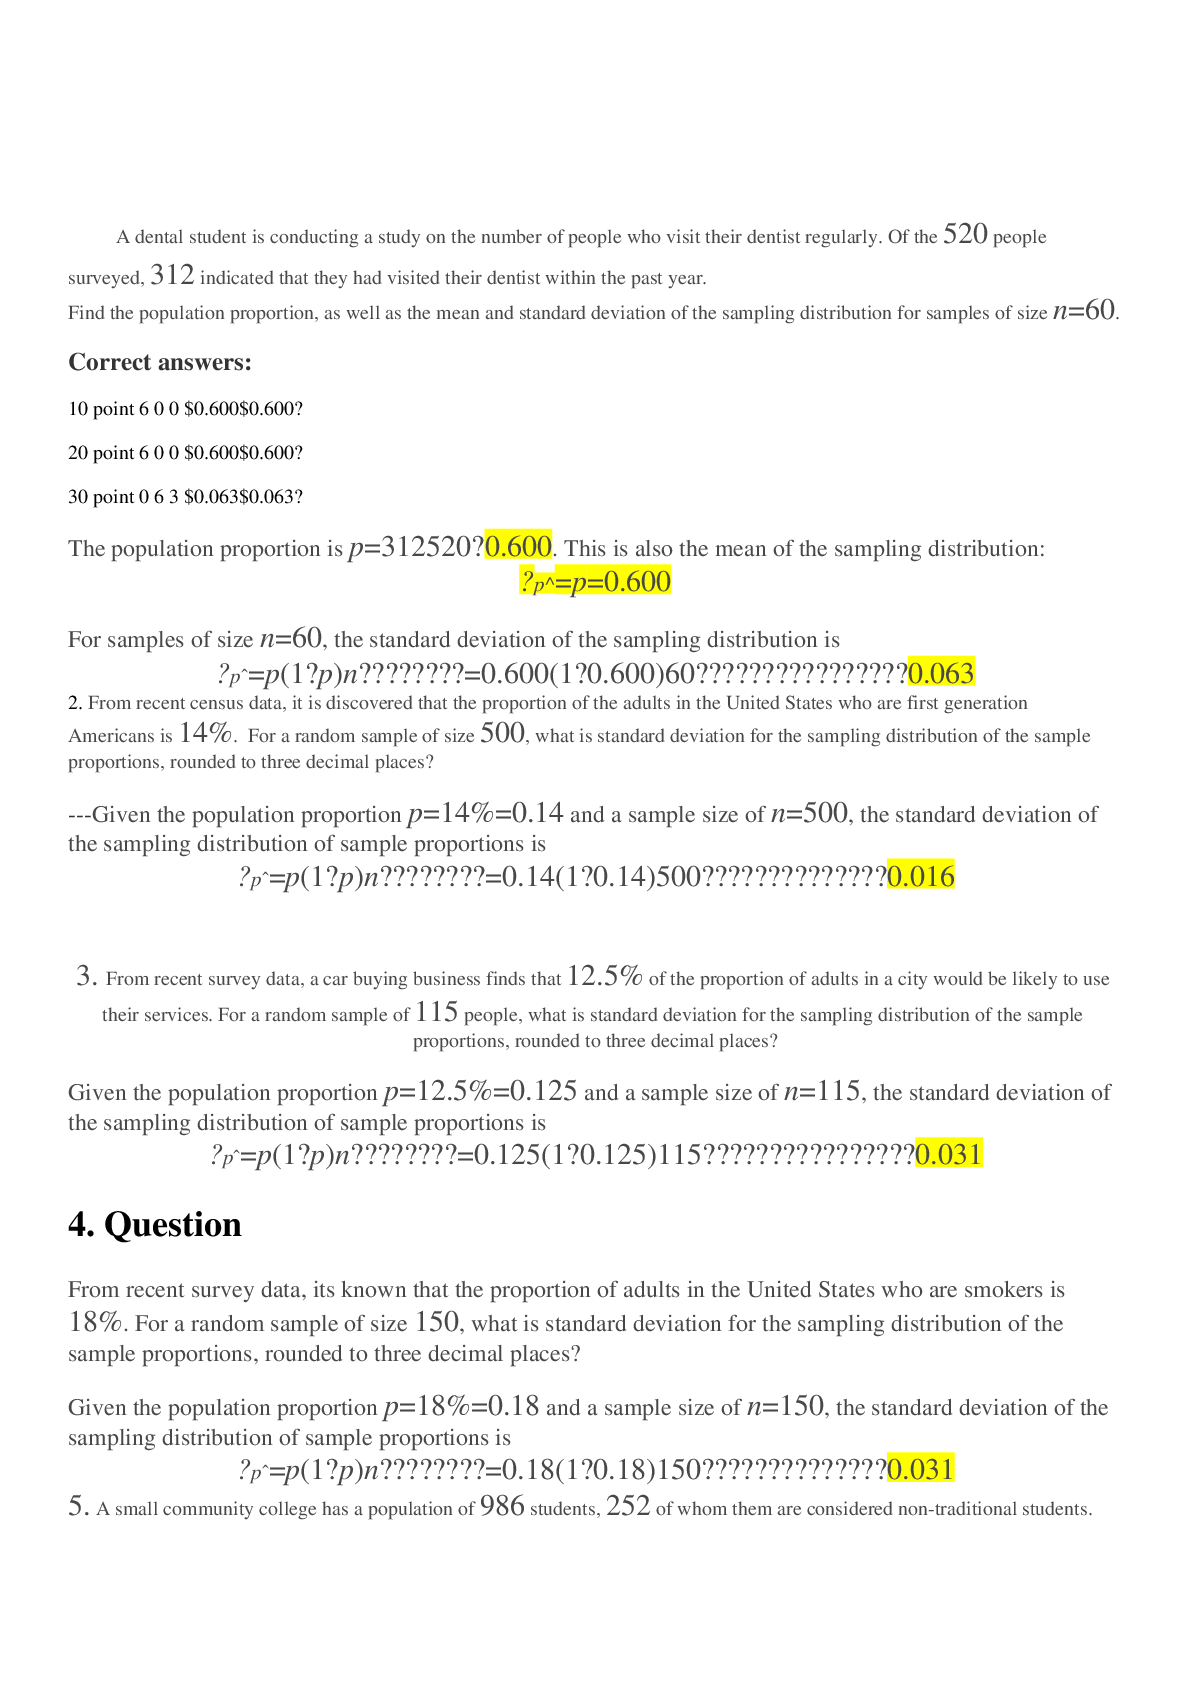
MATH 225 Central Limit Theorem for Proportions Week 5 Assignment: 1. A dental student is conducting a study on the number of people who visit their dentist regularly. Of the 520 people surveyed, 312 ... indicated that they had visited their dentist within the past year. Find the population proportion, as well as the mean and standard deviation of the sampling distribution for samples of size n=60. 2. From recent census data, it is discovered that the proportion of the adults in the United States who are first generation Americans is 14%. For a random sample of size 500, what is standard deviation for the sampling distribution of the sample proportions, rounded to three decimal places? 3. From recent survey data, a car buying business finds that 12.5% of the proportion of adults in a city would be likely to use their services. For a random sample of 115 people, what is standard deviation for the sampling distribution of the sample proportions, rounded to three decimal places? 4. Question From recent survey data, its known that the proportion of adults in the United States who are smokers is 18%. For a random sample of size 150, what is standard deviation for the sampling distribution of the sample proportions, rounded to three decimal places? Given the population proportion p=18%=0.18 and a sample size of n=150, the standard deviation of the sampling distribution of sample proportions is 5. A small community college has a population of 986 students, 252 of whom them are considered non-traditional students. Find the population proportion, as well as the mean and standard deviation of the sampling distribution for samples of size n=40. Round all answers to 3 decimal places. For samples of size n=40, the standard deviation of the sampling distribution is 6. A marketing team is targeting people who might buy a hybrid car. In their city, with a population of 30,000 people, 3,170 people either drive a hybrid car or have indicated on a recent survey that they would be interested in driving one. Find the population proportion, as well as the mean and standard deviation of the sampling distribution for samples of size n=121. For samples of size n=121, the standard deviation of the sampling distribution is 7. A brokerage company is analyzing its retirement accounts for its clients nearing retirement. From recent survey data, the proportion of adults in the United States who say they are financially ready for retirement is 31%. For a random sample of size 85, what is standard deviation for the sampling distribution of the sample proportions, rounded to three decimal places? Given the population proportion p=31%=0.31 and a sample size of n=85, the standard deviation of the sampling distribution of sample proportions is 8. Question Given the plot of normal distributions A and B below, which of the following statements is true? Select all correct answers. 9. Question Given the plot of normal distributions A and B below, which of the following statements is true? Select all correct answers. 10. Question The graph below shows the graphs of several normal distributions, labeled A, B, and C, on the same axis. Determine which normal distribution has the largest standard deviation. 11. Question Given the plot of normal distributions A and B below, which of the following statements is true? Select all correct answers. 12. Question The graph below shows the graphs of several normal distributions, labeled A, B, and C, on the same axis. Determine which normal distribution has the largest mean. Remember that the mean of a normal distribution is the x-value of its central point (the top of the "hill"). Therefore, a distribution with a larger mean will be centered farther to the right than a distribution with a smaller mean. The distribution that is farthest to the right is A, so that has the largest mean. 13. Question Which of the data sets represented by the following histograms has the smallest standard deviation? An untitled histogram has a horizontal axis labeled from 0 to 150 in increments of 50 and vertical axis labeled from 0 to 140 in increments of 20. The histogram contains vertical bars of width 6, starting at the horizontal axis value of 75. The approximate heights of the bars as follows, where the horizontal axis label is listed first and the approximate height is listed second: 75, 6; 82, 18; 88, 70; 76, 115; 82, 150; 88, 103; 95, 70; 102, 20; 108, 8. Remember that the standard deviation is a measure of how spread out the data is. If the values are concentrated around the mean, then a data set has a lower standard deviation. A histogram with a taller hill indicates higher frequencies of the same values, and has a lower standard deviation than a histogram with a shorter hill and a wider range of values. 14. Question Which of the data sets represented by the following box and whisker plots has the smallest standard deviation? 15. Suppose that you are conducting a survey on how many pets each employee has in his or her household. The mean number of pets is 4 per household, and the standard deviation is 2. Rob only owns cats, and he has 10 cats. (Which of the following statements is true?) If the number of pets owned by Rob is 6 standard deviations to the right of the mean, then Rob should have 4+6×2=16 pets. 16. Question A math instructor is teaching an algebra course, statistics course and calculus course. After the final exams are completed the instructor would like to know which class had most consistent scores on the final exam and which class had the greatest variation in scores on the final exam. The results from the final exam for these three classes are shown below: • Algebra class: Mean Final Exam score of 85.2, standard deviation of 3.9 • Statistics class: Mean Final Exam score of 81.7, standard deviation of 5.3 • Calculus class: Mean Final Exam score of 84.3, standard deviation of 1.8 Based on these results, which class had most consistent scores on the final exam and which class had the greatest variation in scores on the final exam. ________________________________________ 17. Question Which of the data sets represented by the following box and whisker plots has the smallest standard deviation? 18. Which of the following lists of data has the largest standard deviation? 19. Question Which of the following lists of data has the largest standard deviation? 20. Question The graph below shows the graphs of several normal distributions, labeled A, B, and C, on the same axis. Determine which normal distribution has the largest mean. 21. Question Given the plot of normal distributions A and B below, which of the following statements is true? Select all correct answers. A figure consists of two curves labeled Upper A and Upper B. Curve Upper A is evenly spread out from the center, and curve Upper B is farther to the right than A and more evenly spread out. Remember that the mean of a normal distribution is the x-value of its central point (the top of the "hill"). Therefore, a distribution with a larger mean will be centered farther to the right than a distribution with a smaller mean. Graphs of the Normal Distribution There are many normal distributions, and these normal distributions can differ in their means and in their standard deviations. The figure below shows three normal distributions. A figure consists of three unlabeled curves. The first curve is evenly spread out from the center, the second curve is tall and the least spread out, and the third curve is taller and skinnier than the second curve, and it is the least spread out. • The distribution in green (left-most) has a mean of −3 and a standard deviation of 0.5. • The distribution in red (in the middle) has a mean of 0 and a standard deviation of 1. • The distribution in black (right-most) has a mean of 2 and a standard deviation of 3. These, as well as all other normal distributions, are symmetric with more values at the center of the distribution than in the tails. Note that the standard deviation affects the height of the normal distribution. Parameters of the Normal Distribution The density of the normal distribution (the height for a given value on the x-axis) is a complicated expression. The most important part of this expression are the parameters that define the normal distribution: the mean (μ) and the standard deviation (σ). The symbols e and π are mathematical constants. Seven features of normal distributions are listed below: 1. Normal distributions are symmetric around their mean. 2. The mean, median, and mode of a normal distribution are equal. 3. The area under the normal curve is equal to 1. 4. Normal distributions are denser in the center and less dense in the tails. 5. Normal distributions are defined by two parameters, the mean (μ) and the standard deviation (σ). 6. 68% of the area of a normal distribution is within one standard deviation of the mean. 7. Approximately 95% of the area of a normal distribution is within two standard deviations of the mean. 22. Question The graph below shows the graphs of several normal distributions, labeled A, B, and C, on the same axis. Determine which normal distribution has the smallest standard deviation. 23. Question An obstetrician is researching postpartum programs for new mothers. From recent census data, it is known that the proportion of women in the United States who are of child bearing age is 17%. For a random sample of size 250, what is standard deviation for the sampling distribution of the sample proportions, rounded to three decimal places? Given the population proportion p=17%=0.17 and a sample size of n=250, the standard deviation of the sampling distribution of sample proportions is 24. Question A youth director for a city's parks and recreations department is planning for next year's program. From a a survey of city residents, the director knows that 35% of the population participate in the parks and recreations programs. For a random sample of 40 people, what is standard deviation for the sampling distribution of the sample proportions, rounded to three decimal places? Given the population proportion p=35%=0.35 and a sample size of n=40, the standard deviation of the sampling distribution of sample proportions is 25. From recent survey data, its known that the proportion of adults in the United States who are smokers is 18%. For a random sample of size 150, what is standard deviation for the sampling distribution of the sample proportions. Given the population proportion p=18%=0.18 and a sample size of n=150, the standard deviation of the sampling distribution of sample proportions is 26. A small community college has a population of 986 students, 252 of whom them are considered non-traditional students. Find the population proportion, as well as the mean and standard deviation of the sampling distribution for samples of size n=40. The population proportion. This is also the mean of the sampling distribution: For samples of size n=40, the standard deviation of the sampling distribution is 27. Economists are analyzing the effects of new tax policies on population growth. From recent census data, it is known that the proportion of families in the United States who have more than 3 children in the household is 26%. For a random sample of 50 families, what is the standard deviation for the sampling distribution of the sample proportions, rounded to three decimal places? Given the population proportion p=26%=0.26 and a sample size of n=50, the standard deviation of the sampling distribution of sample proportions is 28. Question Of the 459,000 people living in Miami, 68%indicated on a recent, city-wide survey that they were employed . For a random sample of size 490 people, what is standard deviation for the sampling distribution of the sample proportions, rounded to three decimal places? Given the population proportion p=68%=0.68 and a sample size of n=490, the standard deviation of the sampling distribution of sample proportions is 29. Question The graph below shows the graphs of several normal distributions, labeled A, B, and C, on the same axis. Determine which normal distribution has the smallest mean. A curve labeled A rises to a maximum near the left of the horizontal axis and falls, a curve labeled B rises to a maximum near the right of the horizontal axis and falls, a curve labeled C rises to a maximum near the center of the horizontal axis and falls. The distribution that is farthest to the left is A, so that has the smallest mean. 31. Question A credit card company surveys its customers to determine the number of times they use the card each month. There are 5,500 customers and 2,756 indicate that they use the card at least twice each month. Find the population proportion, as well as the mean and standard deviation of the sampling distribution for samples of size n=70 customers. The population proportion is p=2,7565,500≈. This is also the mean of the sampling distribution: For samples of size n=70, the standard deviation of the sampling distribution is 32. Question A horse racing track knows that the proportion of its gamblers that report winning is 15%. For a random sample of 64 gamblers, what is standard deviation for the sampling distribution of the sample proportions, rounded to three decimal places? Given the population proportion p=15%=0.15 and a sample size of n=64, the standard deviation of the sampling distribution of sample proportions is 33. Question Of the 13,500 savings accounts in a bank, 4,675 belong to people younger than 40 years old. The bank president would like to increase her institution's marketing strategy to younger customers, so she is examining the population proportions in order to create a statistical study. Find the population proportion, as well as the mean and standard deviation of the sampling distribution for samples of size n=400. The population proportion is p=4,675/13,500≈0.346. This is also the mean of the sampling distribution: For samples of size n=400, the standard deviation of the sampling distribution is 34. A baseball team calls itself "America's Favorite Team," because it has 90,000 fans on social media out of 2,210,000 social media users. Find the population proportion, as well as the mean and standard deviation of the sampling distribution for samples of size n=1,000. Round all answers to 3 decimal places. The population proportion is p=90,000/2,210,000≈0.041. This is also the mean of the sampling distribution: For samples of size n=1,000, the standard deviation of the sampling distribution is 35. Question A study by doctors of children attending a certain elementary school finds that, of 812 students, 245 watch more than 2 hours of television each day. Find the population proportion, as well as the mean and standard deviation of the sampling distribution for samples of size n=100 students. Round all answers to 3 decimal places. The population proportion is p=245812≈0.302 . This is also the mean of the sampling distribution: For samples of size n=100 , the standard deviation of the sampling distribution is 36. Pharmacy technicians are concerned about the rising number of fraudulent prescriptions they are seeing. A small pharmacy sees 1,500 new prescriptions a month, 28 of which are fraudulent. Find the population proportion, as well as the mean and standard deviation of the sampling distribution for samples of size n=180. Round all answers to 3 decimal places. The population proportion is p=281,500≈. This is also the mean of the sampling distribution: For samples of size n=180, the standard deviation of the sampling distribution is 37. A dental student is conducting a study on the number of people who visit their dentist regularly. Of the 520 people surveyed, 312 indicated that they had visited their dentist within the past year. Find the population proportion, as well as the mean and standard deviation of the sampling distribution for samples of size n=60. The population proportion is p=312520≈0.600. This is also the mean of the sampling distribution: For samples of size n=60, the standard deviation of the sampling distribution is 38. From recent survey data, its known that the proportion of adults in the United States who are smokers is 18%. For a random sample of size 150, what is standard deviation for the sampling distribution of the sample proportions, rounded to three decimal places? [Show More]
Last updated: 1 year ago
Preview 1 out of 21 pages
Reviews( 0 )
Document information
Connected school, study & course
About the document
Uploaded On
Apr 27, 2020
Number of pages
21
Written in

Additional information
This document has been written for:
Uploaded
Apr 27, 2020
Downloads
0
Views
143