Programming > QUESTIONS & ANSWERS > University of California, Berkeley DATA MISC Homework 9: Central Limit Theorem (All)
University of California, Berkeley DATA MISC Homework 9: Central Limit Theorem
Document Content and Description Below
University of California, Berkeley DATA MISC 1 Homework 9: Central Limit Theorem Reading: * Why the mean matters Please complete this notebook by filling in the cells provided. Before you begi... n, execute the following cell to load the provided tests. Each time you start your server, you will need to execute this cell again to load the tests. Homework 9 is due Thursday, 11/1 at 11:59pm. You will receive an early submission bonus point if you turn in your final submission by Wednesday, 10/31 at 11:59pm. Start early so that you can come to office hours if you’re stuck. Check the website for the office hours schedule. Late work will not be accepted as per the policies of this course. Directly sharing answers is not okay, but discussing problems with the course staff or with other students is encouraged. Refer to the policies page to learn more about how to learn cooperatively. For all problems that you must write our explanations and sentences for, you must provide your answer in the designated space. Moreover, throughout this homework and all future ones, please be sure to not re-assign variables throughout the notebook! For example, if you use max_temperature in your answer to one question, do not reassign it later on. In [1]: # Don't change this cell; just run it. import numpy as np from datascience import * # These lines do some fancy plotting magic. import matplotlib %matplotlib inline import matplotlib.pyplot as plt plt.style.use('fivethirtyeight') import warnings warnings.simplefilter('ignore', FutureWarning) from client.api.notebook import Notebook ok = Notebook('hw09.ok') _ = ok.auth(inline=True) ===================================================================== Assignment: Homework 9: Central Limit Theorem 1 OK, version v1.12.5 ===================================================================== Successfully logged in as [email protected] 1.1 1. The Bootstrap and The Normal Curve In this exercise, we will explore a dataset that includes the safety inspection scores for restaurants in the city of Austin, Texas. We will be interested in determining the average restaurant score for the city from a random sample of the scores; the average restaurant score is out of 100. We’ll compare two methods for computing a confidence interval for that quantity: the bootstrap resampling method, and an approximation based on the Central Limit Theorem. In [2]: # Just run this cell. pop_restaurants = Table.read_table('restaurant_inspection_scores.csv').drop(5,6) pop_restaurants Often it is impossible to find complete datasets like this. Imagine we instead had access only to a random sample of 100 restaurant inspections, called restaurant_sample. That table is created below. We are interested in using this sample to estimate the population mean. Question 3 Complete the function bootstrap_scores below. It should take no arguments. It should simulate drawing 5000 resamples from restaurant_sample and computing the mean restaurant score in each resample. It should return an array of those 5000 resample means. In [8]: def bootstrap_scores(): resampled_means = make_array() for i in range(5000): resampled_mean = np.mean(restaurant_sample.sample().column(3)) resampled_means = np.append(resampled_means, resampled_mean) return resampled_means resampled_means = bootstrap_scores() resampled_means Question 4 Compute a 95 percent confidence interval for the average restaurant score using the array resampled_means. In [11]: lower_bound = percentile(2.5, resampled_means) upper_bound = percentile(97.5, resampled_means) print("95% confidence interval for the average restaurant score, computed by bootstrap 95% confidence interval for the average restaurant score, computed by bootstrapping: ( 90.98 , 93.56 ) Question 5 Does the distribution of the resampled mean scores look normally distributed? State "yes" or "no" and describe in one sentence why you would expect that result. Yes, since the central limit theorem states that the distribution of sample averages tend to be normally distributed 6 Question 6 Does the distribution of the sampled scores look normally distributed? State "yes" or "no" and describe in one sentence why you should expect this result. Hint: Remember that we are no longer talking about the resampled means! No, since the sampled scores are distributed like the population scores , and the population scores are not normally distributed. For the last question, you’ll need to recall two facts. 1. If a group of numbers has a normal distribution, around 95% of them lie within 2 standard deviations of their mean. 2. The Central Limit Theorem tells us the quantitative relationship between the following: * the standard deviation of an array of numbers. * the standard deviation of an array of means of samples taken from those numbers. Question 7 Without referencing the array resampled_means or performing any new simulations, calculate an interval around the sample_mean that covers approximately 95% of the numbers in the resampled_means array. You may use the following values to compute your result, but you should not perform additional resampling - think about how you can use the CLT to accomplish this. In [12]: sample_mean = np.mean(restaurant_sample.column(3)) sample_sd = np.std(restaurant_sample.column(3)) sample_size = restaurant_sample.num_rows mean_sd = sample_sd / sample_size**0.5 lower_bound_normal = sample_mean - 2 * mean_sd upper_bound_normal = sample_mean + 2 * mean_sd print("95% confidence interval for the average restaurant score, computed by a normal 95% confidence interval for the average restaurant score, computed by a normal approximation: ( 90.9258714979737 , 93.6341285020263 ) This confidence interval should look very similar to the one you computed in Question 4. 1.2 2. Testing the Central Limit Theorem The Central Limit Theorem tells us that the probability distribution of the sum or average of a large random sample drawn with replacement will be roughly normal, regardless of the distribution of the population from which the sample is drawn. That’s a pretty big claim, but the theorem doesn’t stop there. It further states that the standard deviation of this normal distribution is given by sd of the original distribution psample size In other words, suppose we start with any distribution that has standard deviation x, take a sample of size n (where n is a large number) from that distribution with replacement, and compute the mean of that sample. If we repeat this procedure many times, then those sample means will have a normal distribution with standard deviation pxn. That’s an even bigger claim than the first one! The proof of the theorem is beyond the scope of this class, but in this exercise, we will be exploring some data to see the CLT in action. [Show More]
Last updated: 1 year ago
Preview 1 out of 32 pages
Reviews( 0 )
Recommended For You
Artificial Intelligence> QUESTIONS & ANSWERS > University of California, Berkeley COMPSCI 188. Introduction To Artificial Intelligence Homework 7_Electronic Component. BY gradescope.com/courses. TOTAL POINTS 100 / 100 pts (All)
University of California, Berkeley COMPSCI 188. Introduction To Artificial Intelligence Homework 7_Electronic Component. BY gradescope.com/courses. TOTAL POINTS 100 / 100 pts
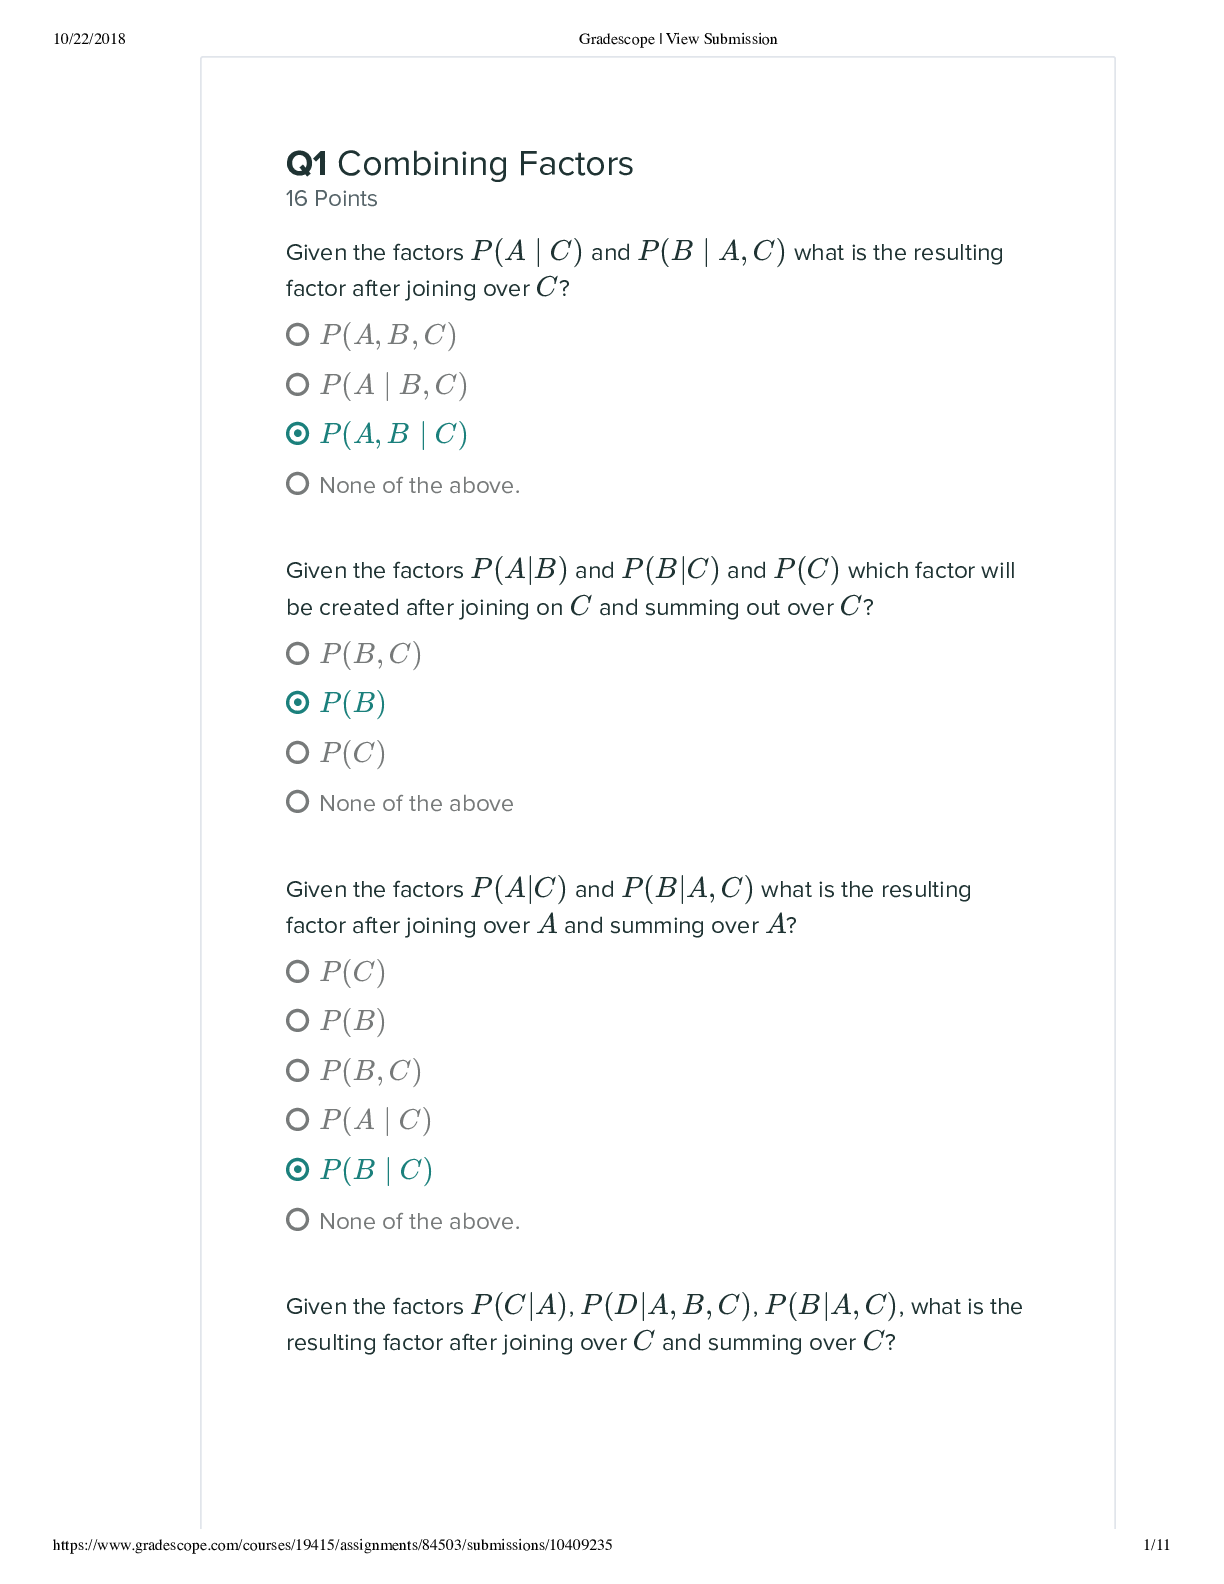
Gradescope | View Submission https://www.gradescope.com/courses/19415/assignments/84503/submissions/10409235 1/11 Q1 Combining Factors 16 Points Given the factors and what is the resulting factor...
By QuizMaster , Uploaded: Aug 11, 2022
$9
Economics> QUESTIONS & ANSWERS > University of California, Berkeley ECON 119 Econ119+f14+PS1+solutions (All)
University of California, Berkeley ECON 119 Econ119+f14+PS1+solutions
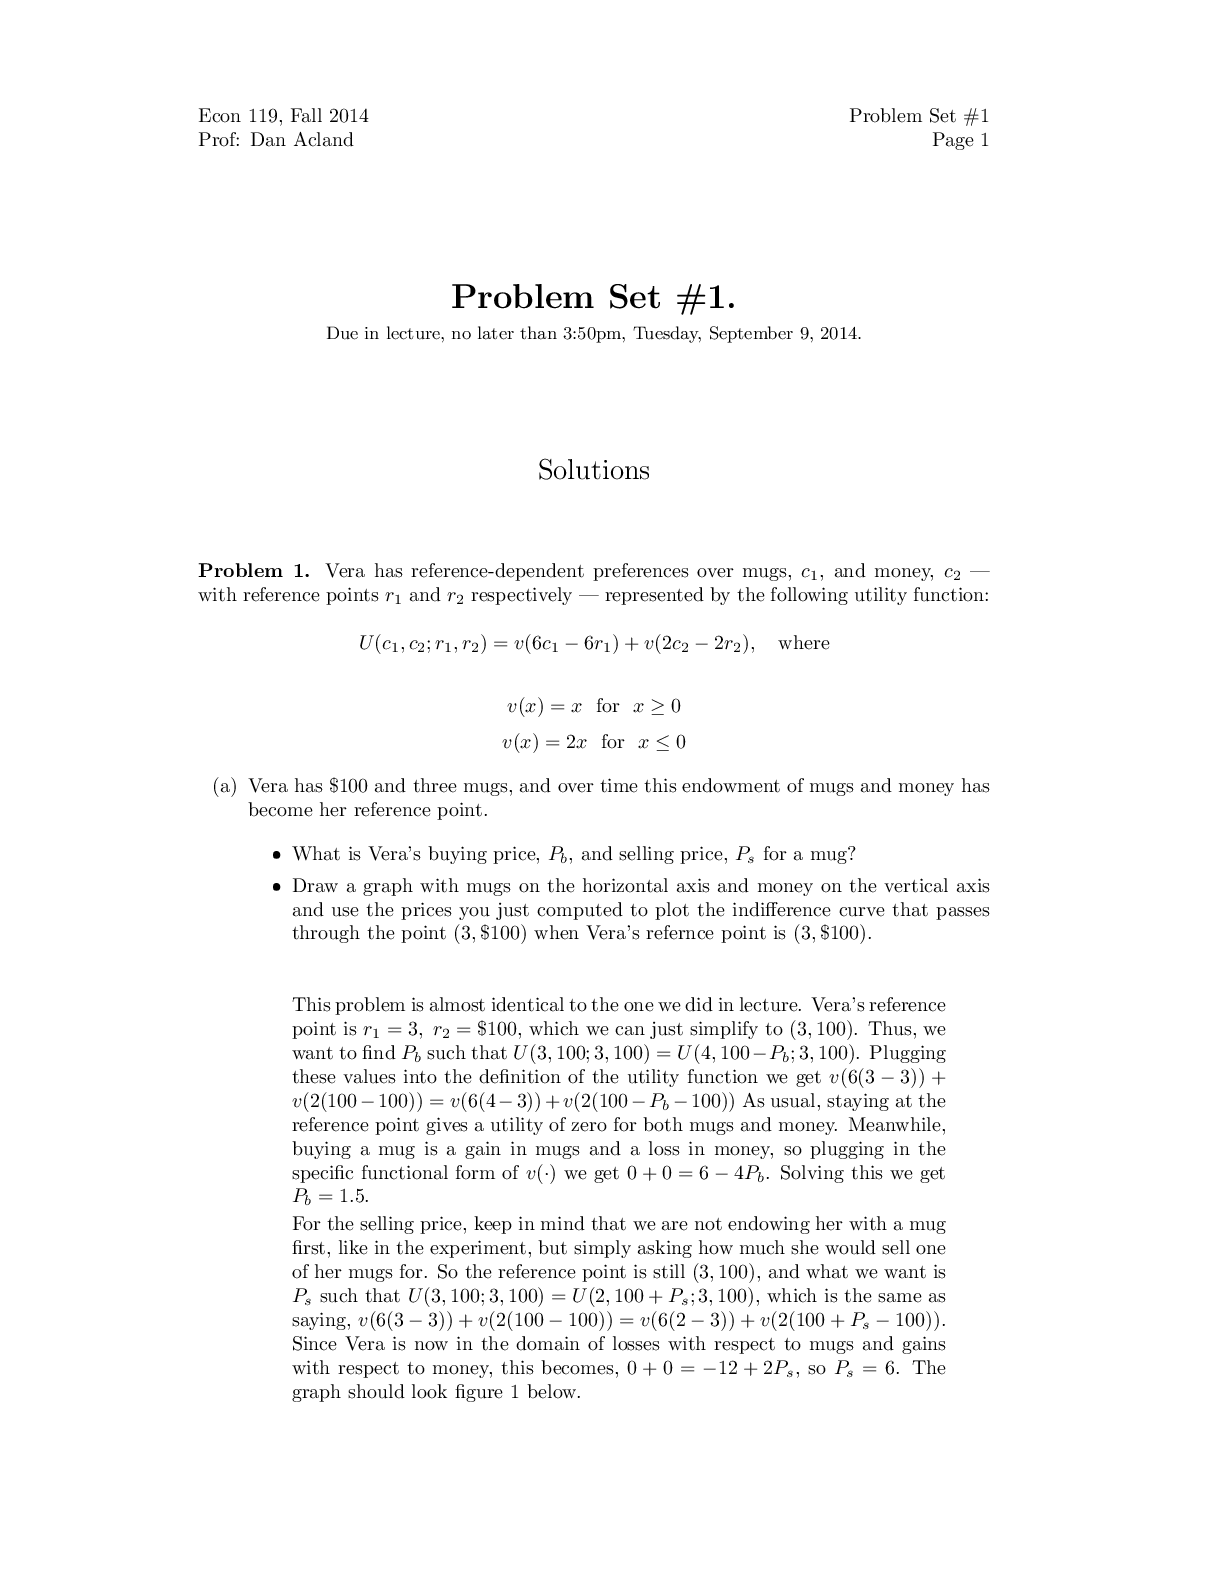
Problem Set #1. Due in lecture, no later than 3:50pm, Tuesday, September 9, 2014. Solutions Problem 1. Vera has reference-dependent preferences over mugs, c1, and money, c2 — with reference points...
By d.occ , Uploaded: Sep 19, 2021
$9
Computer Science> QUESTIONS & ANSWERS > University of California, Berkeley CS 61C61C HW5 (All)
University of California, Berkeley CS 61C61C HW5
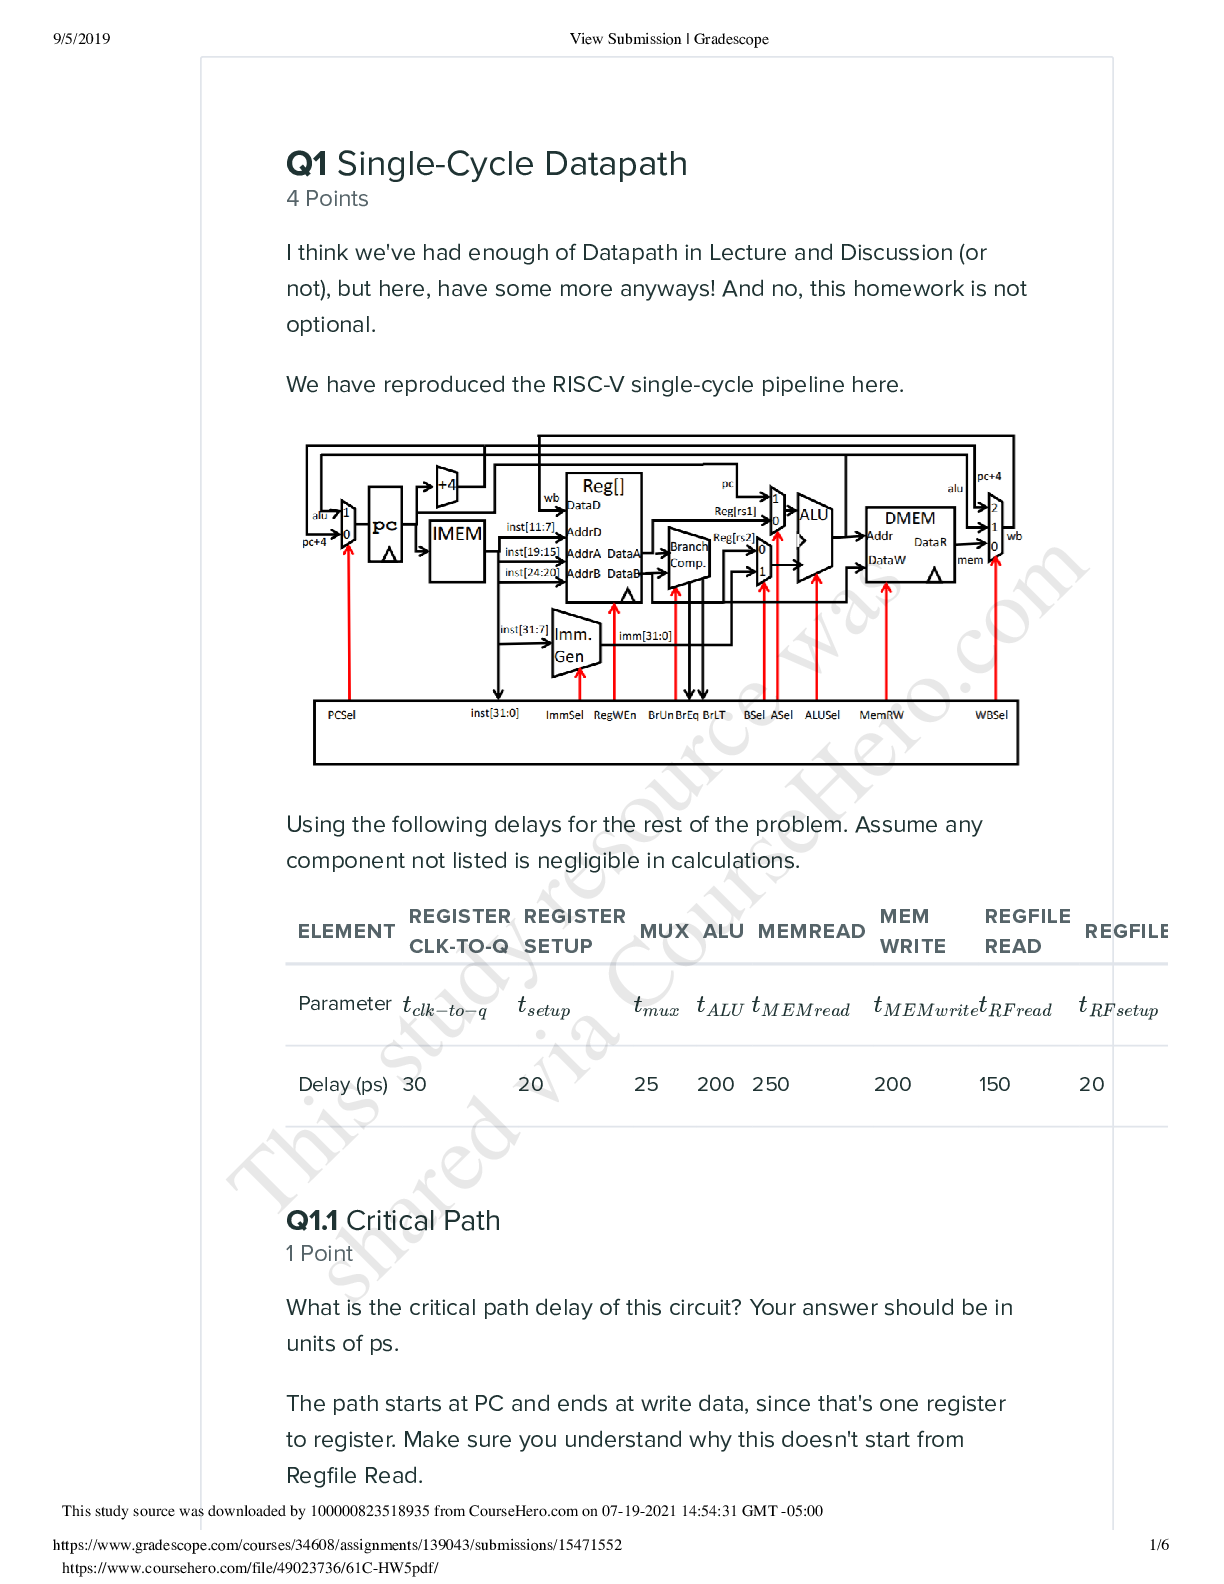
Q1 Single-Cycle Datapath 4 Points I think we've had enough of Datapath in Lecture and Discussion (or not), but here, have some more anyways! And no, this homework is not optional. We have reprodu...
By Cheryshev , Uploaded: Jul 20, 2021
$11
Computer Science> QUESTIONS & ANSWERS > University of California, Berkeley DS 100 sp18_hw2_solution.ipynb at master DS-100_sp18 GitHub (All)
University of California, Berkeley DS 100 sp18_hw2_solution.ipynb at master DS-100_sp18 GitHub
Homework 2: Food Safety Course Policies Here are some important course policies. These are also located at http://www.ds100.org/sp18/ (http://www.ds100.org/sp18/). Collaboration Policy Data scienc...
By d.occ , Uploaded: Jul 04, 2021
$13
Physics> QUESTIONS & ANSWERS > University of California, Berkeley PHYSICS 7Ahw01 (All)
University of California, Berkeley PHYSICS 7Ahw01
PROBLEM (1.23) GIVEN: The diameter of the moon is d moon = 3480 km, and Earth’s diameter is d Earth = 12760 km. GOAL: Find (a) the surface area As of the moon and (b) the ratio of the Earth’s and...
By Expert Tutor , Uploaded: May 16, 2021
$10
Electrical Engineering> QUESTIONS & ANSWERS > University of California, Berkeley - EECS 126hw12-sol (All)
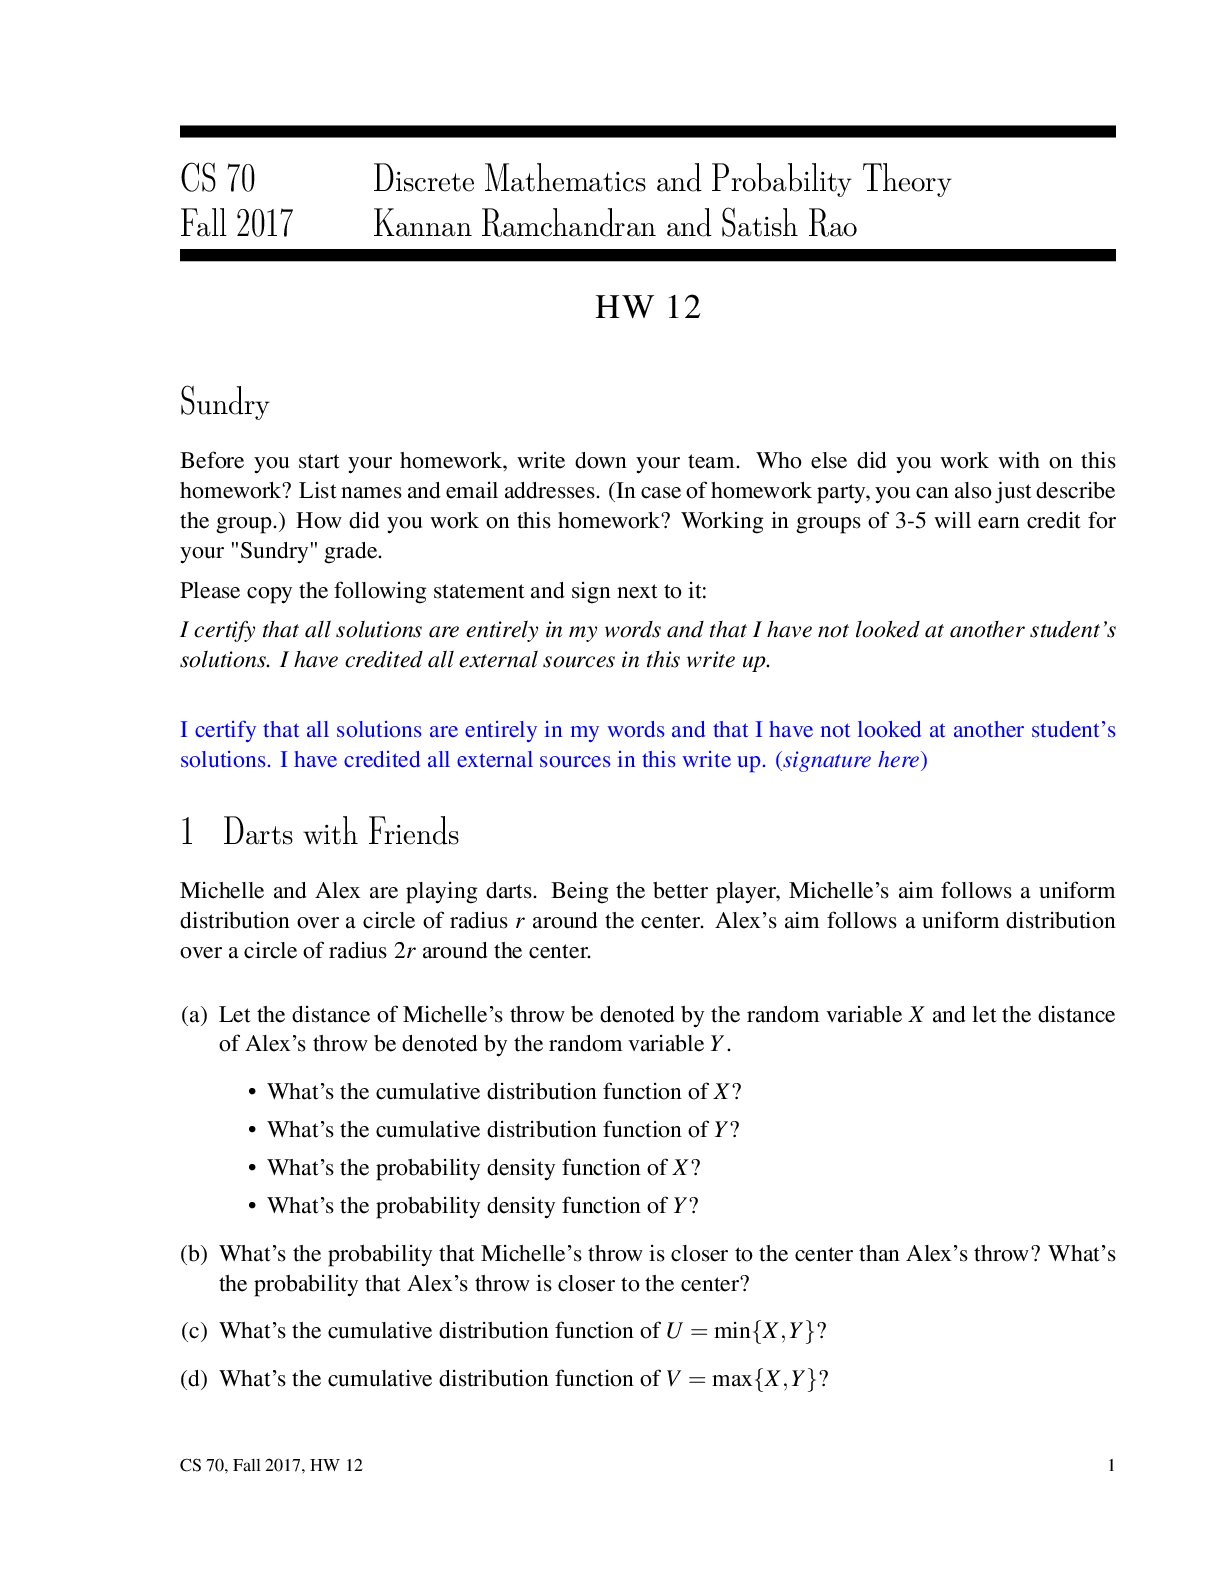
University of California, Berkeley - EECS 126hw12-sol
Department of Electrical Engineering and Computer Sciences EECS 126: Probability and Random Processes Problem Set 12 Spring 2018 Self-Graded Scores Due: 5 PM, Friday May 4, 2018 Submit your self-...
By AGRADES , Uploaded: Apr 17, 2021
$6
Electrical Engineering> QUESTIONS & ANSWERS > University of California, Berkeley - EECS 126hw11-sol. (All)
University of California, Berkeley - EECS 126hw11-sol.
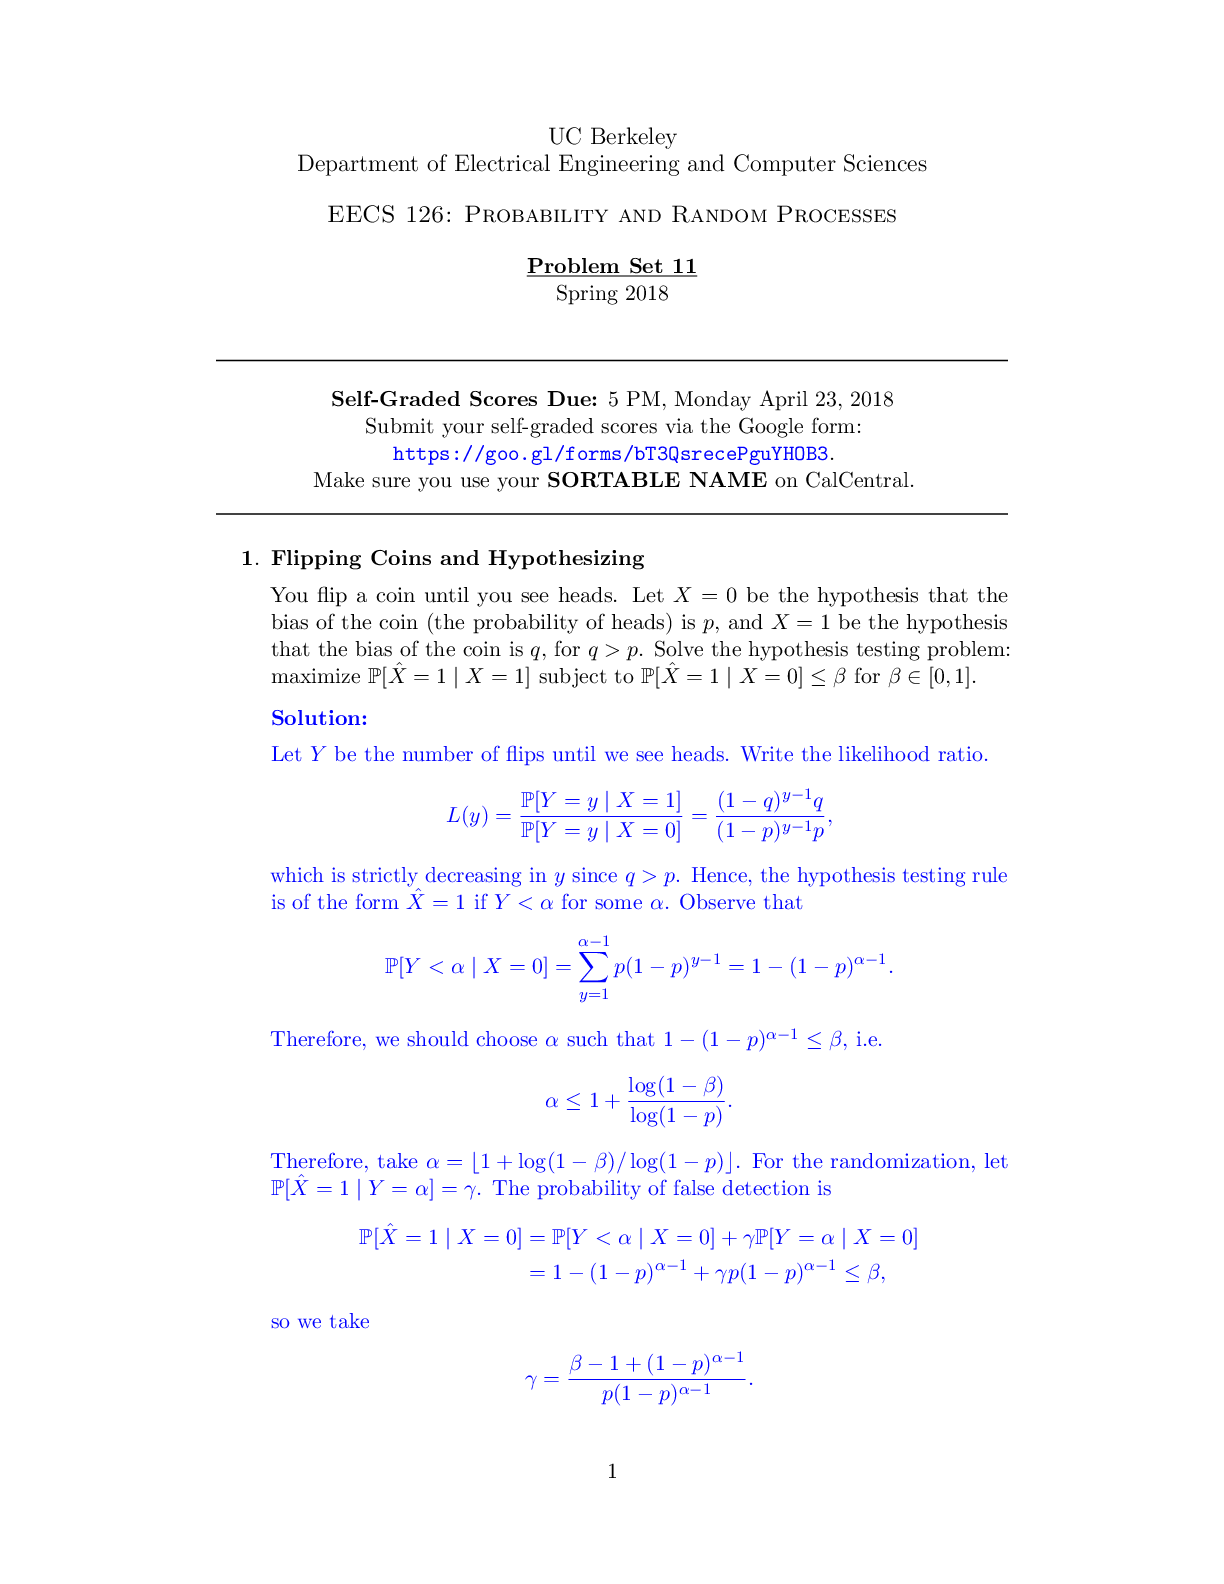
UC Berkeley Department of Electrical Engineering and Computer Sciences EECS 126: Probability and Random Processes Problem Set 11 Spring 2018 Self-Graded Scores Due: 5 PM, Monday April 23, 2018 S...
By AGRADES , Uploaded: Apr 17, 2021
$6
Electrical Engineering> QUESTIONS & ANSWERS > University of California, Berkeley - EECS 126dis12-sol (All)
University of California, Berkeley - EECS 126dis12-sol
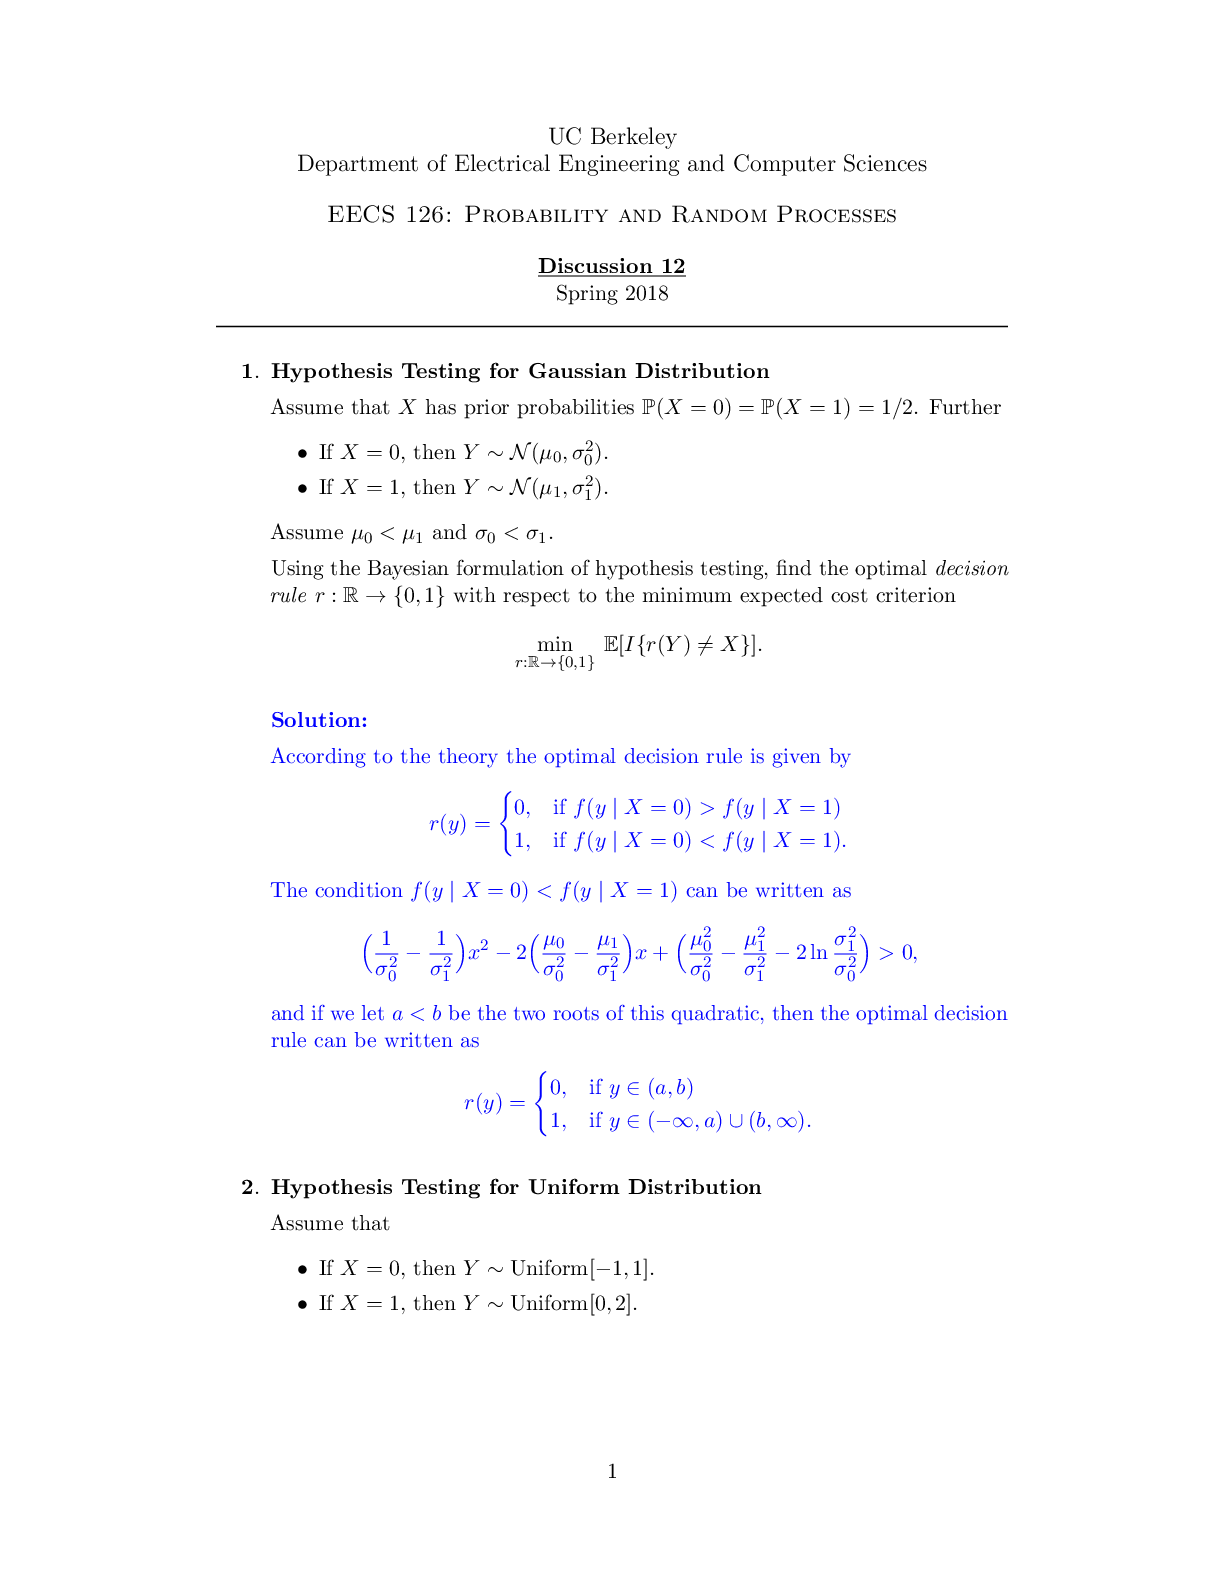
UC Berkeley Department of Electrical Engineering and Computer Sciences EECS 126: Probability and Random Processes Discussion 12 Spring 2018 1. Hypothesis Testing for Gaussian Distribution Assume...
By AGRADES , Uploaded: Apr 17, 2021
$4
Mathematics> QUESTIONS & ANSWERS > University of California, Berkeley - CS 70 hw13-solution. CS 70 Discrete Mathematics and Probability Theory Spring 2019 . All Solutions Worked. (All)
University of California, Berkeley - CS 70 hw13-solution. CS 70 Discrete Mathematics and Probability Theory Spring 2019 . All Solutions Worked.
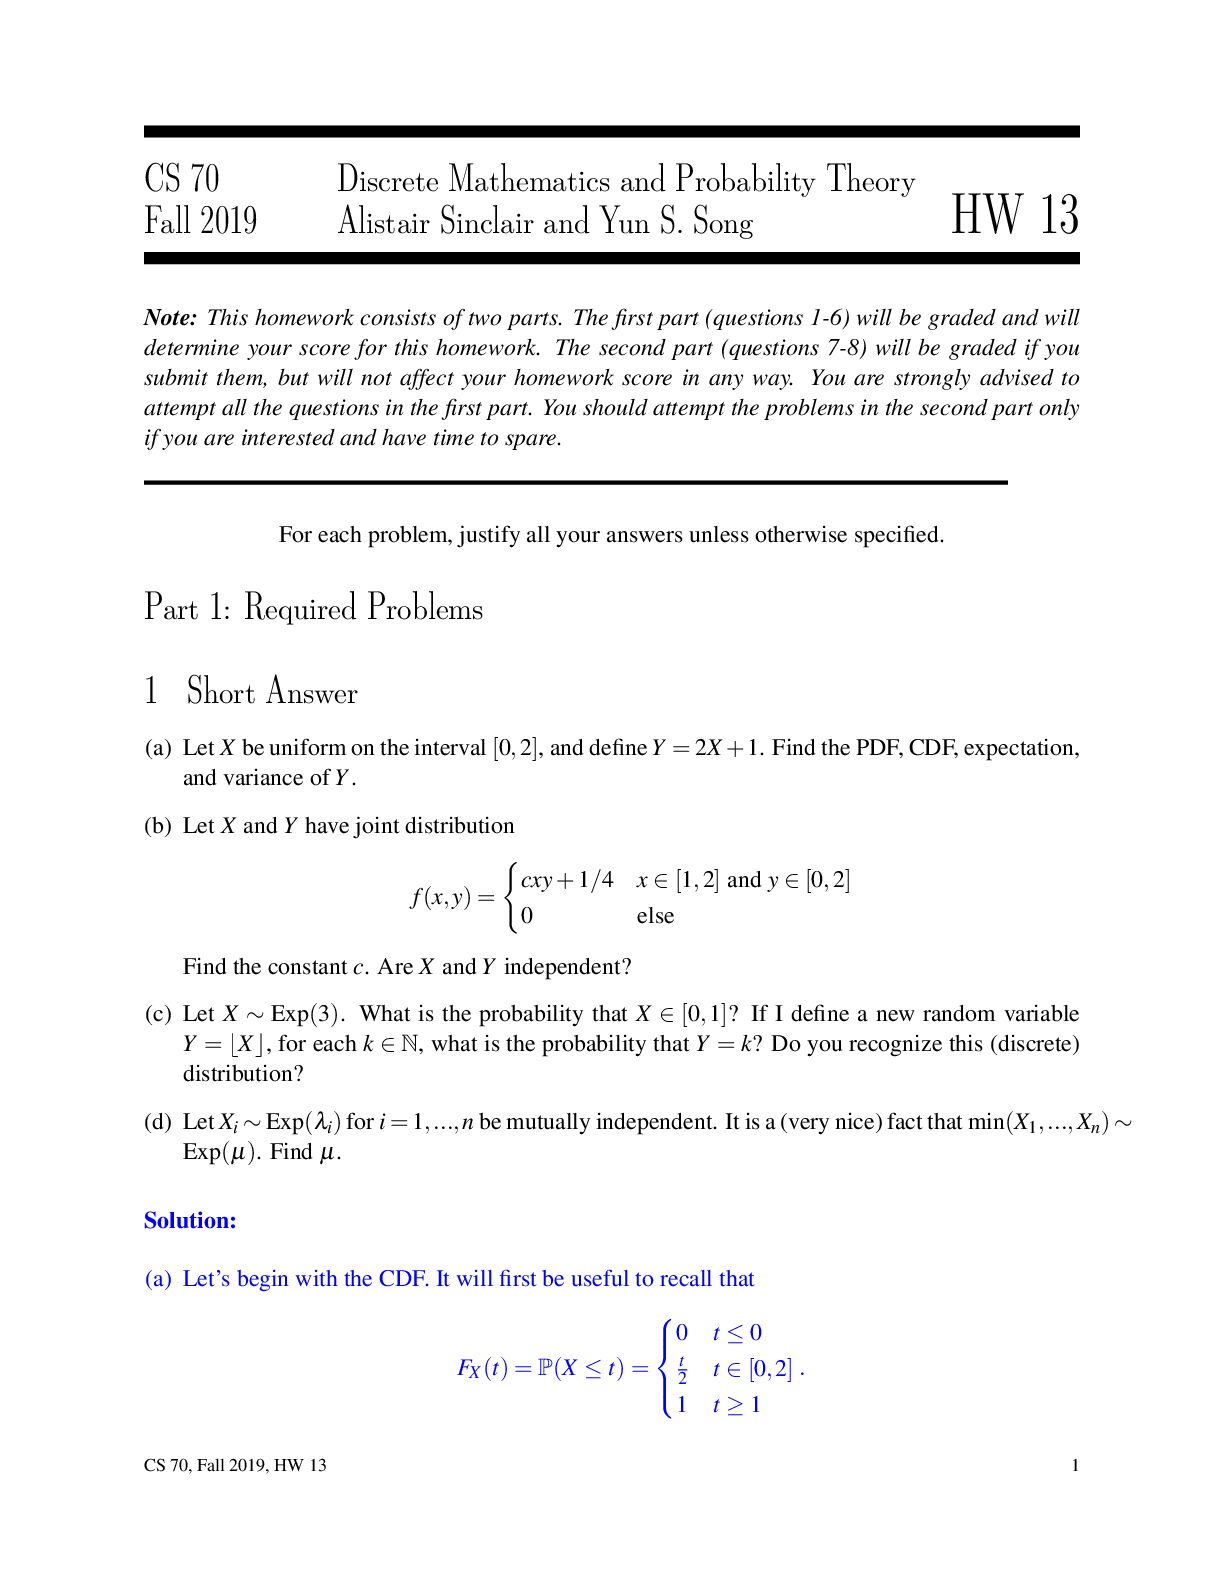
CS 70 Discrete Mathematics and Probability Theory Spring 2019 Babak Ayazifar and Satish Rao HW 13 1 Markov’s Inequality and Chebyshev’s Inequality A random variable X has variance var(X) = 9 and ex...
By Kirsch , Uploaded: Apr 16, 2021
$13
Mathematics> QUESTIONS & ANSWERS > Questions and Answers > University of California, Berkeley - CS 70 hw11-solution. CS 70 Discrete Mathematics and Probability Theory Fall 2019. All Solutions Worked. (All)
Questions and Answers > University of California, Berkeley - CS 70 hw11-solution. CS 70 Discrete Mathematics and Probability Theory Fall 2019. All Solutions Worked.
CS 70 Discrete Mathematics and Probability Theory Fall 2019 Alistair Sinclair and Yun S. Song HW 11 Note: This homework consists of two parts. The first part (questions 1-4) will be graded and will...
By Kirsch , Uploaded: Apr 16, 2021
$13
Document information
Connected school, study & course
About the document
Uploaded On
Oct 02, 2022
Number of pages
32
Written in

Additional information
This document has been written for:
Uploaded
Oct 02, 2022
Downloads
0
Views
41