WPC 300 Final Exam Questions & Answers Complete, A+ Guide
Document Content and Description Below
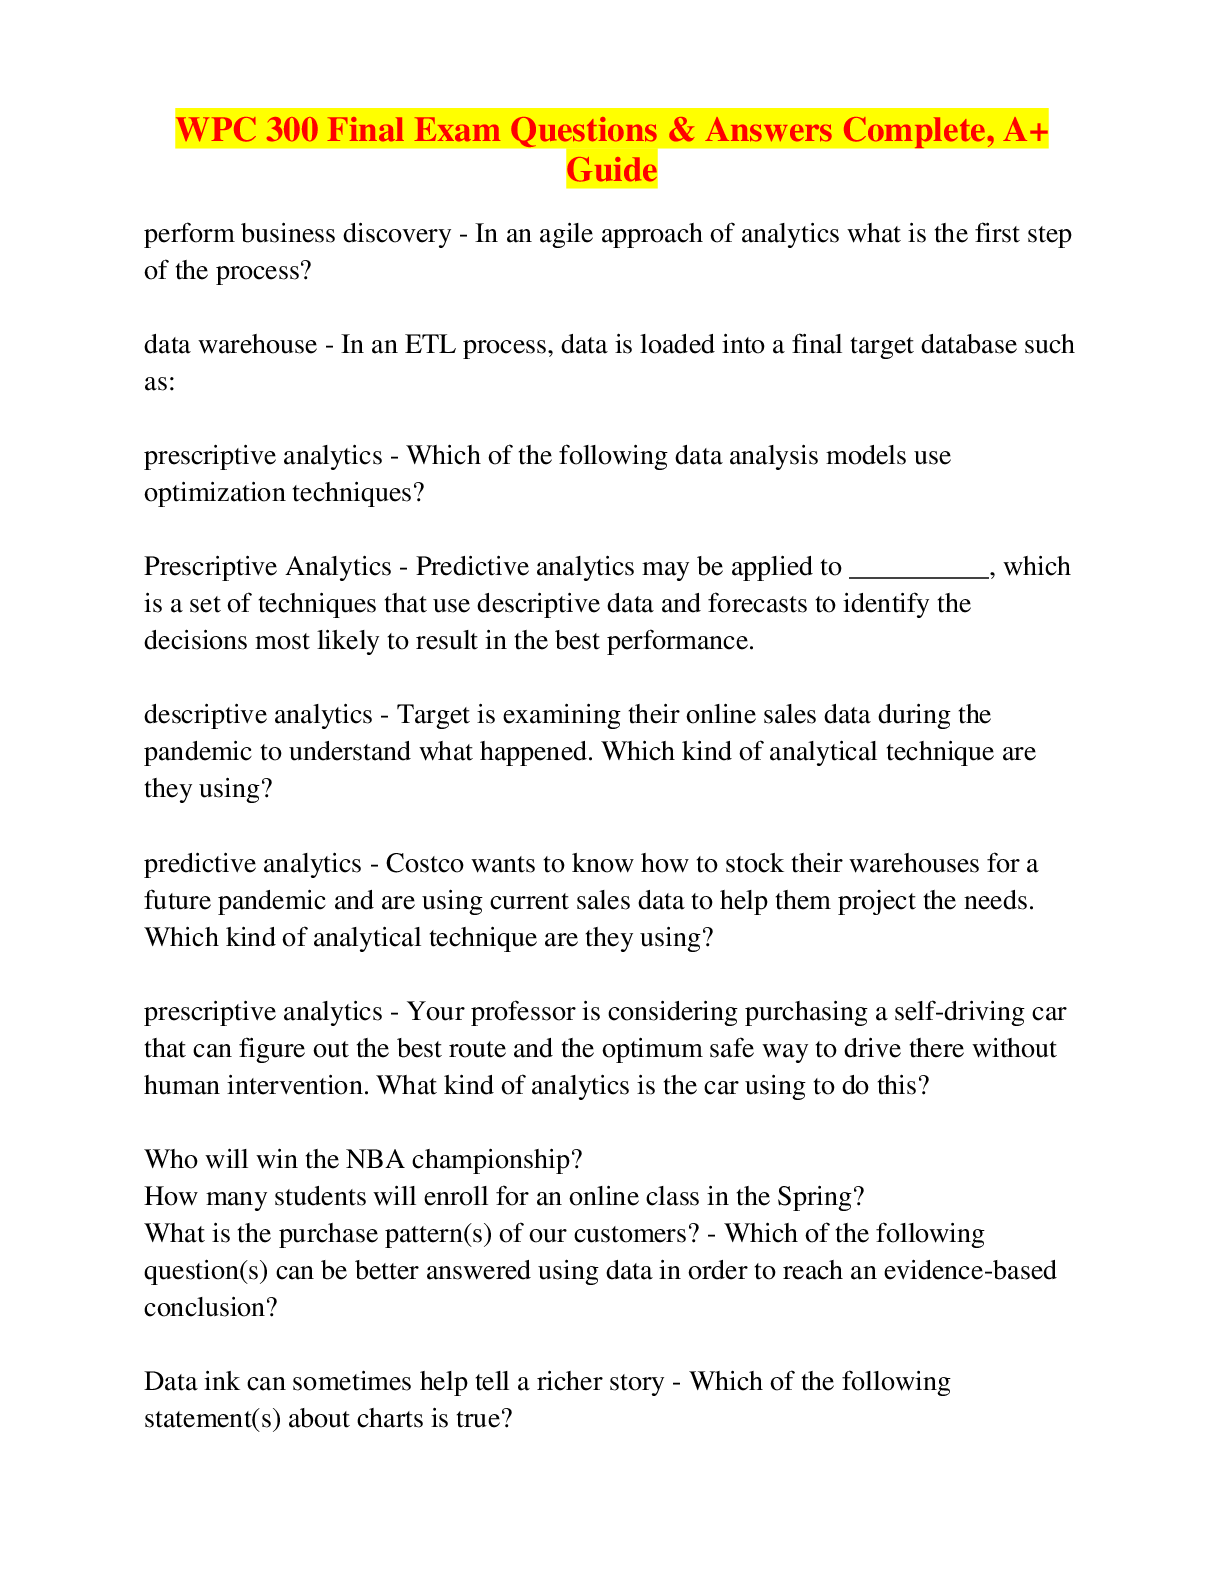
WPC 300 Final Exam Questions & Answers Complete, A+ Guide-perform business discovery - In an agile approach of analytics what is the first step of the process? data warehouse - In an ETL process, d... ata is loaded into a final target database such as: prescriptive analytics - Which of the following data analysis models use optimization techniques? Prescriptive Analytics - Predictive analytics may be applied to __________, which is a set of techniques that use descriptive data and forecasts to identify the decisions most likely to result in the best performance. descriptive analytics - Target is examining their online sales data during the pandemic to understand what happened. Which kind of analytical technique are they using? predictive analytics - Costco wants to know how to stock their warehouses for a future pandemic and are using current sales data to help them project the needs. Which kind of analytical technique are they using? prescriptive analytics - Your professor is considering purchasing a self-driving car that can figure out the best route and the optimum safe way to drive there without human intervention. What kind of analytics is the car using to do this? Who will win the NBA championship? How many students will enroll for an online class in the Spring? What is the purchase pattern(s) of our customers? - Which of the following question(s) can be better answered using data in order to reach an evidence-based conclusion? Data ink can sometimes help tell a richer story - Which of the following statement(s) about charts is true? The data-ink ratio should be higher than 1 - Which of the following violates the principle of data visualization? close to 1 - In for a chart to minimize graphical complexity, the data-ink ratio must be: Tables cannot easily show trends - Which of the following statements is a reason not to use a table for data visualization? the size of the effect shown in the [Show More]
Last updated: 1 year ago
Preview 1 out of 11 pages
Instant download
Buy this document to get the full access instantly
Instant Download Access after purchase
Add to cartInstant download
Reviews( 0 )
Document information
Connected school, study & course
About the document
Uploaded On
May 03, 2023
Number of pages
11
Written in

Additional information
This document has been written for:
Uploaded
May 03, 2023
Downloads
0
Views
27