Mathematics > QUESTIONS & ANSWERS > MATH 225N Week 4 Statistics Quiz Solutions: Fall 2020/2021 - Attempt Score : A+ (All)
MATH 225N Week 4 Statistics Quiz Solutions: Fall 2020/2021 - Attempt Score : A+
Document Content and Description Below
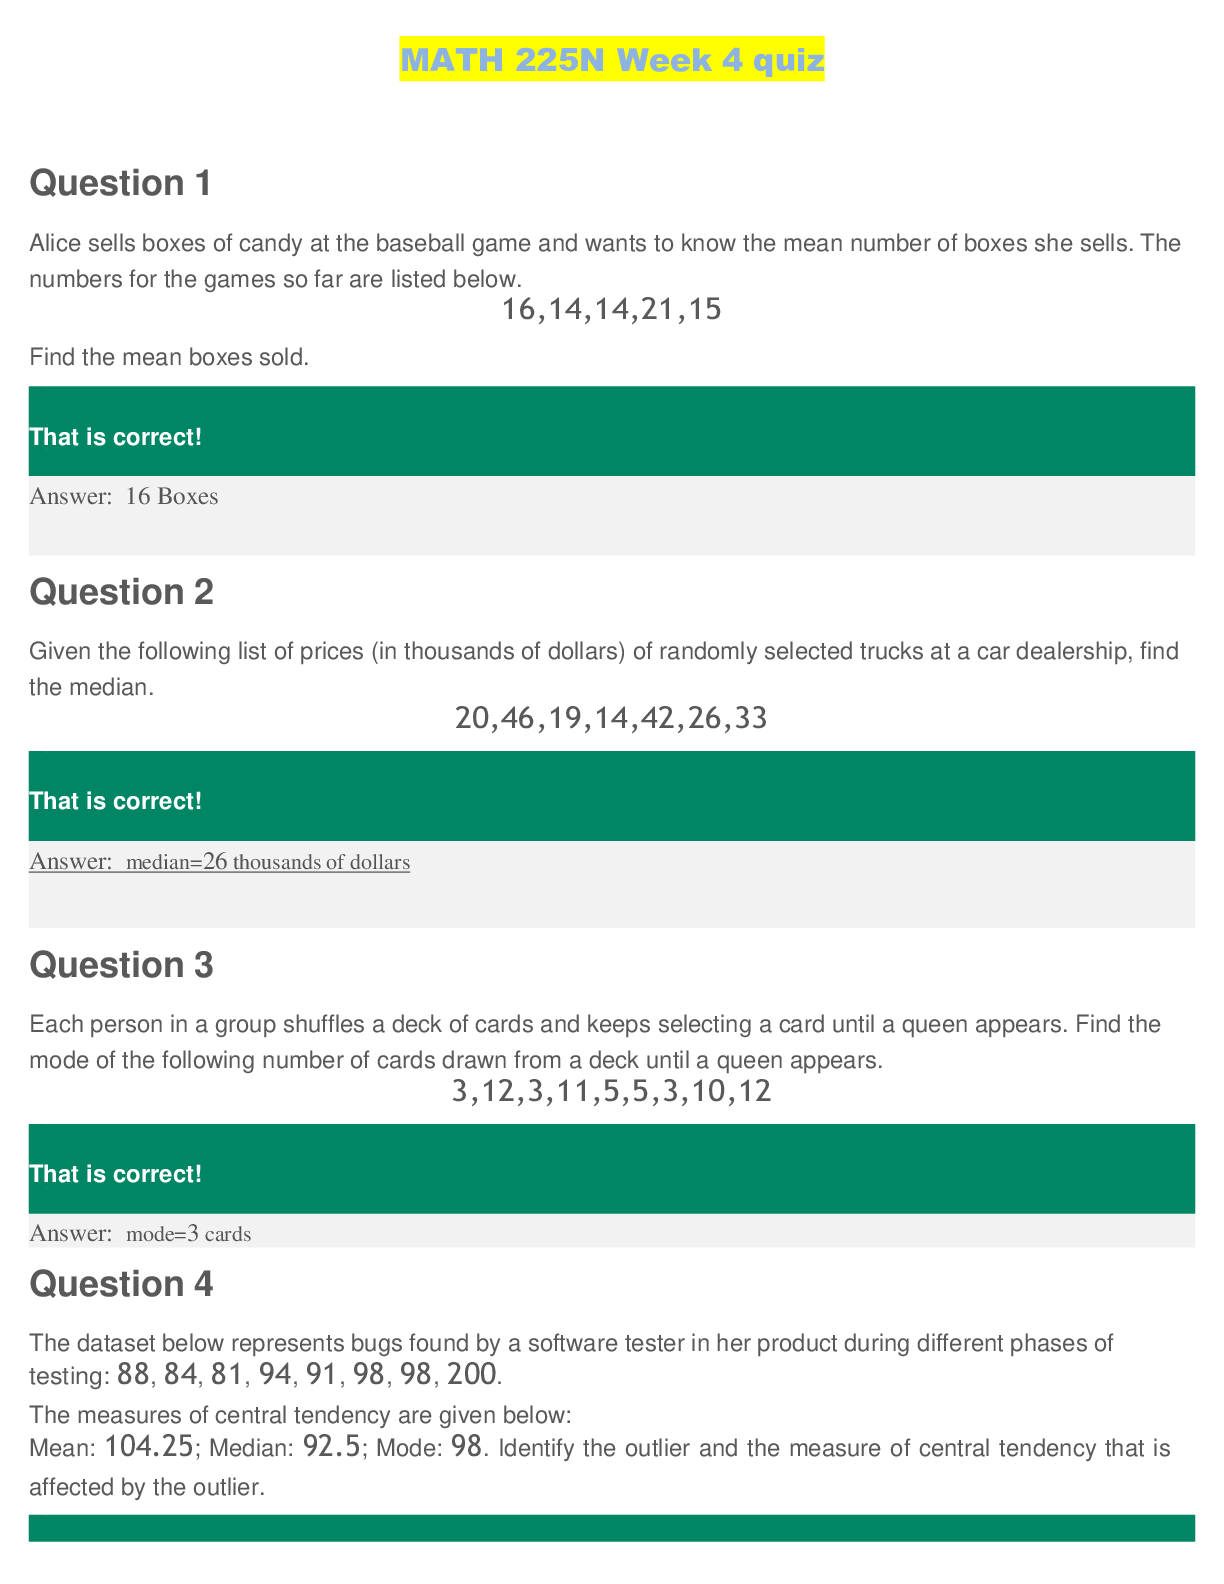
Question 1 Alice sells boxes of candy at the baseball game and wants to know the mean number of boxes she sells. The numbers for the games so far are listed below. 16,14,14,21,15 Find the mean box... es sold. Question 2 Given the following list of prices (in thousands of dollars) of randomly selected trucks at a car dealership, find the median. 20,46,19,14,42,26,33 Question 3 Each person in a group shuffles a deck of cards and keeps selecting a card until a queen appears. Find the mode of the following number of cards drawn from a deck until a queen appears. 3,12,3,11,5,5,3,10,12 Question 4 The dataset below represents bugs found by a software tester in her product during different phases of testing: 88, 84, 81, 94, 91, 98, 98, 200. The measures of central tendency are given below: Mean: 104.25; Median: 92.5; Mode: 98. Identify the outlier and the measure of central tendency that is affected by the outlier. A bar graph has a horizontal axis titled Values labeled from 2 to 18 in increments of 2 and a vertical axis titled Frequency labeled from 0 to 200 in increments of 50. 14 bars are plotted, above the numbers 2 to 16. From left to right, the heights of the bars are as follows: 1. 5. 10. 40, 75, 125, 190, 180, 130, 125, 60, 25,20, 10. All values are approximate. [Show More]
Last updated: 1 year ago
Preview 1 out of 11 pages
Reviews( 0 )
Document information
Connected school, study & course
About the document
Uploaded On
Jul 22, 2022
Number of pages
11
Written in

Additional information
This document has been written for:
Uploaded
Jul 22, 2022
Downloads
0
Views
38