Statistics > SOLUTIONS MANUAL > Hypothesis Testing for One Sample (All)
Hypothesis Testing for One Sample
Document Content and Description Below
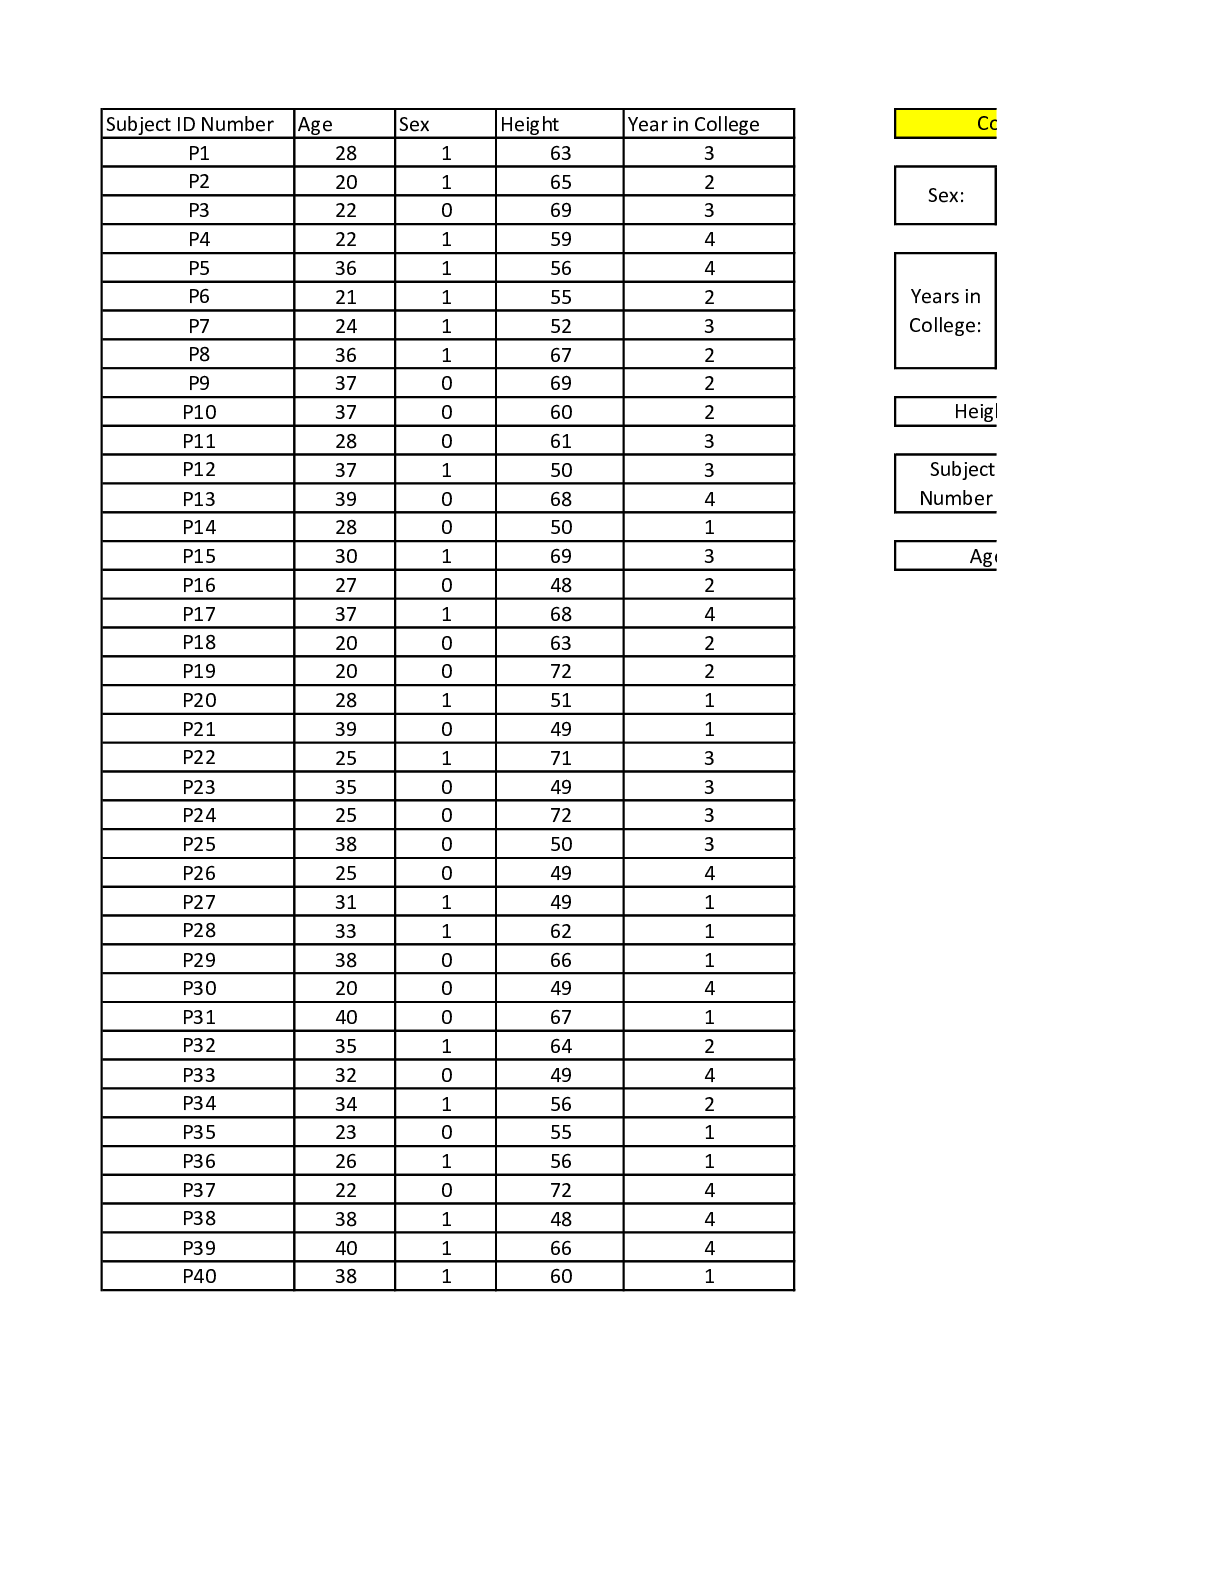
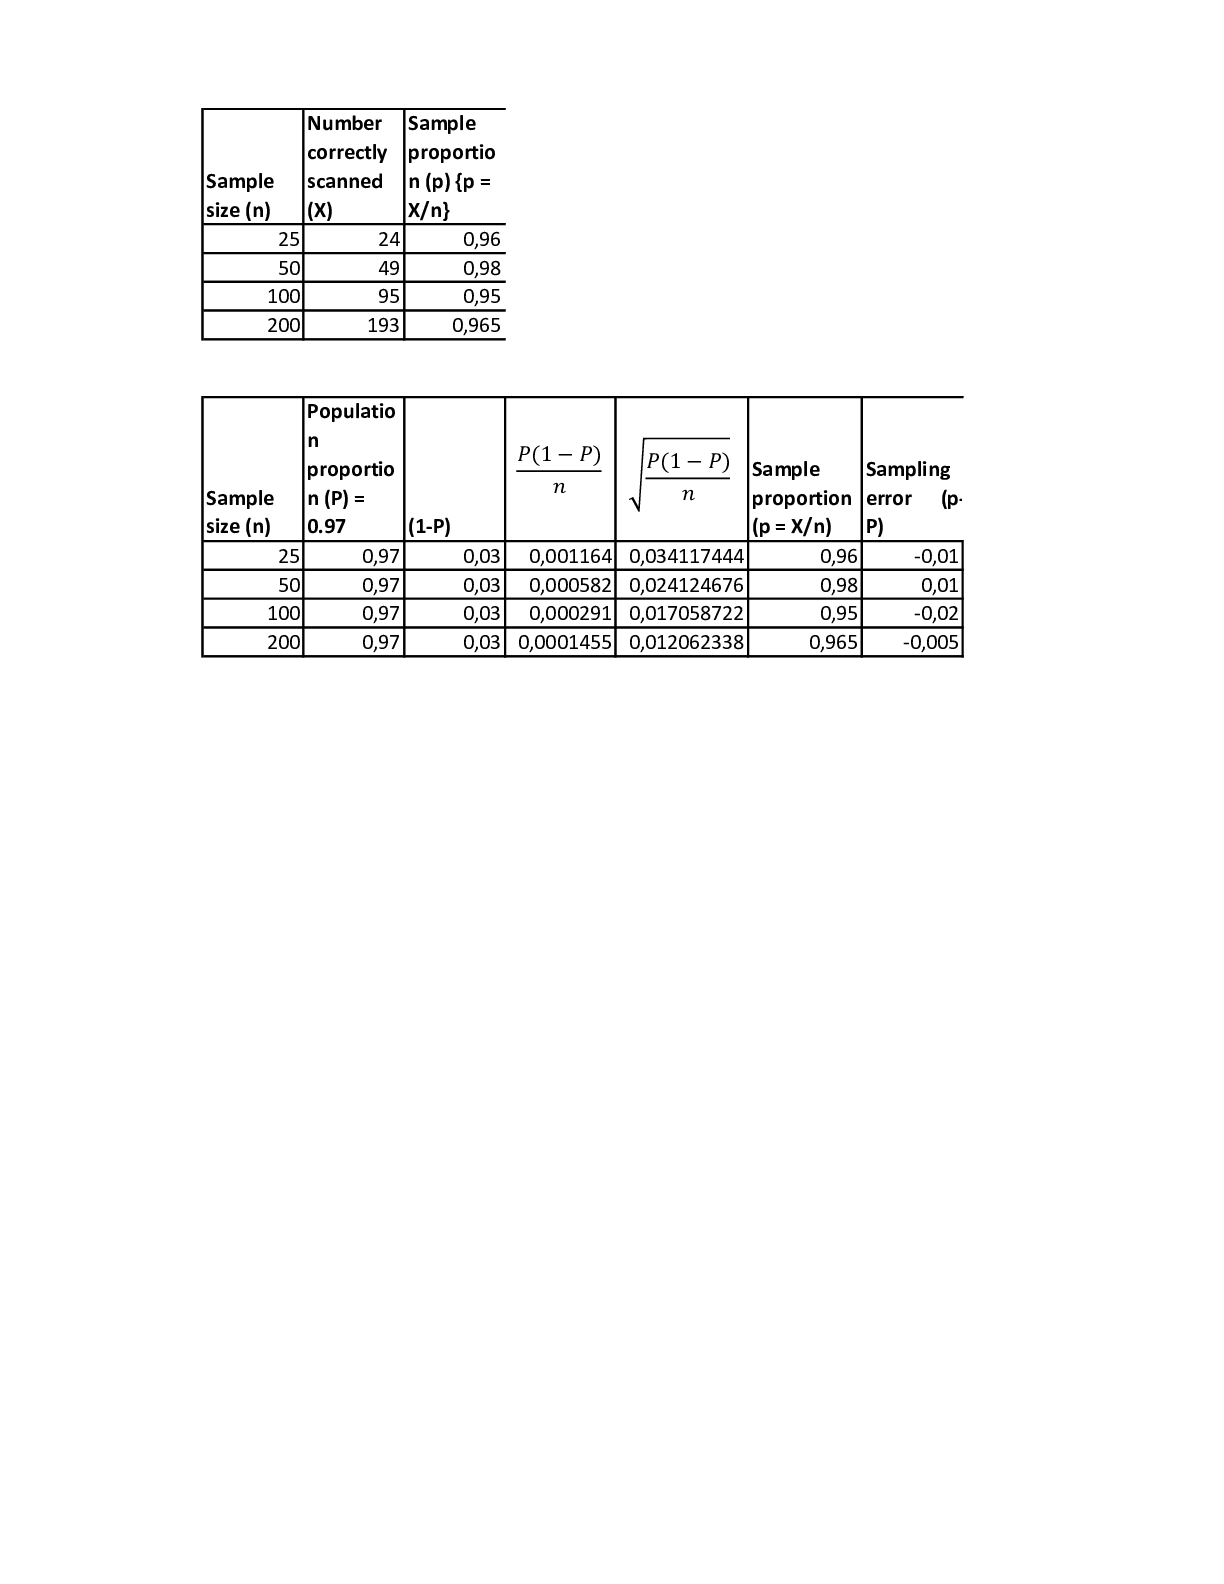
Use the Student_Data.xls file which consists of 200 MBA students at Whatsamattu U. The file includes variables regarding students’ age, gender, major, GPA, Bachelors GPA, course load, English speaki... ng status, family, weekly hours spent studying. Each of the three assigned problems should be formatted as a one page memo. Answers to all three of the problems should be submitted via the Drop Box as a single Word document with each of the problems clearly labeled. Be sure to include your name on the document itself! COMPLETE PROBLEM 1: It is pretty common across most schools to find the grades at the MBA level divided between A’s and B’s. As such, you expect the mean GPA to be around 3.50. Using the sample of 200 MBA students, conduct a one-sample hypothesis test to determine if the mean graduate GPA is different from 3.50. Use a .05 significance level. Report on your findings (100+ words, 3 or more sentences). In your report, be sure to include the results of the hypothesis test and indicate whether you are using a two-tail, upper-tail, or lower-tail test. Also include a chart (a bar chart or column chart will probably work best) comparing the calculated mean with the hypothesized mean. COMPLETE PROBLEM 2: Assume you read in the Whatsamatta U website that the average age of their MBA students is 45. Is this really true or have they failed to update this correctly? You think it is far less because more students have started their Masters sooner since the economy is so bad. You took a sample of 200 students (in the data file). Conduct a one-sample hypothesis test to determine if the mean age is less than 45. Use a .05 significance level. Report on your findings (100+ words, 3 or more sentences). In your report, be sure to include the results of the hypothesis test and indicate whether you are using a two-tail, upper-tail, or lower-tail test. Also include a chart (a bar chart or column chart will probably work best) comparing the calculated mean with the hypothesized mean. COMPLETE PROBLEM 3: You have heard from idle chatter that most students don’t declare a major in their MBA programs. You took a sample of 200 students (in the data file). Conduct a one-sample hypothesis test to determine if the proportion without a major is greater than 50%. Use a .05 significance level. Report on your findings (100+ words, 3 or more sentences). In your report, be sure to include the results of the hypothesis test and indicate whether you are using a two-tail, upper-tail, or lower-tail test. Also include a chart (a bar chart or column chart will probably work best) comparing the calculated proportion with the hypothesized proportion. *Note: you are testing sample date to some stated norm or Null. You have to choose which of the three directions for the one sample tests that you will perform based on the wording in the problem set. (two-tailed, upper tailed, or lower tailed). You would only use one of the three. ***The only charts that I am interested in you providing for your homework are the output charts from the one sample tests. You do not need to create additional bar or pie charts for the future units. Use the “Solutions To Practice Problems” as your guide for formatting your work and writing your analysis**. Finished work should look like the Practice Problems file that I uploaded. Please follow the instructions thoroughly and let me know if you have any questions or concerns. Make sure to use the files I uploaded. [Show More]
Last updated: 11 months ago
Preview 1 out of 2 pages
.png)
Reviews( 0 )
Document information
Connected school, study & course
About the document
Uploaded On
Dec 31, 2021
Number of pages
2
Written in

Additional information
This document has been written for:
Uploaded
Dec 31, 2021
Downloads
0
Views
36


.png)


.png)


, 2e by Stephen Lovett.png)