Mathematics > EXAM > MATH 110 Module 2 Exam (GRADED A) Questions and Answers- Portage Learning. (All)
MATH 110 Module 2 Exam (GRADED A) Questions and Answers- Portage Learning.
Document Content and Description Below
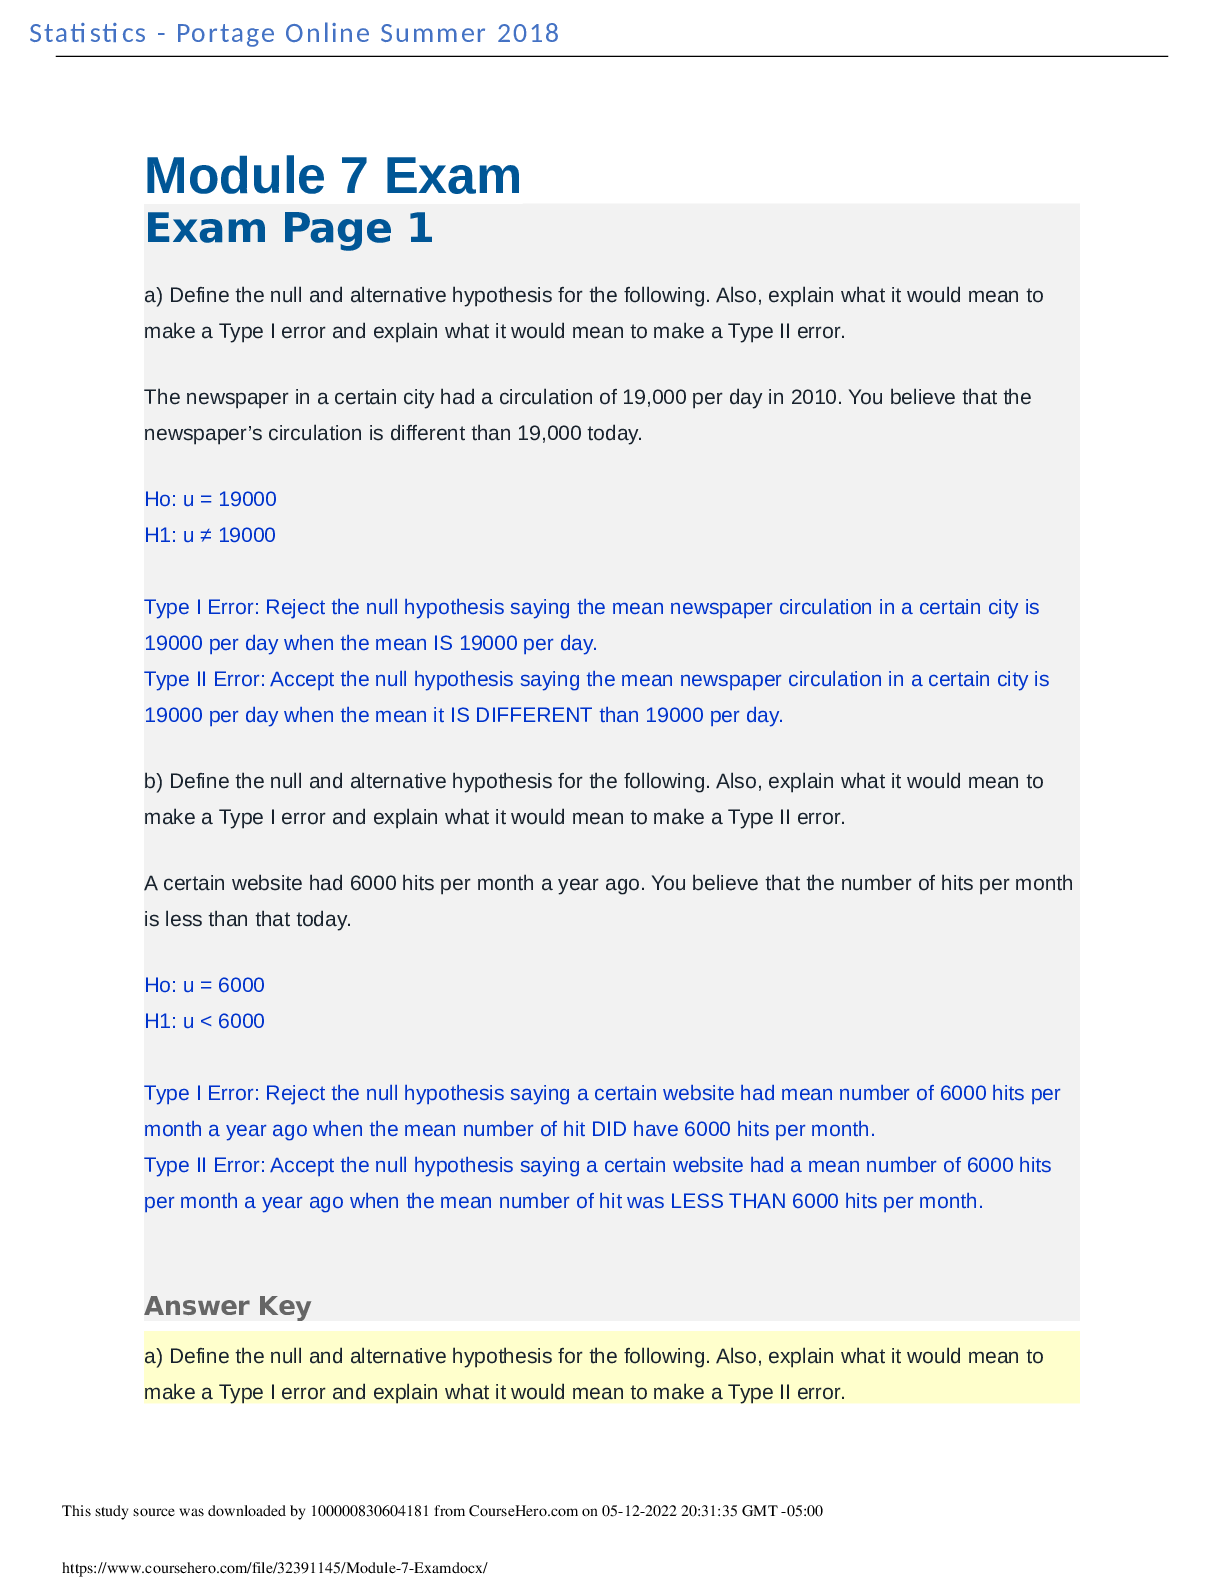
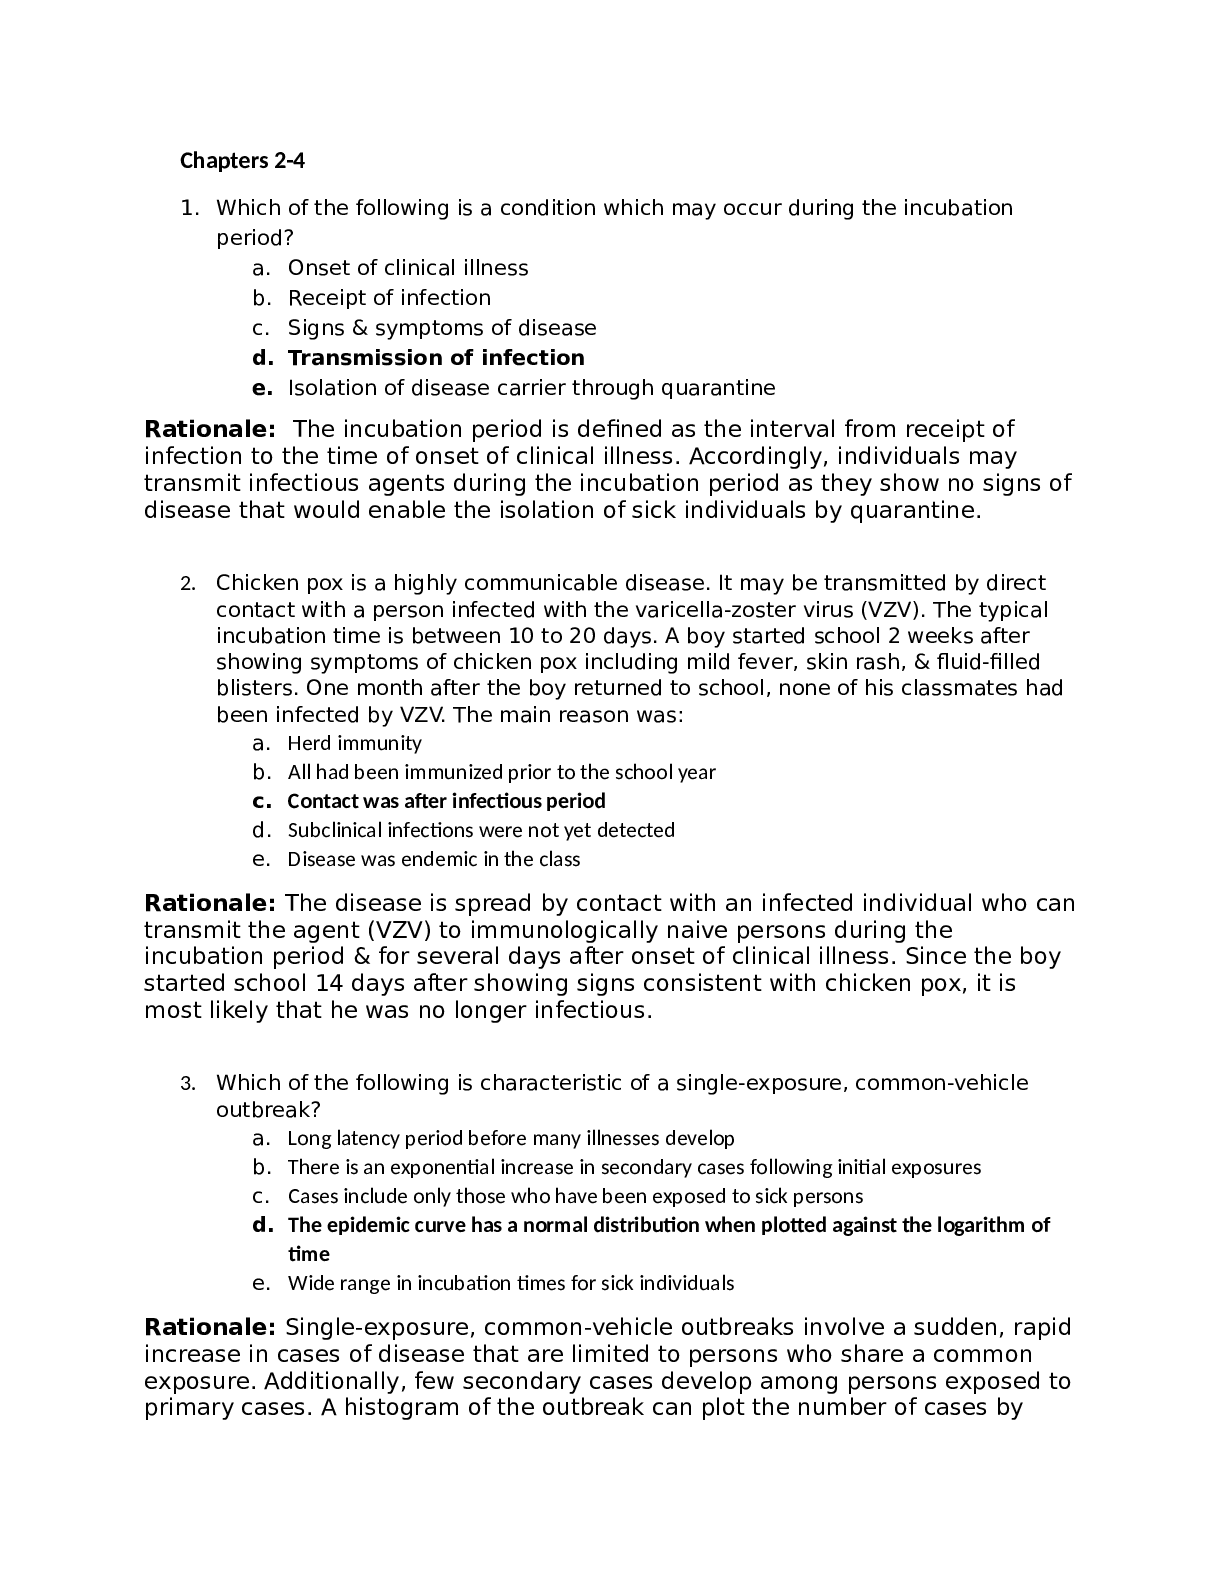
Module 2 Exam Exam Page 1 During an hour at a fast food restaurant, the following types of sandwiches are ordered: Cheeseburger Fish Cheeseburger Hamburger Fish Chicken Hamburger Cheeseburger ... Fish Hamburger Turkey Fish Chicken Chicken Fish Turkey Fish Hamburger Fish Cheeseburger Fish Cheeseburger Hamburger Fish Fish Cheeseburger Hamburger Fish Turkey Turkey Chicken Fish Chicken Cheeseburger Fish Turkey Fish Fish Hamburger Fish Fish Turkey Chicken Hamburger Fish Cheeseburger Chicken Chicken Turkey Fish Hamburger Chicken Fish a) Make a frequency distribution for this data. Sandwiches Frequency Fish 20 Chicken 9 Hamburger 9 Cheeseburger 8 Turkey 7 Total 53 b) Make a relative frequency distribution for this data. Include relative percentages on this table. Copied and pasted from answer above to save on time not having to re-type Sandwiches Calculation Relative Frequency Relative Percentage Fish 20/53 = 0.3773 x 100 = 37.73 = 38% Chicken 9/53 = 0.1698 x 100 = 16.98 = 17% Hamburger 9/53 = 0.1698 x 100 = 16.98= 17% Cheeseburger 8/53 = 0.1509 x 100 = 15.09 = 15% Turkey 7/53 = 0.1320 x 100 = 13.2 = 13% Total 53 1 100% During an hour at a fast food restaurant, the following types of sandwiches are ordered: Cheeseburger Fish Cheeseburger Hamburger Fish Chicken Hamburger Cheeseburger Fish Hamburger Turkey Fish Chicken Chicken Fish Turkey Fish Hamburger Fish Cheeseburger Fish Cheeseburger Hamburger Fish Fish Cheeseburger Hamburger Fish Turkey Turkey Chicken Fish Chicken Cheeseburger Fish Turkey Fish Fish Hamburger Fish Fish Turkey Chicken Hamburger Fish Cheeseburger Chicken Chicken Turkey Fish Hamburger Chicken Fish a) Make a frequency distribution for this data. Major Frequency Hamburger 9 Cheeseburger 8 Fish 20 Turkey 7 Chicken 9 Total 53 b) Make a relative frequency distribution for this data. Include relative percentages on this table. Exam Page 3 Consider the following data: {22, 18, 16, 26, 20, 24} a) Find the sample mean of this data. 22+18+16+26+20+24 = 126 n = 6 xbar = ∑xi / n ∑xi = 126 n = 6 126/6 = 21 sample mean = 21 b) Find the range of this data. range = highest value - lowest value high value = 26 low value = 16 26-16 = 10 Range = 10 c) Find the sample standard deviation of this data. s^2 = variance s = standard deviation s^2 = ∑(xi-xbar)^2 / (n-1) xi = 16, 18, 20, 22, 24, 26 xbar = 21 n = 6 ∑(xi-xbar)^2 / (n-1) = (16-21)^2 = 25 (18-21)^2 = 9 (20-21)^2 = 1 (22-21)^2 = 1 (24-21)^2 = 9 (26 -21)^2 = 25 70 n-1 = 6-1 =5 70/5 = 14 s^2 (variance) = 14 standard deviation (s) = √variance √14 = 3.74 standard deviation of sample = 3.74 d) Find the coefficient of variation. coefficient of variation = (standard deviation / mean) x 100 standard deviation = 3.74 sample mean = 21 (3.74/21) x 100 = 17.8095 c) Is the point 54 above, below, or the same as the mean. How many standard deviations is 54 from the mean. z = (x-u) / o x = 54 u = 58 o = 8 (54-58) / 8 = -0.5 z = -0.5 point 54 is 0.5 (1/2) standard deviations below the mean below the mean because negative d) Is the point 84 above, below, or the same as the mean. How many standard deviations is 84 from the mean. z = (x-u) / o x =84 u = 54 0 = 8 (84-54) / 8 = 3.75 z = 3.75 point 84 is 3.75 standard deviations above the mean above the mean because positive -2.0 points Instructor Comments In part c the mean is 58, you are using 54 in your calculation. Answer Key a) The data point 50 is below the mean. Now use the z-score to determine how many standard deviations 50 is below the mean. We are told that the mean is 58 and the standard deviation is 8. So, the z-score is given by: The z-score is -1, so the data point 50 is 1 standard deviation below the mean. (the negative sign indicates that the point is below the mean). b) Is the point 42 above, below, or the same as the mean. How many standard deviations is 42 from the mean. b) The data point 42 is below the mean. Now use the z-score to determine how many standard deviations 42 is below the mean. We are told that the mean is 58 and the standard deviation is 8. So, the z-score is given by: The z-score is -2, so the data point 42 is 2 standard deviation below the mean (the negative sign indicates that the point is below the mean). c) Is the point 54 above, below, or the same as the mean. How many standard deviations is 54 from the mean. c) The data point 54 is below the mean. Now use the z-score to determine how many standard deviations 54 is below the mean. We are told that the mean is 58 and the standard deviation is 8. So, the z-score is given by: [Show More]
Last updated: 1 year ago
Preview 1 out of 11 pages
Reviews( 0 )
Document information
Connected school, study & course
About the document
Uploaded On
Nov 02, 2021
Number of pages
11
Written in

Additional information
This document has been written for:
Uploaded
Nov 02, 2021
Downloads
0
Views
37


.png)


 (1).png)