Statistics > Solutions Guide > University of Maryland, University College STAT 200STAT 200 - Homework 5 Solutions. (All)
University of Maryland, University College STAT 200STAT 200 - Homework 5 Solutions.
Document Content and Description Below
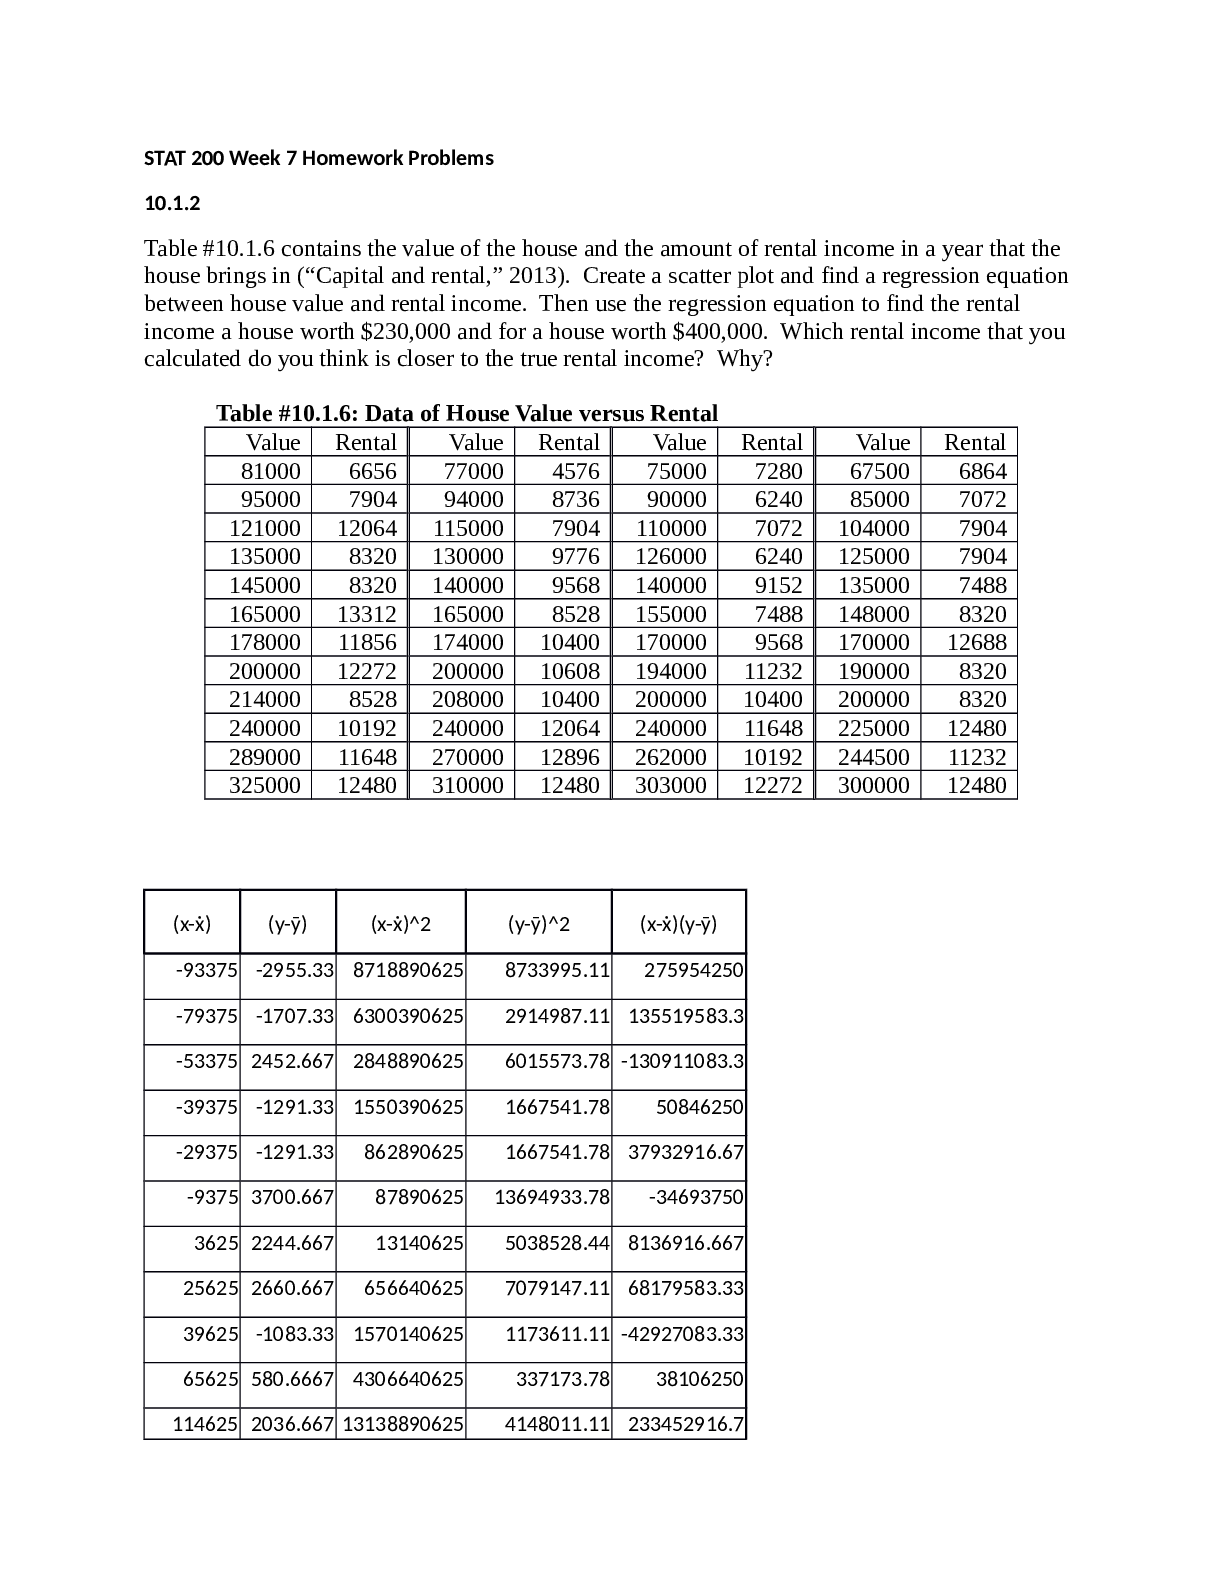
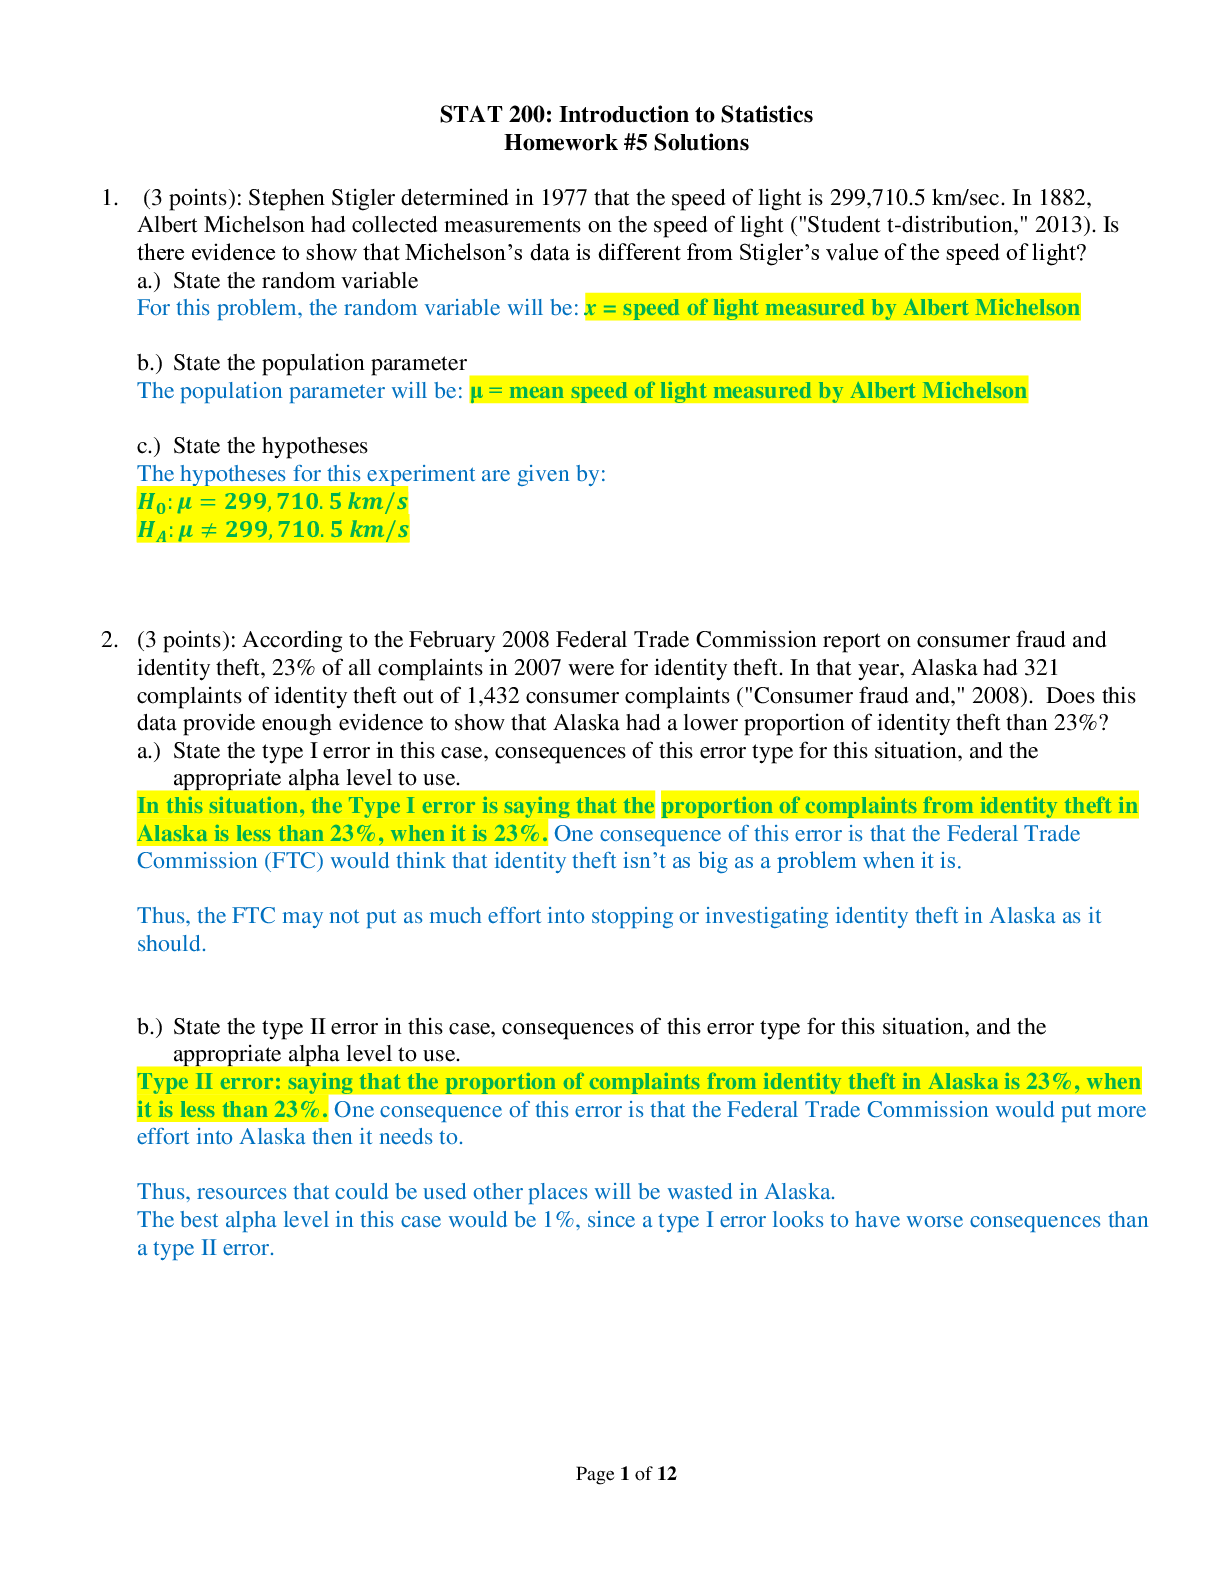
STAT 200: Introduction to Statistics Homework #5 Solutions 1. (3 points): Stephen Stigler determined in 1977 that the speed of light is 299,710.5 km/sec. In 1882, Albert Michelson had collected mea... surements on the speed of light ("Student t-distribution," 2013). Is there evidence to show that Michelson’s data is different from Stigler’s value of the speed of light? a.) State the random variable For this problem, the random variable will be: x = speed of light measured by Albert Michelson b.) State the population parameter The population parameter will be: μ = mean speed of light measured by Albert Michelson c.) State the hypotheses The hypotheses for this experiment are given by: ??: ? = ???, ???. ? ??/? ??: ? ≠ ???, ???. ? ??/? 2. (3 points): According to the February 2008 Federal Trade Commission report on consumer fraud and identity theft, 23% of all complaints in 2007 were for identity theft. In that year, Alaska had 321 complaints of identity theft out of 1,432 consumer complaints ("Consumer fraud and," 2008). Does this data provide enough evidence to show that Alaska had a lower proportion of identity theft than 23%? a.) State the type I error in this case, consequences of this error type for this situation, and the appropriate alpha level to use. In this situation, the Type I error is saying that the proportion of complaints from identity theft in Alaska is less than 23%, when it is 23%. One consequence of this error is that the Federal Trade Commission (FTC) would think that identity theft isn’t as big as a problem when it is. Thus, the FTC may not put as much effort into stopping or investigating identity theft in Alaska as it should. b.) State the type II error in this case, consequences of this error type for this situation, and the appropriate alpha level to use. Type II error: saying that the proportion of complaints from identity theft in Alaska is 23%, when it is less than 23%. One consequence of this error is that the Federal Trade Commission would put more effort into Alaska then it needs to. Thus, resources that could be used other places will be wasted in Alaska. The best alpha level in this case would be 1%, since a type I error looks to have worse consequences than a type II error. Page 2 of 12 3. (3 points): According to the February 2008 Federal Trade Commission report on consumer fraud and identity theft, 23% of all complaints in 2007 were for identity theft. In that year, Alaska had 321 complaints of identity theft out of 1,432 consumer complaints ("Consumer fraud and," 2008). Does this data provide enough evidence to show that Alaska had a lower proportion of identity theft than 23%? Why or why not? Test at the 5% level. We should start by writing down what we know (which is always a great place to start): x = 321 n = 1432 p = 0.23 (or 23%) α = 0.05 To fully address this problem, we shoudl follow the six step process presented in the textbook. i.) State the random variable and the parameter in words. The random variable is given by: x = number of complaints from identity theft in Alaska The parameter of interest is given by: p = proportion of complaints from identity theft in Alaska ii.) State the null and alternative hypotheses and the level of significance The hypotheses for this experiment are given by: ?0: ? = 0.23 ??: ? < 0.23 The level of significance is α = 0.05. iii.) State and check the assumptions for a hypothesis test a) A simple random sample of the category of 1432 complaints of identity theft in Alaska was taken. The study says that the complaints were out of all complaints that year, but the year could have been chosen at random. This assumption may be met, but you can’t be sure. b) There are 1432 complaints in this sample. The reason for the complaint does not affect the next complaint. There are only two outcomes, either the complaint was for identity theft or it wasn’t. The chance that one complaint was for identity theft does not change. Thus the conditions for the binomial distribution are satisfied c) In this case p = 0.23 and n = 1432. np = 1432 * 0.23 = 329.36 ≥ 5 and nq = 1432 * (1 – 0.23) = 1102.64 ≥ 5. Thus, the sampling distribution for ?̂is a normal distribution; this means we will use a z-test. iv.) Find the sample statistic, test statistic, and p-value The sample proportion is given by: x = 321 n = 1432 ?̂= ? ? = 321 1432 = 0.2242 The test statistic is given by: ? = ?̂− ? √ ?? ? = 0.2242 − 0.23 √ 0.23(1 − 0.23) 1432 = −0.522 The p-value associated with this problem (going back to homework 4 for how to compute the p-value from a z-statistic) is given by: = NORM.S.DIST(z,cumulative) = NORM.S.DIST (-0.522, TRUE) = 0.2998 Page 3 of 12 v.) Conclusion Since the p-value is greater than the level of significance (i.e. [p-value = 0.2998] > [α = 0.05]), we fail to reject ??. vi.) Interpretation (do not skip this part! This is the “so what” of the entire hypothesis test). There is not enough evidence to show that the proportion of complaints due to identity theft in Alaska is less than 23%. [Show More]
Last updated: 1 year ago
Preview 1 out of 12 pages
Instant download
Buy this document to get the full access instantly
Instant Download Access after purchase
Add to cartInstant download
Reviews( 0 )
Document information
Connected school, study & course
About the document
Uploaded On
Oct 08, 2021
Number of pages
12
Written in

Additional information
This document has been written for:
Uploaded
Oct 08, 2021
Downloads
0
Views
109