*NURSING > DISCUSSION POST > MATH 225N Week 3 Lab Assignment: Adolescents First Tobacco Products (answered) 100% Graded already. (All)
MATH 225N Week 3 Lab Assignment: Adolescents First Tobacco Products (answered) 100% Graded already.
Document Content and Description Below
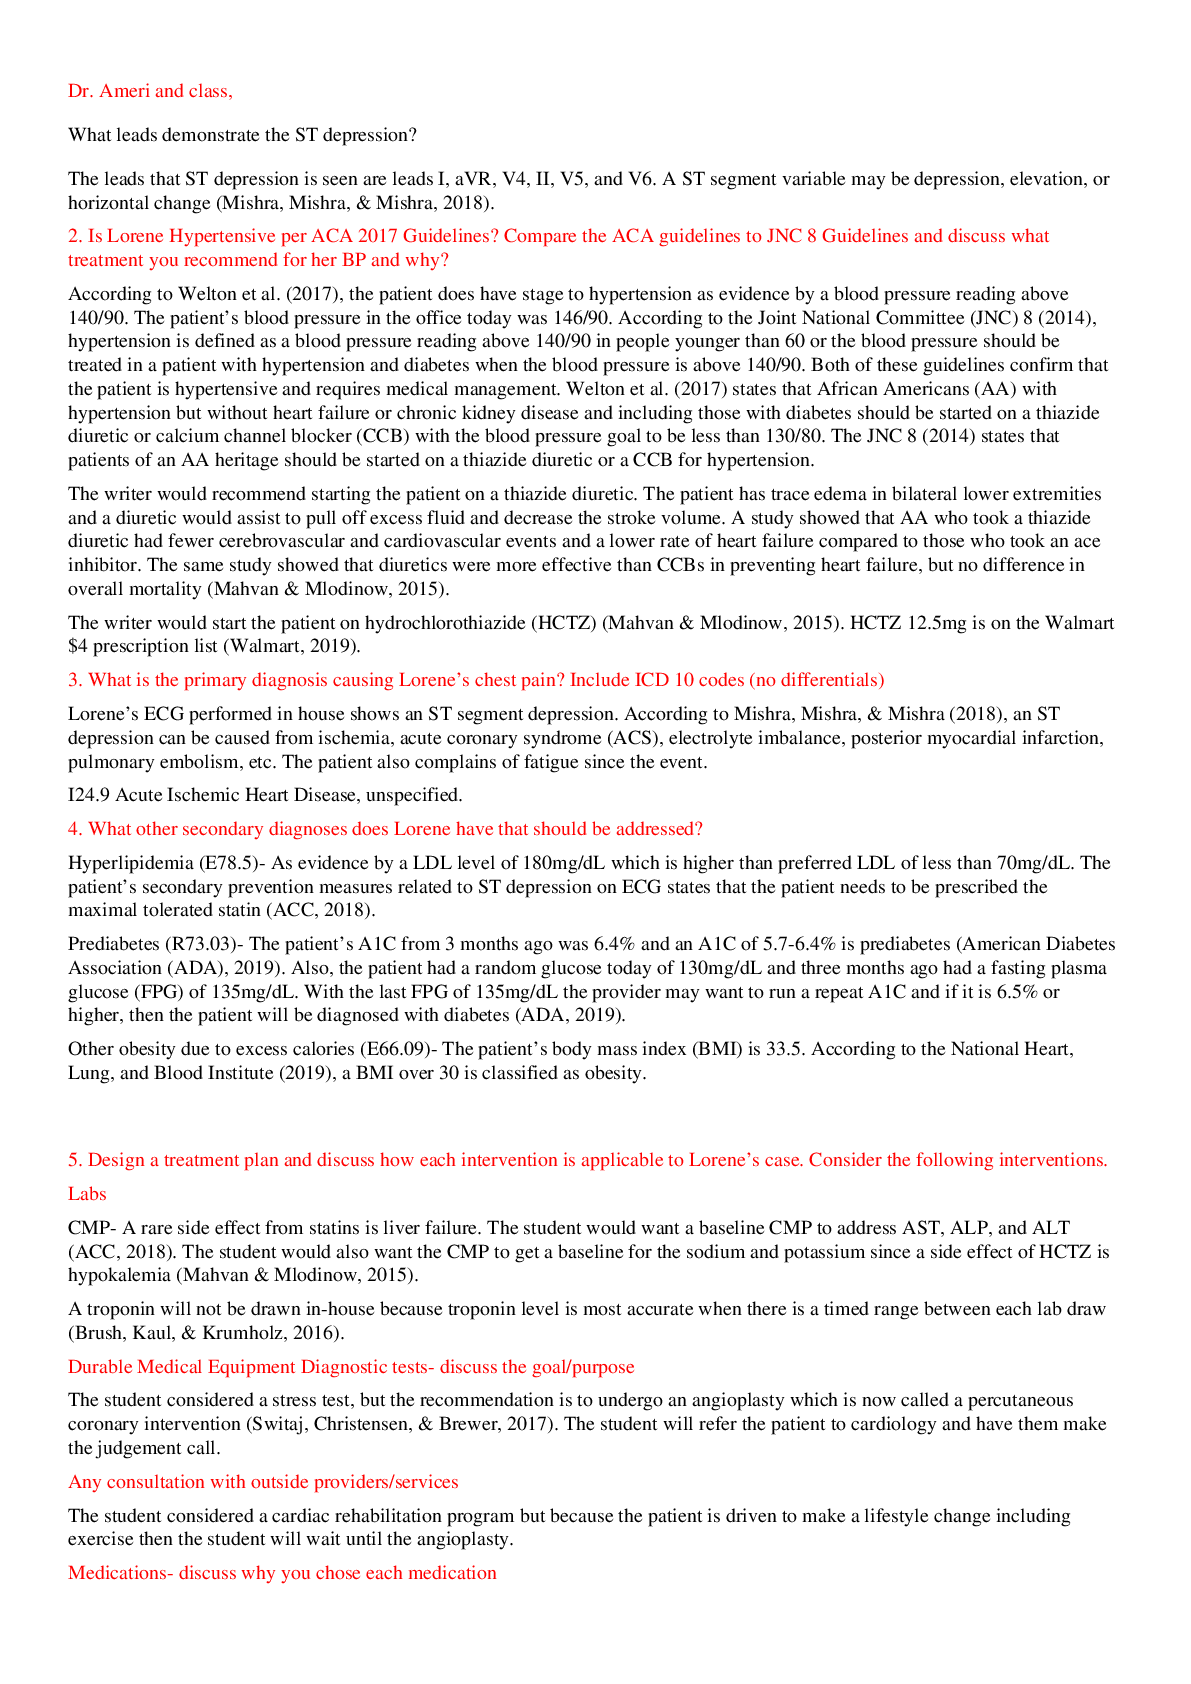
Running head: WEEK 3 LAB 1 Week 3 Assignment: Lab Adolescents First Tobacco Products Statistical Reasoning for the Health Sciences-Cartwright Chamberlain College of Nursing 2021 WEEK ... 3 LAB 2 The frequency distribution table in the article 2. On your first search, what terms did you use, and what other things did you mark on the search page before conducting your search? Why did you choose the article that you did? How many articles were found with these search terms? Give the full APA reference of the article you are using for this lab. The article I chose was Adolescents' first tobacco products: Associations with current multiple tobacco product use. In the first step using broad based search of the underlined terms, I searched with the terms tobacco product use and based on the last 12 months, it returned 1572 results. In the second step I narrowed my search for the article by using the entire title of the WEEK 3 LAB 3 article I had chosen Adolescents’ first tobacco products: Associations with current multiple tobacco product use. I also narrowed the search results to “peer reviewed”, “full text”, and “English” as the article language. The results were 162 results in the last 12 months. I selected this article since many adolescents are addicted to tobacco products before turning 18 years. I live in small community where I witness adolescents of from age 10 to 15 smoking or using any other tobacco products in the streets and public amenities. It is shocking to see many children can access these commodities and 16 years ago when I was a teenager, I was not able to access these commodities. It is crucial as parents and adults to teach the children on the risks associated with tobacco use. The full APA reference for my selected article is noted below (Holmes, Illowsky & Dean,2017). Kowitt, S. D., Goldstein, A. O., Sutfin, E. L., Osman, A., Meernik, C., Heck, C., & Ranney, L. M. (2019). Adolescents’ first tobacco products: Associations with current multiple tobacco product use. PLOS ONE, 14(5) Retrieved from https://doi.org/10.1371/journal.pone.0217244 3. What data are shown in the frequency distribution and why might it be of interest? Include the size of the classes, noting if they are of a consistent size or not. Also include a conclusion that could be made from the frequency distribution. (1 to 2 paragraphs) The data in the table 4 frequency distribution, I selected depicts the number of adolescent teenagers who have used tobacco products including; cigarettes, electronic cigarettes, smokeless tobacco, and the aspect of being a single user of tobacco and multiple user of tobacco. Consequent to the data shown in table 4, single usage of cigars and SLT have limited probability of using water pipe, e-cigarettes and OTP. The data in table 5 frequency distribution explores the number of individuals who have used tobacco once and if or not they turned to be frequent users of tobacco. Hence, the data in table indicates that individuals who tried an e-cigarette once had a lower likelihood to become a frequent user of tobacco (Kowitt, et al.,2019) WEEK 3 LAB 4 4. How else might these data have been displayed? Discuss pros and cons of 2 other presentation options, such as tables or different graphical displays (1 to 2 paragraphs) Presentation methods must be chosen as pet the format of the data, the analysis technique to be applied and the information to be highlighted. Wrongly presented data can lead to wrongful conveyance of information to the reviewers of readers. Even when similar information is communicated, different presentation methods should be used subject to the specific information being focused on. Hence, a pie chart, bar graph or histogram can be used to convey information in other modes like percentages. Another method can be the use of stem and leaf plot but it can fail to accurately depict the different product types used (Krishnamoorthy,2016). WEEK 3 LAB 5 References Holmes, A., Illowsky, B., & Dean, S. (2017). Introductory Business Statistics. Houston, TX: OpenStax CNX. Retrieved from https://openstax.org/details/books/introductory-business- statistics Krishnamoorthy, K. (2016). Handbook of statistical distributions with applications. CRC Press. Kowitt, S. D., Goldstein, A. O., Sutfin, E. L., Osman, A., Meernik, C., Heck, C., & Ranney, L. M. (2019). Adolescents’ first tobacco products: Associations with current multiple tobacco product use. PLOS ONE, 14(5) Retrieved [Show More]
Last updated: 1 year ago
Preview 1 out of 5 pages
Reviews( 0 )
Document information
Connected school, study & course
About the document
Uploaded On
Sep 24, 2021
Number of pages
5
Written in

Additional information
This document has been written for:
Uploaded
Sep 24, 2021
Downloads
0
Views
73


.png)

.png)

.png)


Growth and developmental patterns of toddlers.png)