Statistics > Summary > MATH 225N Week 4 Statistics Quiz Solutions: Fall 2020/2021 - Attempt Score : A+ (All)
MATH 225N Week 4 Statistics Quiz Solutions: Fall 2020/2021 - Attempt Score : A+
Document Content and Description Below
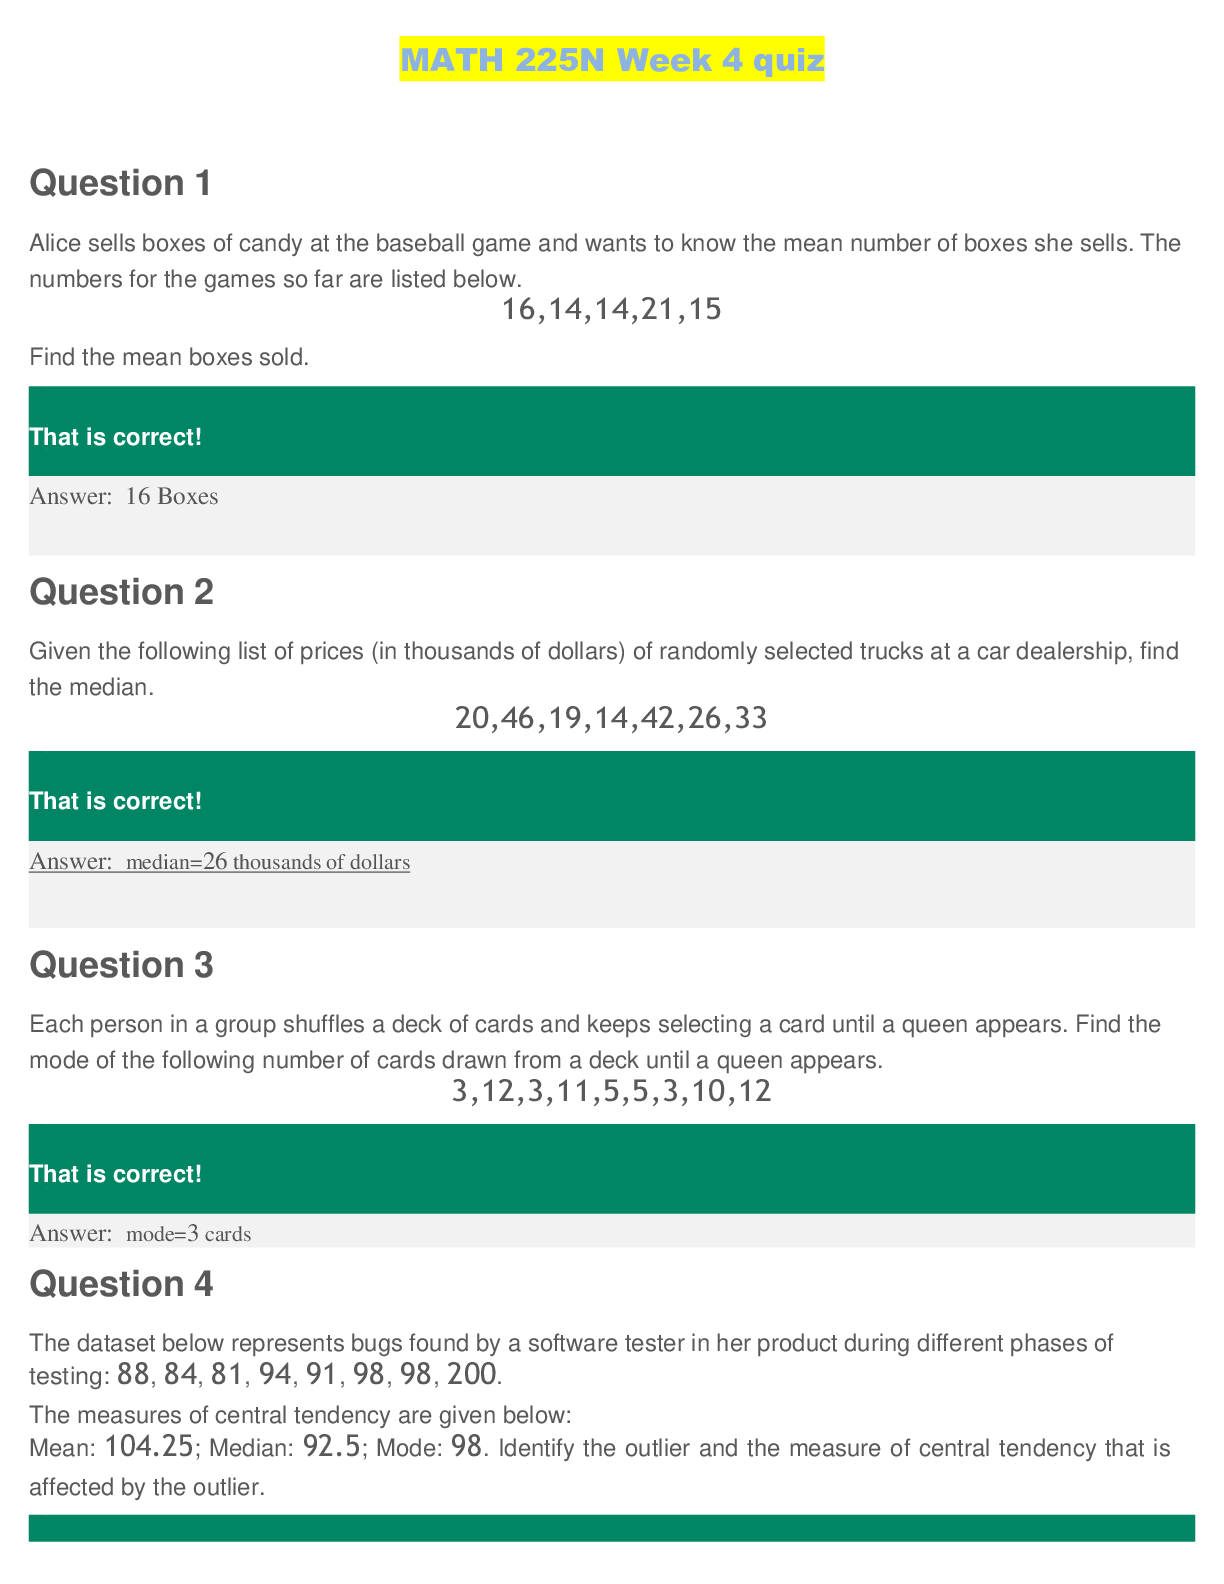
Question 1 Alice sells boxes of candy at the baseball game and wants to know the mean number of boxes she sells. The numbers for the games so far are listed below. 16,14,14,21,15 Find the mean... boxes sold. That is correct! Answer: 16 Boxes Question 2 Given the following list of prices (in thousands of dollars) of randomly selected trucks at a car dealership, find the median. 20,46,19,14,42,26,33 That is correct! Answer: median= 26 thousands of dollars Question 3 Each person in a group shuffles a deck of cards and keeps selecting a card until a queen appears. Find the mode of the following number of cards drawn from a deck until a queen appears. 3,12,3,11,5,5,3,10,12 That is correct! Answer: mode=3 cards Question 4 The dataset below represents bugs found by a software tester in her product during different phases of testing: 88, 84, 81, 94, 91, 98, 98, 200. The measures of central tendency are given below: Mean: 104.25; Median: 92.5; Mode: 98. Identify the outlier and the measure of central tendency that is affected by the outlier. That is correct! The outlier is 98. The mode is affected by the outlier. The outlier is 98. The mean is affected by the outlier. The outlier is 200. The median is affected by the outlier. The outlier is 200 . The mean is affected by the outlier. Question 5 Given the following histogram, decide if the data is skewed or symmetrical. A bar graph has a horizontal axis titled Values labeled from 2 to 18 in increments of 2 and a vertical axis titled Frequency labeled from 0 to 200 in increments of 50. 14 bars are plotted, above the numbers 2 to 16. From left to right, the heights of the bars are as follows: 1. 5. 10. 40, 75, 125, 190, 180, 130, 125, 60, 25,20, 10. All values are approximate. That is correct! The data are skewed to the left. The data are skewed to the right. The data are symmetric. Question 6 The following data set represents the ages of all seven grandchildren in a family. 4, 5, 11, 12, 11, 8, 5 If the variance of the ages is 9.7, what is the standard deviation? Round the final answer to one decimal place. That is correct! Answer: Std 3.1 Question 7 Which of the data sets represented by the following box and whisker plots has the smallest standard deviation? Four horizontal box-and-whisker plots share a vertical axis with the classes D, C, B, and A and a horizontal axis from 0 to 120 in increments of 20. The box-and-whisker plot above the class label A has the following five-number summary: 44, 69, 77, 82, and 112. The box-and-whisker plot above the class label B has the following five-number summary: 19, 64, 78, 87, and 121. The box-and-whisker plot above the class label C has the following five-number summary: 60, 72, 75, 80, and 92. The box-and-whisker plot above the class label D has the following five-number summary: 2, 63, 77, 92, and 138. All values are approximate. That is correct! A B C D Question 8 The box-and-whisker plot shows the number of books read by history students during the last school year. A box and whisker plot with minimum 4, first quartile 6, median 8, third quartile 10, and maximum 15 What is the range of the data? That is correct! Answer: 11 Question 9 A random sample of house sizes in major city has a sample mean of x ̄=1204.9 sq ft and sample standard deviation of s=124.6 sq ft. Use the Empirical Rule to determine the approximate percentage of house sizes that lie between 955.7and 1454.1 sq ft. Round your answer to the nearest whole number (percent). That is correct! Answer: 95 % Question 10 Is the statement below true or false? Independent is the property of two events in which the knowledge that one of the events occurred does not affect the chance the other occurs. That is correct! True False Question 11 Brayden tosses a coin 500 times. Of those 500 times, he observes heads a total of 416 times. Calculations show that the probability of this occurring by chance is less than 0.01, assuming the coin is fair. Determine the meaning of the significance level. That is correct! We expect that 416 of every 500 coin tosses will result in heads. At the 0.01 level of significance, the coin is likely not a fair coin. There is certainty that the coin is not a fair coin. The results are not statistically significant at the 0.05 level of significance. Question 12 A spinner contains the numbers 1 through 80. What is the probability that the spinner will land on a number that is not a multiple of 11? Give your answer in fraction form. That is correct! Answer: 73/80 Question 13 Of the following pairs of events, which pair has mutually exclusive events? [Show More]
Last updated: 1 year ago
Preview 1 out of 11 pages
Instant download
Instant download
Reviews( 0 )
Document information
Connected school, study & course
About the document
Uploaded On
Sep 21, 2021
Number of pages
11
Written in

Additional information
This document has been written for:
Uploaded
Sep 21, 2021
Downloads
0
Views
78


.png)

NSG110 AMERICANS RATE NURSES HIGHEST ON HONESTY, ETHICAL STANDARDS.png)


.png)

