Mathematics > QUESTIONS & ANSWERS > MATH 225N - Week 8: Performing Linear Regressions with Technology. Questions and Answers. (All)
MATH 225N - Week 8: Performing Linear Regressions with Technology. Questions and Answers.
Document Content and Description Below
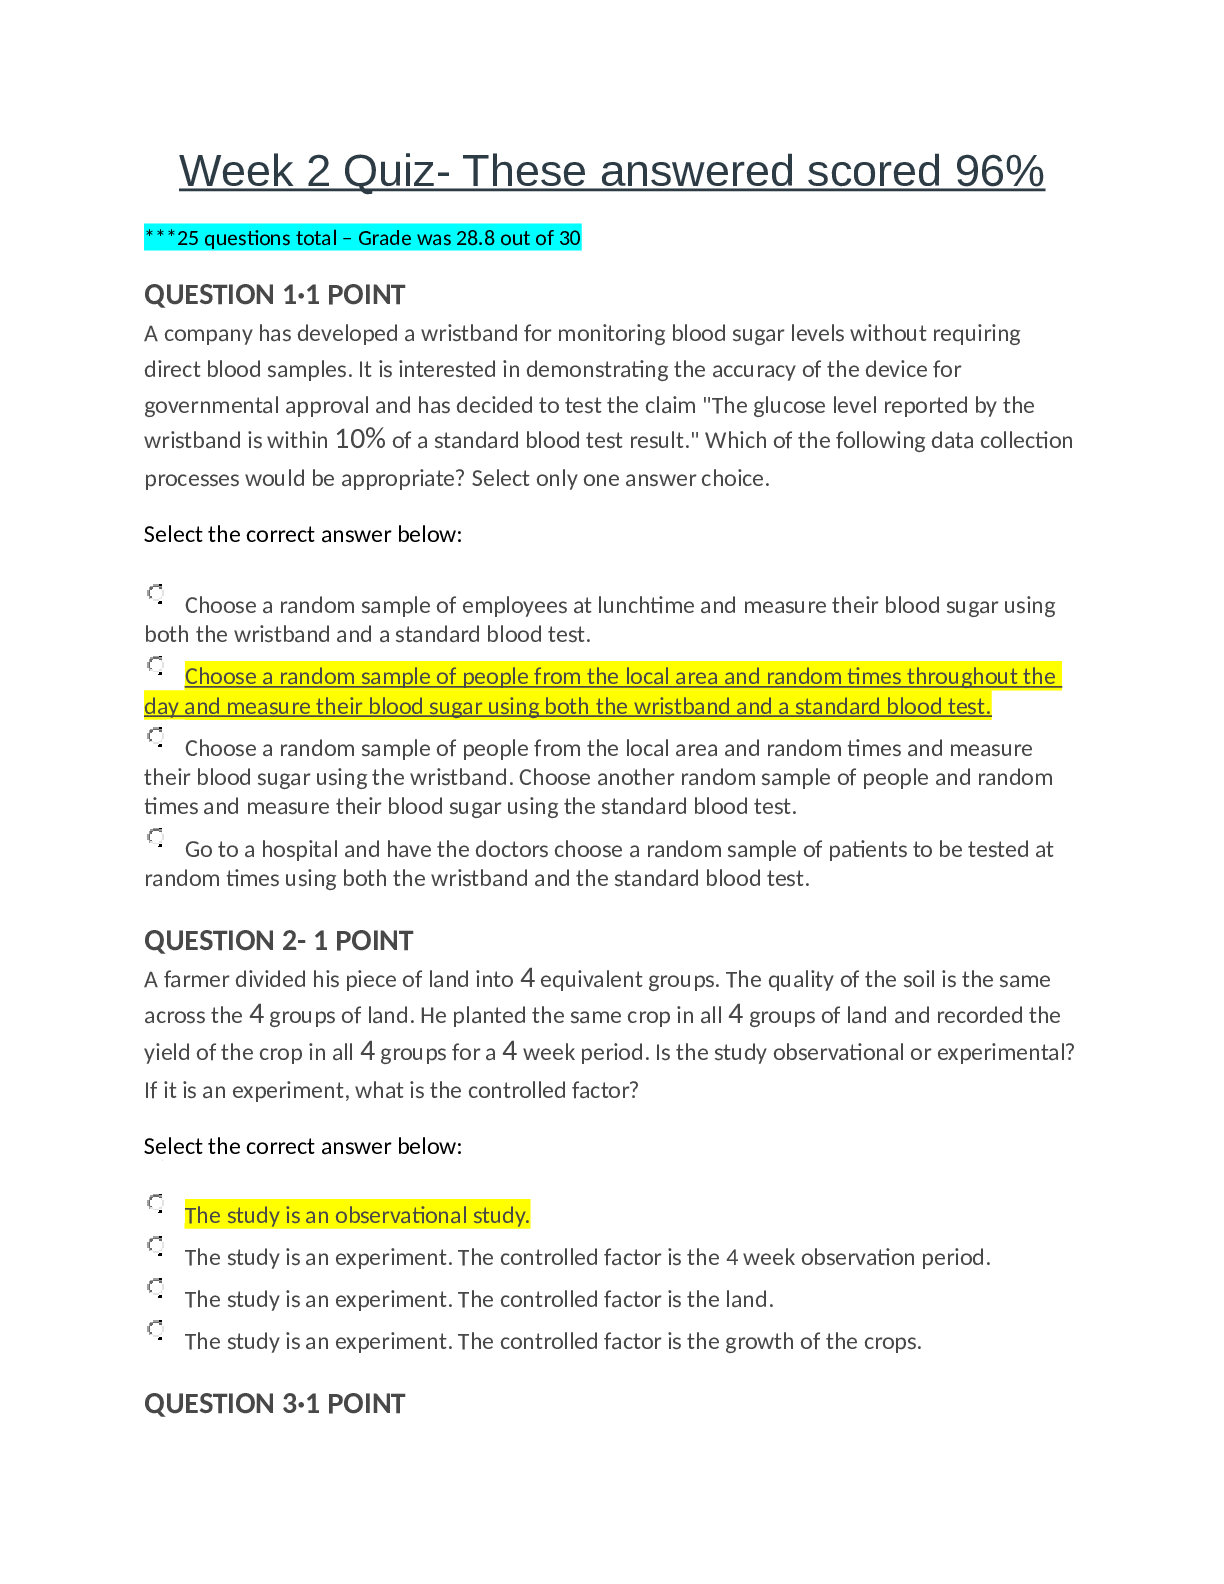
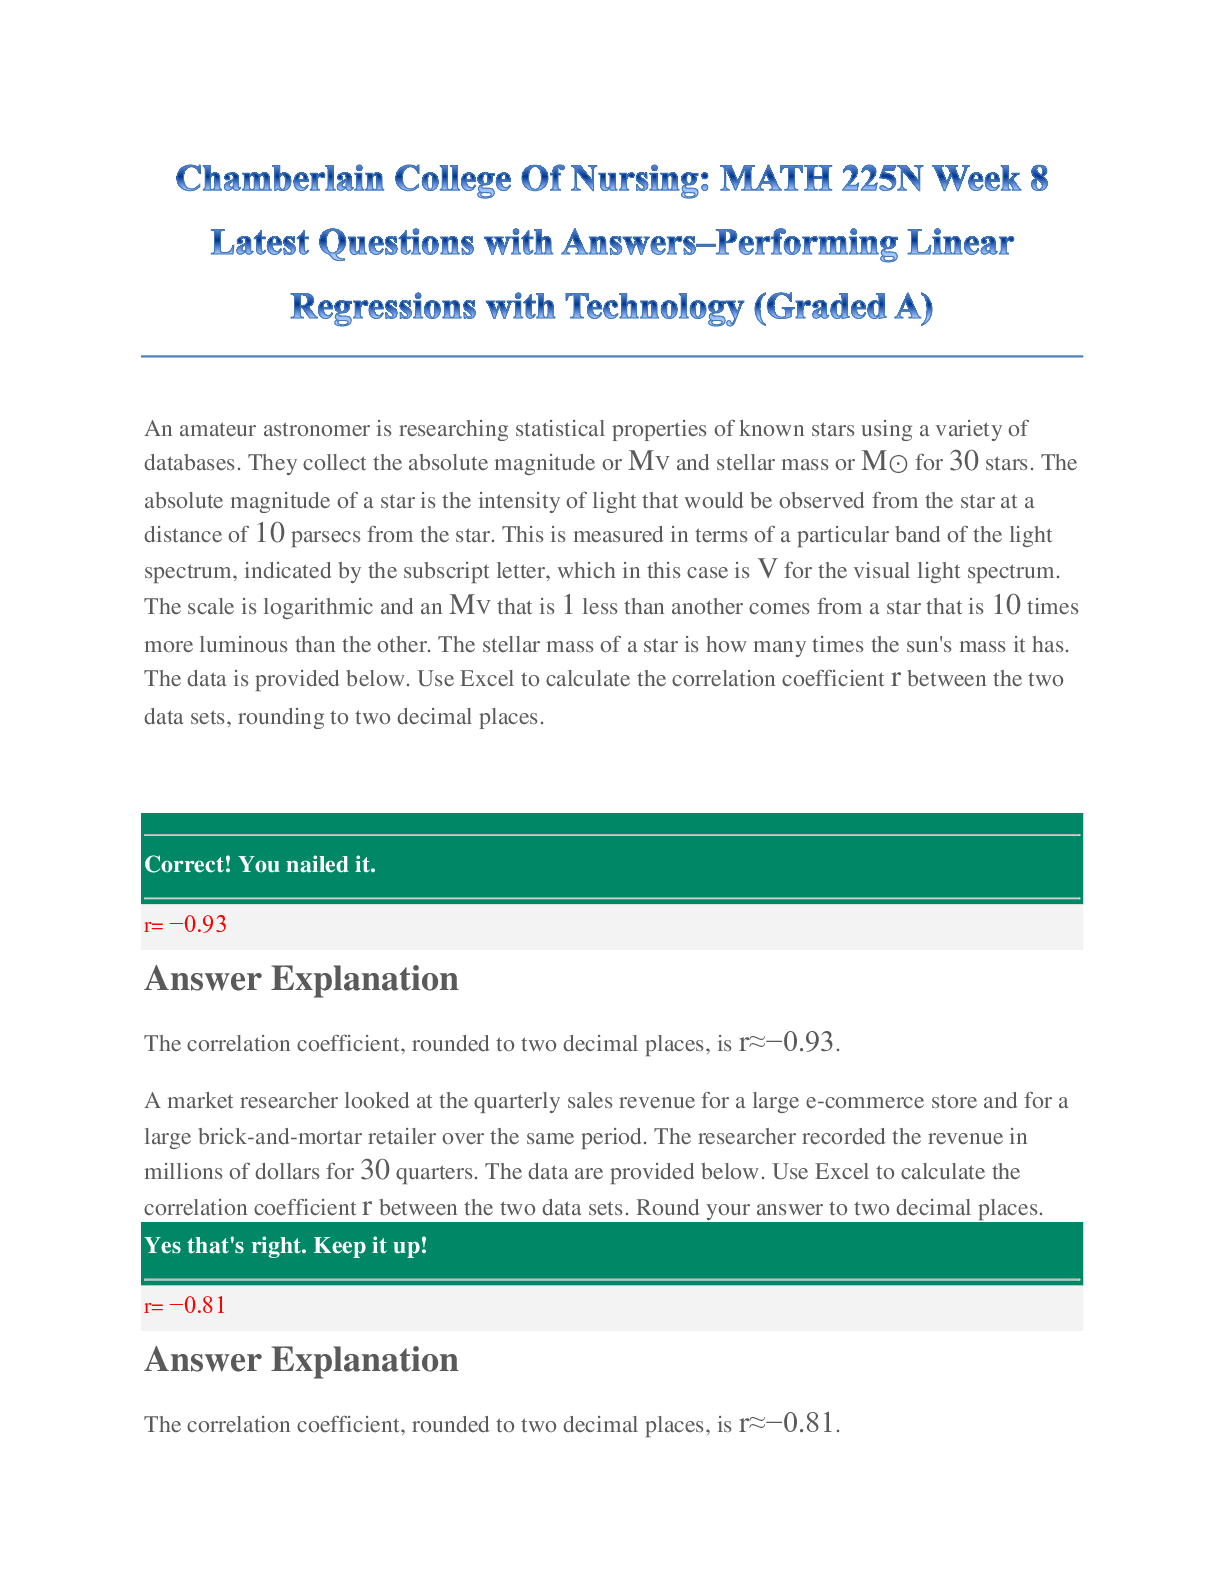
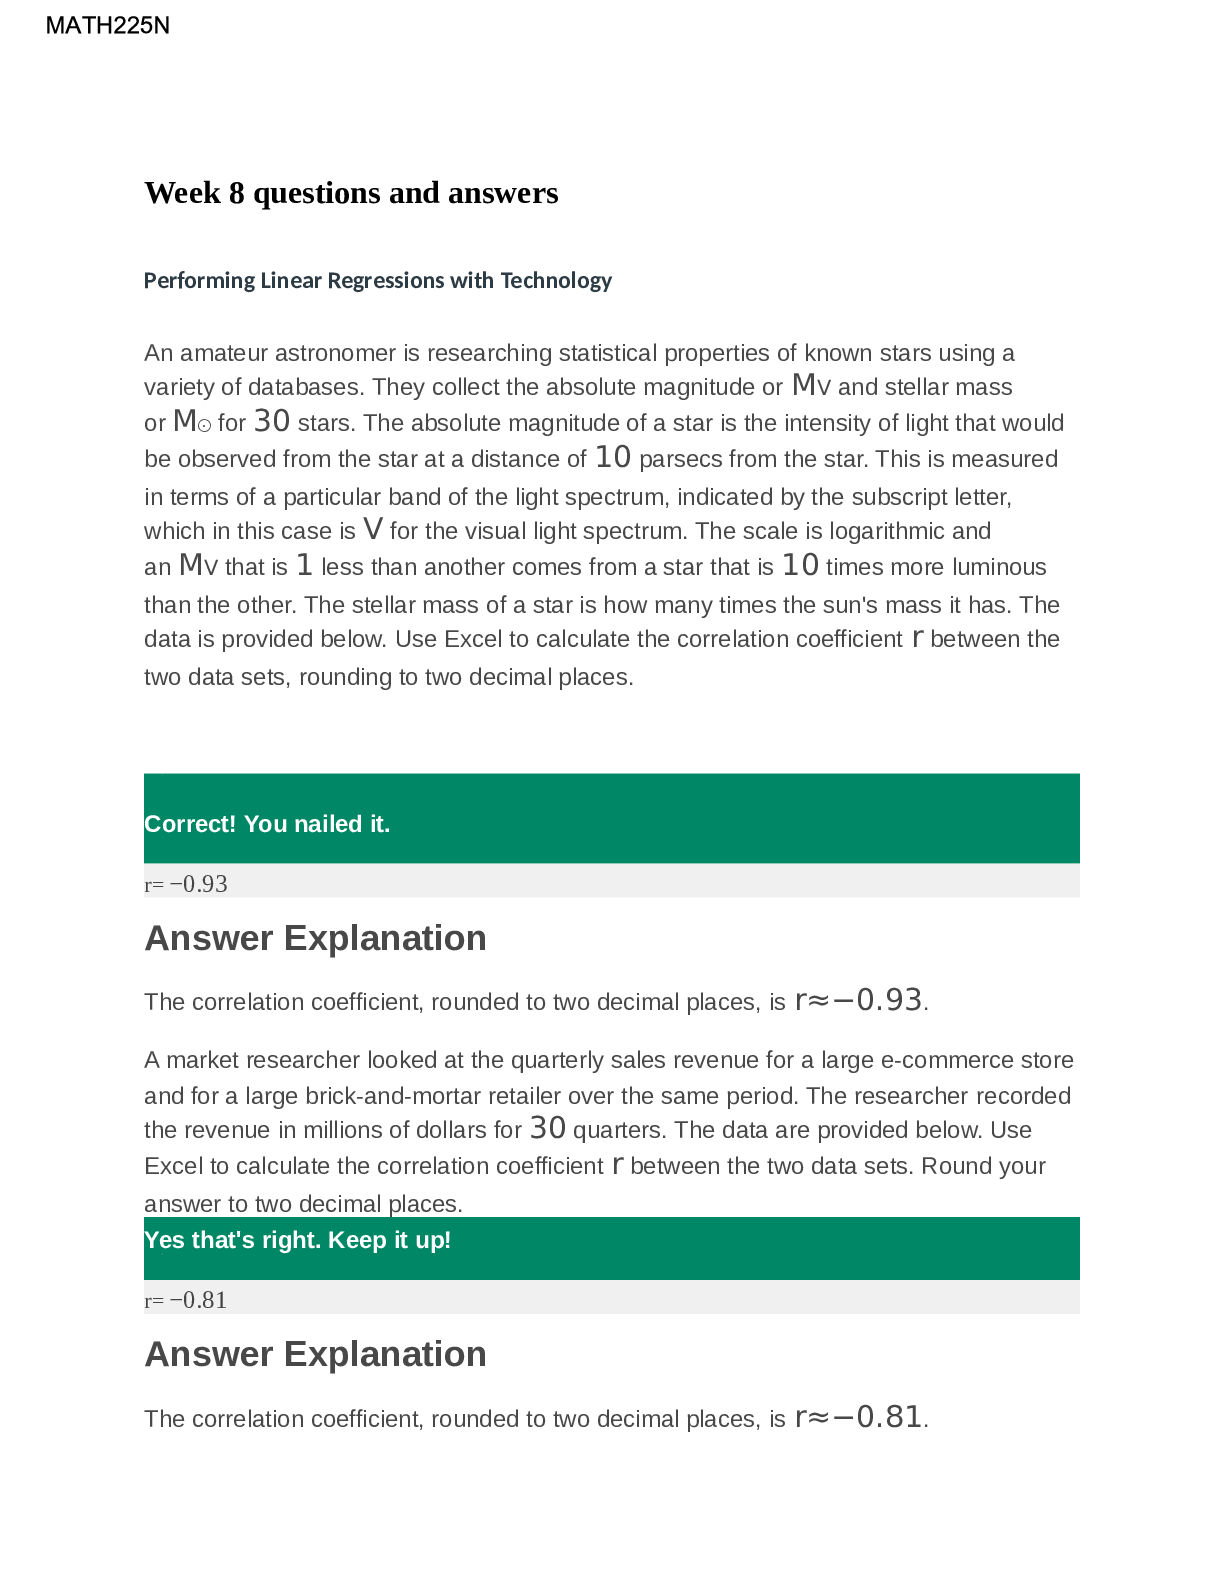
MATH 225N - Week 8: Performing Linear Regressions with Technology. Questions and Answers. Week 8 questions and answers Performing Linear Regressions with Technology An amateur astronomer is resea... rching statistical properties of known stars using a variety of databases. They collect the absolute magnitude or MV and stellar mass or M⊙ for 30 stars. The absolute magnitude of a star is the intensity of light that would be observed from the star at a distance of 10 parsecs from the star. This is measured in terms of a particular band of the light spectrum, indicated by the subscript letter, which in this case is V for the visual light spectrum. The scale is logarithmic and an MV that is 1 less than another comes from a star that is 10 times more luminous than the other. The stellar mass of a star is how many times the sun's mass it has. The data is provided below. Use Excel to calculate the correlation coefficient r between the two data sets, rounding to two decimal places. Correct! You nailed it. r= −0.93 Answer Explanation The correlation coefficient, rounded to two decimal places, is r≈−0.93. A market researcher looked at the quarterly sales revenue for a large e-commerce store and for a large brick-and-mortar retailer over the same period. The researcher recorded the revenue in millions of dollars for 30 quarters. The data are provided below. Use Excel to calculate the correlation coefficient r between the two data sets. Round your answer to two decimal places. Yes that's right. Keep it up! r= −0.81 Answer Explanation The correlation coefficient, rounded to two decimal places, is r≈−0.81. The table below contains the geographic latitudes, x, and average January temperatures, y, of 20cities. Use Excel to find the best fit linear regression equation. Round the slope and intercept to two decimal places. xy 46 23 32 60 39 40 33 59 38 57 40 33 42 33 30 64 34 56 HelpCopy to ClipboardDownload CSV Yes that's right. Keep it up! y = −2.68, x147.24 Thus, the equation of line of best fit with slope and intercept rounded to two decimal places is yˆ=−2.68x+147.24. An organization collects information on the life expectancy (in years) of a person in certain countries and the fertility rate per woman in those countries. The data for 21 randomly selected countries for the year 2011 is given below. Use Excel to find the best fit linear regression equation, where fertility rate is the explanatory variable. Round the slope and intercept to two decimal places. y = −4.21, x 83.68 Answer Explanationyˆ=−4.21, x+83.68. An economist is trying to understand whether there is a strong link between CEO pay ratio and corporate revenue. The economist gathered data including the CEO pay ratio and corporate revenue for 30 companies for a particular year. The pay ratio data is reported by the companies and represents the ratio of CEO compensation to the median employee salary. The data are provided below. Use Excel to calculate the correlation coefficient r between the two data sets. Round your answer to two decimal places. Perfect. Your hard work is paying off � r= −0.17 The correlation coefficient, rounded to two decimal places, is r≈−0.17. A researcher is interested in whether the variation in the size of human beings is proportional throughout each part of the human. To partly answer this question they looked at the correlation between the foot length (in millimeters) and height (in centimeters) of 30 randomly selected adult males. The data is provided below. Use Excel to calculate the correlation coefficient r between the two data sets. Round your answer to two decimal places. Great work! That's correct. r= 0.50 The correlation coefficient, rounded to two decimal places, is r≈0.50. The table below gives the average weight (in kilograms) of certain people ages 1–20. Use Excel to find the best fit linear regression equation, where age is the explanatory variable. Round the slope and intercept to two decimal places. Answer 1: That's not right - let's review the answer. y = 0.35, x28.99 Answer 2: Well done! You got it right. [Show More]
Last updated: 1 year ago
Preview 1 out of 55 pages
Reviews( 0 )
Document information
Connected school, study & course
About the document
Uploaded On
Aug 05, 2021
Number of pages
55
Written in

Additional information
This document has been written for:
Uploaded
Aug 05, 2021
Downloads
0
Views
60