Mathematics > QUESTIONS & ANSWERS > Chamberlain College Of Nursing:MATH 225N Week 8 Latest Questions with Answers–Performing Linear Re (All)
Chamberlain College Of Nursing:MATH 225N Week 8 Latest Questions with Answers–Performing Linear Regressions with Technology (Graded A)
Document Content and Description Below
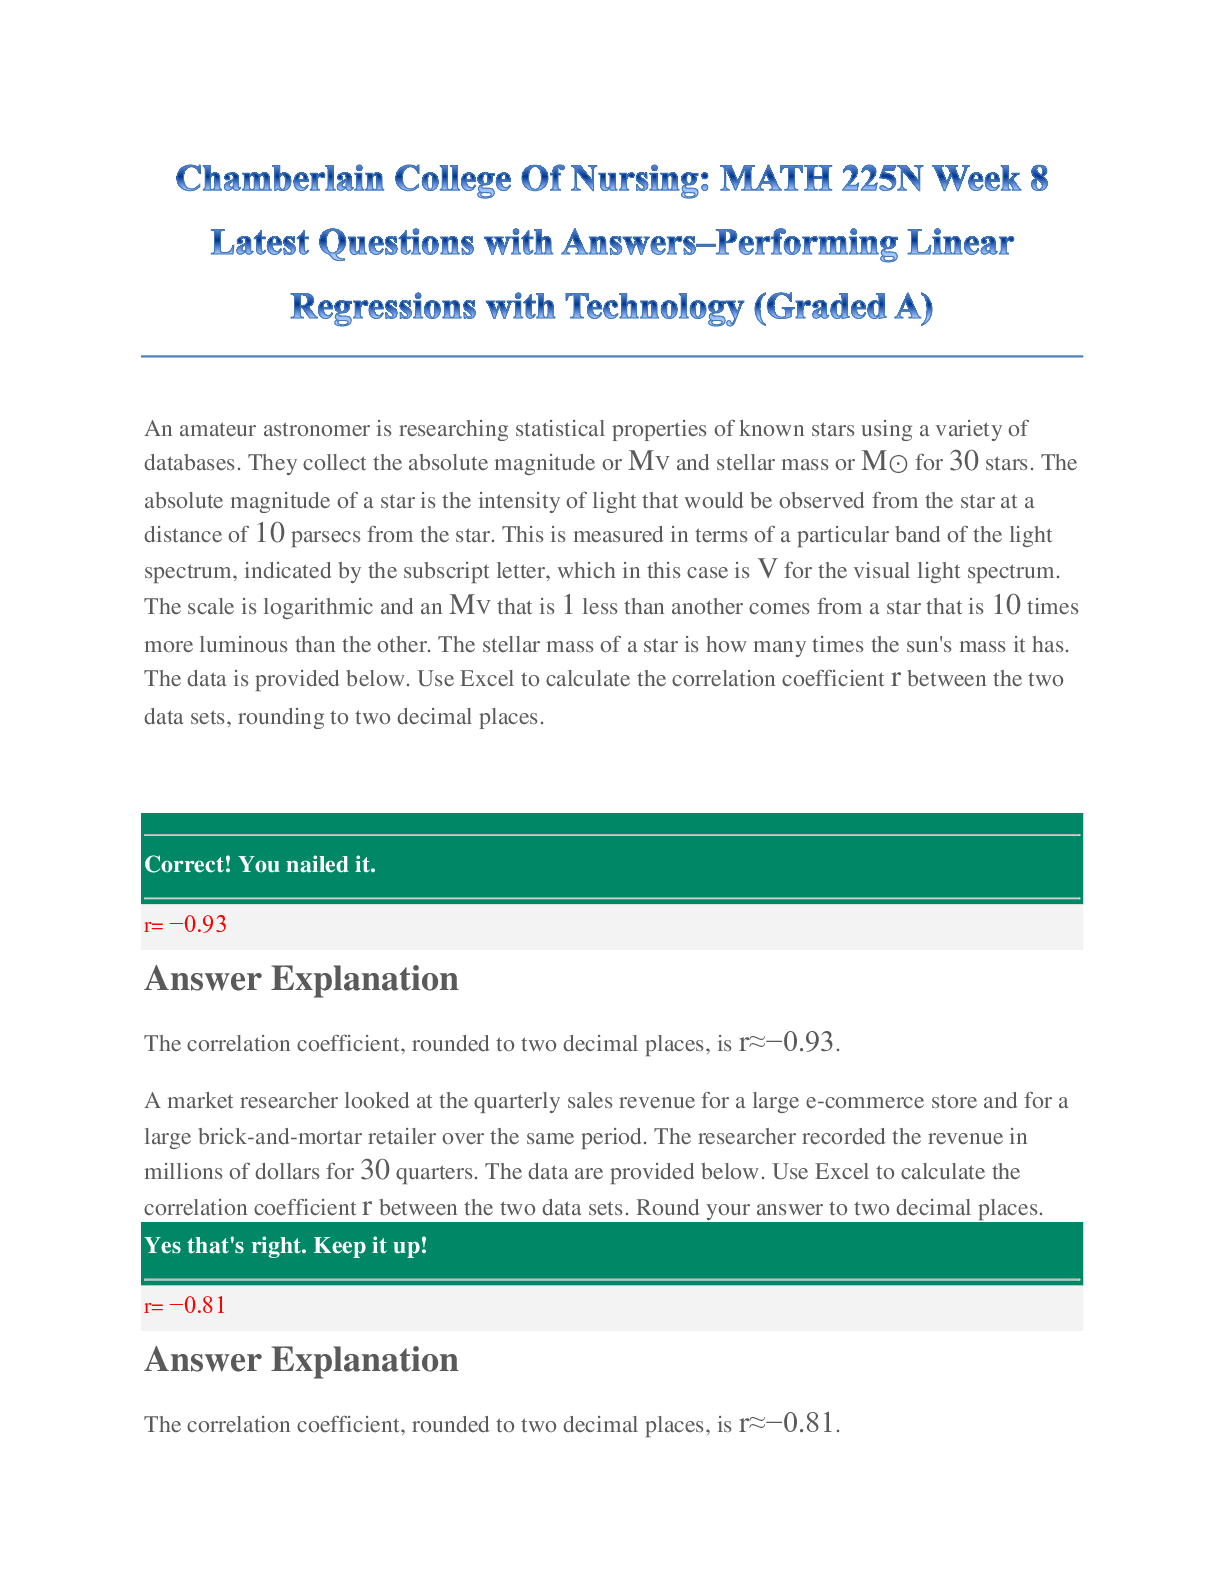
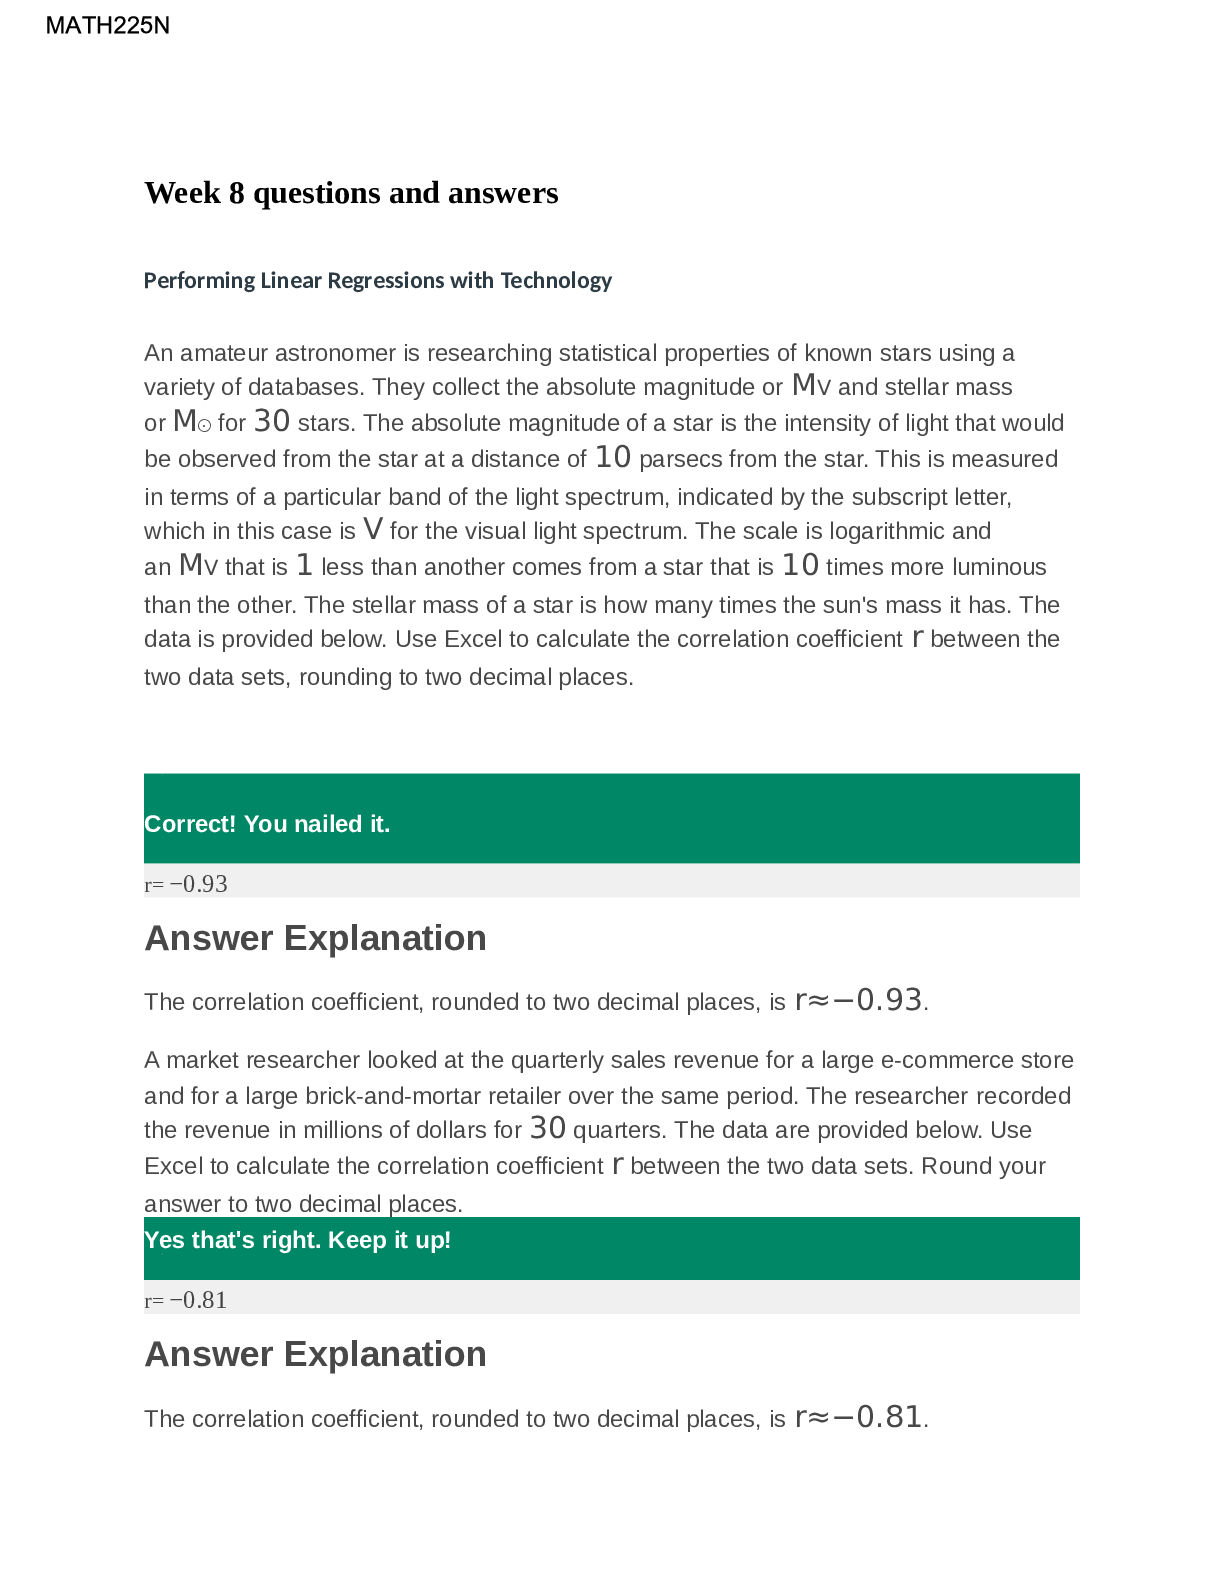
Chamberlain College Of Nursing:MATH 225N Week 8 Latest Questions with Answers–Performing Linear Regressions with Technology (Graded A) An amateur astronomer is researching statistical properties ... of known stars using a variety of databases. They collect the absolute magnitude or MV and stellar mass or M⊙ for 30 stars. The absolute magnitude of a star is the intensity of light that would be observed from the star at a distance of 10 parsecs from the star. This is measured in terms of a particular band of the light spectrum, indicated by the subscript letter, which in this case is V for the visual light spectrum. The scale is logarithmic and an MV that is 1 less than another comes from a star that is 10 times more luminous than the other. The stellar mass of a star is how many times the sun's mass it has. The data is provided below. Use Excel to calculate the correlation coefficient r between the two data sets, rounding to two decimal places. ________________________________________ Correct! You nailed it. ________________________________________ r= −0.93 Answer Explanation The correlation coefficient, rounded to two decimal places, is r≈−0.93. A market researcher looked at the quarterly sales revenue for a large e-commerce store and for a large brick-and-mortar retailer over the same period. The researcher recorded the revenue in millions of dollars for 30 quarters. The data are provided below. Use Excel to calculate the correlation coefficient r between the two data sets. Round your answer to two decimal places. Yes that's right. Keep it up! ________________________________________ r= −0.81 Answer Explanation The correlation coefficient, rounded to two decimal places, is r≈−0.81. The table below contains the geographic latitudes, x, and average January temperatures, y, of 20cities. Use Excel to find the best fit linear regression equation. Round the slope and intercept to two decimal places. x y 46 23 32 60 39 40 33 59 38 57 40 33 42 33 30 64 34 56 HelpCopy to ClipboardDownload CSV ________________________________________ Yes that's right. Keep it up! ________________________________________ y = −2.68, x147.24 Thus, the equation of line of best fit with slope and intercept rounded to two decimal places is yˆ=−2.68x+147.24. An organization collects information on the life expectancy (in years) of a person in certain countries and the fertility rate per woman in those countries. The data for 21 randomly selected countries for the year 2011 is given below. Use Excel to find the best fit linear regression equation, where fertility rate is the explanatory variable. Round the slope and intercept to two decimal places. ________________________________________ y = −4.21, x 83.68 Answer Explanationyˆ=−4.21, x+83.68. An economist is trying to understand whether there is a strong link between CEO pay ratio and corporate revenue. The economist gathered data including the CEO pay ratio and corporate revenue for 30 companies for a particular year. The pay ratio data is reported by the companies and represents the ratio of CEO compensation to the median employee salary. The data are provided below. Use Excel to calculate the correlation coefficient r between the two data sets. Round your answer to two decimal places. Perfect. Your hard work is paying off ? ________________________________________ r= −0.17 The correlation coefficient, rounded to two decimal places, is r≈−0.17. A researcher is interested in whether the variation in the size of human beings is proportional throughout each part of the human. To partly answer this question they looked at the correlation between the foot length (in millimeters) and height (in centimeters) of 30 randomly selected adult males. The data is provided below. Use Excel to calculate the correlation coefficient r between the two data sets. Round your answer to two decimal places. ________________________________________ Great work! That's correct. ________________________________________ r= 0.50 The correlation coefficient, rounded to two decimal places, is r≈0.50. The table below gives the average weight (in kilograms) of certain people ages 1–20. Use Excel to find the best fit linear regression equation, where age is the explanatory variable. Round the slope and intercept to two decimal places. Answer 1: ________________________________________ That's not right - let's review the answer. ________________________________________ y = 0.35, x28.99 Answer 2: ________________________________________ Well done! You got it right. ________________________________________ y = 2.89, x 4.69 Thus, the equation of line of best fit with slope and intercept rounded to two decimal places is yˆ=2.86x+4.69. In the following table, the age (in years) of the respondents is given as the x value, and the earnings (in thousands of dollars) of the respondents are given as the y value. Use Excel to find the best fit linear regression equation in thousands of dollars. Round the slope and intercept to three decimal places. ________________________________________ Yes that's right. Keep it up! ________________________________________ y = 0.433, x=24.493 Answer Explanation Thus, the equation of line of best fit with slope and intercept rounded to three decimal places is yˆ=0.433x+24.493. PREDICITONS USING LINEAR REGRESSION Question The table shows data collected on the relationship between the time spent studying per day and the time spent reading per day. The line of best fit for the data is yˆ=0.16x+36.2. Assume the line of best fit is significant and there is a strong linear relationship between the variables. Studying (Minutes) 507090110 Reading (Minutes) 44485054 (a) According to the line of best fit, what would be the predicted number of minutes spent reading for someone who spent 67 minutes studying? Round your answer to two decimal places. ________________________________________ Yes that's right. Keep it up! ________________________________________ The predicted number of minutes spent reading is $$46.92. Answer Explanation The predicted number of minutes spent reading is 1$$. Correct answers: • 46.92 Substitute 67 for x into the line of best fit to estimate the number of minutes spent reading for someone who spent 67 minutes studying: yˆ=0.16(67)+36.2=46.92. Question The table shows data collected on the relationship between the time spent studying per day and the time spent reading per day. The line of best fit for the data is yˆ=0.16x+36.2. Studying (Minutes) 507090110 Reading (Minutes) 44485054 (a) According to the line of best fit, the predicted number of minutes spent reading for someone who spent 67minutes studying is 46.92. (b) Is it reasonable to use this line of best fit to make the above prediction? ________________________________________ That's incorrect - mistakes are part of learning. Keep trying! ________________________________________ The estimate, a predicted time of 46.92 minutes, is both reliable and reasonable. The estimate, a predicted time of 46.92 minutes, is both unreliable and unreasonable. The estimate, a predicted time of 46.92 minutes, is reliable but unreasonable. The estimate, a predicted time of 46.92 minutes, is unreliable but reasonable. Answer Explanation Correct answer: The estimate, a predicted time of 46.92 minutes, is both reliable and reasonable. The data in the table only includes studying times between 50 and 110 minutes, so the line of best fit gives reliable and reasonable predictions for values of x between 50 and 110. Since 67 is between these values, the estimate is both reliable and reasonable. Your answer: The estimate, a predicted time of 46.92 minutes, is unreliable but reasonable. This estimate is both reliable and reasonable because 67 is inside the range 50 to 110 given in the table. Janet is studying the relationship between the average number of minutes spent exercising per day and math test scores and has collected the data shown in the table. The line of best fit for the data is yˆ=0.46x+66.4. Minutes 15202530 Test Score 73767880 (a) According to the line of best fit, the predicted test score for someone who spent 23 minutes exercising is 76.98. (b) Is it reasonable to use this line of best fit to make the above prediction? ________________________________________ Not quite - review the answer explanation to help get the next one. ________________________________________ The estimate, a predicted test score of 76.98, is reliable and reasonable. The estimate, a predicted test score of 76.98, is unreliable but reasonable. The estimate, a predicted test score of 76.98, is unreliable and unreasonable. The estimate, a predicted test score of 76.98, is reliable but unreasonable. Answer Explanation Correct answer: The estimate, a predicted test score of 76.98, is reliable and reasonable. The data in the table only includes exercise times between 15 and 30 minutes, so the line of best fit gives reliable and reasonable predictions for values of x between 15 and 30. Since 23 is between these values, the estimate is reasonable. Your answer: The estimate, a predicted test score of 76.98, is unreliable and unreasonable. This estimate is reliable, because 23 is inside the range 15 to 30 given in the table. And, it is a realistic score, so it is reasonable. Nomenclature • When using regression lines to make predictions, if the x-value is within the range of observed x-values, one can conclude the prediction is both reliable and reasonable. That is, the prediction is accurate and possible. For example, if a prediction were made using x=1995 in the video above, one could conclude the predicted y-value is both reliable (quite accurate) and reasonable (possible). This is an example of interpolation. • When using regression lines to make predictions, if the x-value is outside the range of observed x-values, one cannot conclude the prediction is both reliable and reasonable. That is, the prediction is will be much less accurate and the prediction may, or may not, be possible. For example, x=2020 is not within the range of 1950 to 2000. Therefore, the prediction is much less reliable (not as accurate) even though it is reasonable (it is possible that a person will live to be 79.72 years old). This is an example of extrapolation. Reasonable Predictions Note that not all predictions are reasonable using a line of best fit. Typically, it is considered reasonable to make predictions for x-values which are between the smallest and largest observed x-values. These are known as interpolated values. Typically, it is considered unreasonable to make predictions for x-values which are not between the smallest and largest observed x-values. These are known as extrapolated values. A scatterplot has a horizontal axis labeled x from 0 to 20 in increments of 1 and a vertical axis labeled y from 0 to 28 in increments of 2. 15 plotted points strictly follow the pattern of a line that rises from left to right and passes through the points left-parenthesis 6 comma 10 right-parentheses, left-parenthesis 8 comma 13 right-parenthesis, and left-parenthesis 14 comma 2 right-parentheses. There are other plotted points at left-parenthesis 10 comma 15 right-parenthesis and left-parenthesis 13 comma 19 right-parenthesis. The regions between the horizontal axis points from 1 to 6 and 14 to 20 are shaded as unreasonable. The region between the horizontal axis points from 6 to 14 is shaded as reasonable. All coordinates are approximate In the figure above, we see that the observed values have x-values ranging from 6 to 14. So it would be reasonable to use the line of best fit to make a prediction for the x value of 9 (because it is between 6 and 14), but it would be unreasonable to make a prediction for the x-value of 20 (because that is outside of the range). Nomenclature • When using regression lines to make predictions, if the x-value is within the range of observed x-values, one can conclude the prediction is both reliable and reasonable. That is, the prediction is accurate and possible. For example, if a prediction were made using x=1995 in the video above, one could conclude the predicted y-value is both reliable (quite accurate) and reasonable (possible). This is an example of interpolation. • When using regression lines to make predictions, if the x-value is outside the range of observed x-values, one cannot conclude the prediction is both reliable and reasonable. That is, the prediction is will be much less accurate and the prediction may, or may not, be possible. For example, x=2020 is not within the range of 1950 to 2000. Therefore, the prediction is much less reliable (not as accurate) even though it is reasonable (it is possible that a person will live to be 79.72 years old). This is an example of extrapolation. Reasonable Predictions Note that not all predictions are reasonable using a line of best fit. Typically, it is considered reasonable to make predictions for x-values which are between the smallest and largest observed x-values. These are known as interpolated values. Typically, it is considered unreasonable to make predictions for x-values which are not between the smallest and largest observed x-values. These are known as extrapolated values. A scatterplot has a horizontal axis labeled x from 0 to 20 in increments of 1 and a vertical axis labeled y from 0 to 28 in increments of 2. 15 plotted points strictly follow the pattern of a line that rises from left to right and passes through the points left-parenthesis 6 comma 10 right-parentheses, left-parenthesis 8 comma 13 right-parenthesis, and left-parenthesis 14 comma 2 right-parentheses. There are other plotted points at left-parenthesis 10 comma 15 right-parenthesis and left-parenthesis 13 comma 19 right-parenthesis. The regions between the horizontal axis points from 1 to 6 and 14 to 20 are shaded as unreasonable. The region between the horizontal axis points from 6 to 14 is shaded as reasonable. All coordinates are approximate In the figure above, we see that the observed values have x-values ranging from 6 to 14. So it would be reasonable to use the line of best fit to make a prediction for the x value of 9 (because it is between 6 and 14), but it would be unreasonable to make a prediction for the x-value of 20 (because that is outside of the range). Question Erin is studying the relationship between the average number of minutes spent reading per day and math test scores and has collected the data shown in the table. The line of best fit for the data is yˆ=0.8x+51.2. According to the line of best fit, what would be the predicted test score for someone who spent 70 minutes reading? Is it reasonable to use this line of best fit to make this prediction? Minutes 3035404550 Test Score 7578858890 ________________________________________ That's not right - let's review the answer. ________________________________________ The predicted test score is 95.2, and the estimate is not reasonable. The predicted test score is 95.2, and the estimate is reasonable. The predicted test score is 107.2, and the estimate is not reasonable. The predicted test score is 107.2, and the estimate is reasonable. Answer Explanation Correct answer: The predicted test score is 107.2, and the estimate is not reasonable. Substitute 70 for x in the line of best fit to estimate the test score for someone who spent 70 minutes reading: yˆ=0.8(70)+51.2=107.2. The data in the table only includes reading times between 30 and 50 minutes, so the line of best fit only gives reasonable predictions for values of x between 30 and 50. Since 70 is far outside of this range of values, the estimate is not reasonable. Another thing to notice is that it predicts a test score of greater than 100, which is typically impossible. Your answer: The predicted test score is 107.2, and the estimate is reasonable. The predicted value is not reasonable because the value of 70 minutes is not between 30 and 50minutes. Question Data is collected on the relationship between the average number of minutes spent exercising per day and math test scores. The data is shown in the table and the line of best fit for the data is yˆ=0.42x+64.6. Assume the line of best fit is significant and there is a strong linear relationship between the variables. Minutes 25303540 Test Score 75778081 (a) According to the line of best fit, what would be the predicted test score for someone who spent 38 minutes exercising? Round your answer to two decimal places. ________________________________________ Well done! You got it right. ________________________________________ The predicted test score is $$80.56. Answer Explanation The predicted test score is 1$$. Correct answers: • 1$80.56$80.56 Substitute 38 for x into the line of best fit to estimate the test score for someone who spent 38 minutes exercising: yˆ=0.42(38)+64.6=80.56. Question Data is collected on the relationship between the average number of minutes spent exercising per day and math test scores. The data is shown in the table and the line of best fit for the data is yˆ=0.42x+64.6. Minutes 25303540 Test Score 75778081 (a) According to the line of best fit, the predicted test score for someone who spent 38 minutes exercising is 80.56. (b) Is it reasonable to use this line of best fit to make the above prediction? ________________________________________ Perfect. Your hard work is paying off ? ________________________________________ The estimate, a predicted test score of 80.56, is both reliable and reasonable. The estimate, a predicted test score of 80.56, is reliable but unreasonable. The estimate, a predicted test score of 80.56, is both unreliable and unreasonable. The estimate, a predicted test score of 80.56, is unreliable but reasonable. Answer Explanation Correct answer: The estimate, a predicted test score of 80.56, is both reliable and reasonable. The data in the table only includes exercise times between 25 and 40 minutes, so the line of best fit gives reasonable predictions for values of x between 25 and 40. Since 38 is between these values, the estimate is both reliable and reasonable. Question Data is collected on the relationship between the average daily temperature and time spent watching television. The data is shown in the table and the line of best fit for the data is y^=−0.81x+96.7. Assume the line of best fit is significant and there is a strong linear relationship between the variables. Temperature (Degrees) 30405060 Minutes Watching Television 73635748 (a) According to the line of best fit, what would be the predicted number of minutes spent watching television for an average daily temperature of 45 degrees? Round your answer to two decimal places. Answer 1: ________________________________________ That's not right - let's review the answer. ________________________________________ The predicted number of minutes spent watching television is $$133.15. Answer 2: ________________________________________ Keep trying - mistakes can help us grow. ________________________________________ The predicted number of minutes spent watching television is $$133.15. Answer Explanation The predicted number of minutes spent watching television is 1$$. Correct answers: • 1$60.25$60.25 Substitute 45 for x into the line of best fit to estimate the number of minutes spent watching television for an average daily temperature of 45 degrees: y^=−0.81(45)+96.7=60.25. Question Data is collected on the relationship between the average daily temperature and time spent watching television. The data is shown in the table and the line of best fit for the data is y^=−0.81x+96.7. Temperature (Degrees) 30405060 Minutes Watching Television 73635748 (a) According to the line of best fit, the predicted number of minutes spent watching television for an average daily temperature of 45 degrees is 60.25. (b) Is it reasonable to use this line of best fit to make the above prediction? ________________________________________ Correct! You nailed it. ________________________________________ The estimate, a predicted time of 60.25 minutes, is unreliable but reasonable. The estimate, a predicted time of 60.25 minutes, is both reliable and reasonable. The estimate, a predicted time of 60.25 minutes, is both unreliable and unreasonable. The estimate, a predicted time of 60.25 minutes, is reliable but unreasonable. Answer Explanation Correct answer: The estimate, a predicted time of 60.25 minutes, is both reliable and reasonable. The data in the table only includes temperatures between 30 and 60 degrees, so the line of best fit only gives reliable and reasonable predictions for values of x between 30 and 60. Since 45 is between these values, the estimate is both reliable and reasonable. Question Homer is studying the relationship between the average daily temperature and time spent watching television and has collected the data shown in the table. The line of best fit for the data is yˆ=−0.6x+94.5. Assume the line of best fit is significant and there is a strong linear relationship between the variables. Temperature (Degrees) 40506070 Minutes Watching Television 70655952 (a) According to the line of best fit, what would be the predicted number of minutes spent watching television for an average daily temperature of 39 degrees? Round your answer to two decimal places, as needed. ________________________________________ Yes that's right. Keep it up! ________________________________________ The predicted number of minutes spent watching television is $$71.1. Answer Explanation The predicted number of minutes spent watching television is 1$$. Correct answers: • 1$71.1$71.1 Substitute 39 for x into the line of best fit to estimate the number of minutes spent watching television for an average daily temperature of 39 degrees: yˆ=−0.6(39)+94.5=71.1. Question Homer is studying the relationship between the average daily temperature and time spent watching television and has collected the data shown in the table. The line of best fit for the data is yˆ=−0.6x+94.5. Temperature (Degrees) 40506070 Minutes Watching Television 70655952 (a) According to the line of best fit, the predicted number of minutes spent watching television for an average daily temperature of 39 degrees is 71.1. (b) Is it reasonable to use this line of best fit to make the above prediction? ________________________________________ Not quite - review the answer explanation to help get the next one. ________________________________________ The estimate, a predicted time of 71.1 minutes, is both unreliable and unreasonable. The estimate, a predicted time of 71.1 minutes, is both reliable and reasonable. The estimate, a predicted time of 71.1 minutes, is unreliable but reasonable. The estimate, a predicted time of 71.1 minutes, is reliable but unreasonable. Answer Explanation Correct answer: The estimate, a predicted time of 71.1 minutes, is unreliable but reasonable. The data in the table only includes temperatures between 40 and 70 degrees, so the line of best fit gives reliable and reasonable predictions for values of x between 40 and 70. Since 39 is not between these values, the estimate is not reliable. However, 71.1 minutes is a reasonable time. Your answer: The estimate, a predicted time of 71.1 minutes, is both reliable and reasonable. This estimate is not reliable, because 39 is outside of the range 40 to 70 given in the table. Question Daniel owns a business consulting service. For each consultation, he charges $95 plus $70 per hour of work. A linear equation that expresses the total amount of money Daniel earns per consultation is y=70x+95. What are the independent and dependent variables? What is the y-intercept and the slope? ________________________________________ Keep trying - mistakes can help us grow. ________________________________________ The independent variable (x) is the amount, in dollars, Daniel earns for a consultation. The dependent variable (y) is the amount of time Daniel consults. Daniel charges a one-time fee of $95 (this is when x=0), so the y-intercept is 95. Daniel earns $70 for each hour he works, so the slope is 70. The independent variable (x) is the amount of time Daniel consults. The dependent variable (y) is the amount, in dollars, Daniel earns for a consultation. Daniel charges a one-time fee of $95 (this is when x=0), so the y-intercept is 95. Daniel earns $70 for each hour he works, so the slope is 70. The independent variable (x) is the amount, in dollars, Daniel earns for a consultation. The dependent variable (y) is the amount of time Daniel consults. Daniel charges a one-time fee of $70 (this is when x=0), so the y-intercept is 70. Daniel earns $95 for each hour he works, so the slope is 95. The independent variable (x) is the amount of time Daniel consults. The dependent variable (y) is the amount, in dollars, Daniel earns for a consultation. Daniel charges a one-time fee of $70 (this is when x=0), so the y-intercept is 70. Daniel earns $95 for each hour he works, so the slope is 95. Answer Explanation Correct answer: The independent variable (x) is the amount of time Daniel consults. The dependent variable (y) is the amount, in dollars, Daniel earns for a consultation. Daniel charges a one-time fee of $95 (this is when x=0), so the y-intercept is 95. Daniel earns $70 for each hour he works, so the slope is 70. The independent variable (x) is the amount of time Daniel consults because it is the value that changes. He may work different amounts per consultation, and his earnings are dependent on how many hours he works. This is why the amount, in dollars, Daniel earns for a consultation is the dependent variable (y). The y-intercept is 95 (b=95). This is his one-time fee. The slope is 70 (a=70). This is the increase for each hour he works. Your answer: The independent variable (x) is the amount of time Daniel consults. The dependent variable (y) is the amount, in dollars, Daniel earns for a consultation. Daniel charges a one-time fee of $70 (this is when x=0), so the y-intercept is 70. Daniel earns $95 for each hour he works, so the slope is 95. Question Given the following line, find the value of y when x=2. y=−4x−12 ________________________________________ Well done! You got it right. ________________________________________ $$y=−20 Answer Explanation Correct answers: • $y=-20$y=−20 Substituting x=2 in the equation, and simplifying to find y, we find y=−4x−12=−4(2)−12=−8−12=−20 Question Evaluate the linear equation, y=4x−7, at the value x=2. ________________________________________ Yes that's right. Keep it up! ________________________________________ $$y=1 Answer Explanation Correct answers: • $y=1$y=1 To evaluate a linear equation at a specific value, substitute the value x=2 into the equation for the variable, x. yyyy=4x−7=4(2)−7=8−7=1 Question Evan owns a house cleaning service. For each house visit, he charges $55 plus $30 per hour of work. A linear equation that expresses the total amount of money Evan earns per visit is y=55+30x. What are the independent and dependent variables? What is the y-intercept and the slope? ________________________________________ Perfect. Your hard work is paying off ? ________________________________________ The independent variable (x) the amount, in dollars, Evan earns for each session. The dependent variable (y) is the amount of time Evan works each house visit. At the start of the repairs, Evan charges a one-time fee of $55 (this is when x=0), so the y-intercept is 55. Evan earns $30 for each hour he works, so the slope is 30. The independent variable (x) is the amount of time Evan works each house visit. The dependent variable (y) is the amount, in dollars, Evan earns for each session. At the start of the repairs, Evan charges a one-time fee of $55 (this is when x=0), so the y-intercept is 55. Evan earns $30 for each hour he works, so the slope is 30. The independent variable (x) the amount, in dollars, Evan earns for each session. The dependent variable (y) is the amount of time Evan works each house visit. At the start of the repairs, Evan charges a one-time fee of $30 (this is when x=0), so the y-intercept is 30. Evan earns $55 for each hour he works, so the slope is 55. The independent variable (x) is the amount of time Evan works each house visit. The dependent variable (y) is the amount, in dollars, Evan earns for each session. At the start of the repairs, Evan charges a one-time fee of $30 (this is when x=0), so the y-intercept is 30. Evan earns $55 for each hour he works, so the slope is 55. Answer Explanation Correct answer: The independent variable (x) is the amount of time Evan works each house visit. The dependent variable (y) is the amount, in dollars, Evan earns for each session. At the start of the repairs, Evan charges a one-time fee of $55 (this is when x=0), so the y-intercept is 55. Evan earns $30 for each hour he works, so the slope is 30. The independent variable (x) is the amount of time Evan works each house visit because it is the value that changes. He may work different amounts per day, and his earnings are dependent on how many hours he works. This is why the amount, in dollars Evan earns for each session is the dependent variable (y). The y-intercept is 55 (b=55). This is his one-time fee. The slope is 30 (a=30). This is the increase for each hour he works Question Using a calculator or statistical software, find the linear regression line for the data in the table below. Enter your answer in the form y=mx+b, with m and b both rounded to two decimal places. x y 0 2.12 1 2.19 2 1.92 3 2.79 4 3.81 5 4.72 HelpCopy to ClipboardDownload CSV Answer 1: ________________________________________ Keep trying - mistakes can help us grow. ________________________________________ $$y=0.53x+1.58 Answer 2: ________________________________________ Keep trying - mistakes can help us grow. ________________________________________ $$y=0.53x+1.59 Answer Explanation Correct answers: • $y=0.54x+1.59$y=0.54x+1.59 If you use a TI-83 or TI-84 calculator, you press STAT, and then ENTER, which brings you to the edit menu where you can enter values. In the L1 list, you enter the values of x from the table above, 0,1,2,3,4,5. Then, in the L2 list, you enter the values of y from the table above, 2.12,2.19,1.92,2.79,3.81,4.72. Now, press STAT again, and arrow to the right, to CALC. Arrow down to the LinReg option and press ENTER. The resulting a and b are the slope m and y-intercept b of the linear regression line. You should find that m≈0.54 and b≈1.59. So the final answer is y=0.54x+1.59 Using spreadsheet software or other statistical software should give you the same result. Question Using a calculator or statistical software, find the linear regression line for the data in the table below. Enter your answer in the form y=mx+b, with m and b both rounded to two decimal places. x y 0 2.83 1 3.33 2 6.99 3 8.01 4 7.62 5 7.66 HelpCopy to ClipboardDownload CSV ________________________________________ Perfect. Your hard work is paying off ? ________________________________________ $$y=1.09x+3.36 Answer Explanation Correct answers: • $y=1.09x+3.36$y=1.09x+3.36 If you use a TI-83 or TI-84 calculator, you press STAT, and then ENTER, which brings you to the edit menu where you can enter values. In the L1 list, you enter the values of x from the table above, 0,1,2,3,4,5. Then, in the L2 list, you enter the values of y from the table above, 2.83,3.33,6.99,8.01,7.62,7.66. Now, press STAT again, and arrow to the right, to CALC. Arrow down to the LinReg option and press ENTER. The resulting a and b are the slope m and y-intercept b of the linear regression line. You should find that m≈1.09 and b≈3.36. So the final answer is y=1.09x+3.36 Using spreadsheet software or other statistical software should give you the same result. Question A least squares regression line (best-fit line) has the equation, yˆ=2.87x−43.5. What is the slope of this linear regression equation? ________________________________________ Great work! That's correct. ________________________________________ The slope of the line is 2.87, which tells us that the dependent variable (y) decreases 2.87 for every one unit increase in the independent (x) variable, on average. The slope of the line is 2.87, which tells us that the dependent variable (y) increases 2.87 for every one unit increase in the independent (x) variable, on average. The slope of the line is −43.5, which tells us that the dependent variable (y) increases 43.5 for every one unit increase in the independent (x) variable, on average. The slope of the line is −43.5, which tells us that the dependent variable (y) decreases 43.5 for every one unit increase in the independent (x) variable, on average. Answer Explanation Correct answer: The slope of the line is 2.87, which tells us that the dependent variable (y) increases 2.87 for every one unit increase in the independent (x) variable, on average. Question Researchers want to find the relationship between age and average weight in female children. Using a calculator or statistical software, find the linear regression line for the 2012 CDC data below for average weights of female children by age. age (years) weight (lbs) 1 24.1 2 29.5 3 34.5 4 39.1 5 46.6 6 51.9 7 59.1 ________________________________________ Well done! You got it right. ________________________________________ y=5.78x+17.56 y=1.0x+15.69 y=−5.78x+14.32 y=1.0x+15.55 Answer Explanation Correct answer: y=5.78x+17.56 If you use a TI-83 or TI-84 calculator, you press STAT, and then ENTER, which brings you to the edit menu where you can enter values. In the L1 list, you enter the values of x from the table above, 1,2,3,4,5,6,7. Then, in the L2 list, you enter the values of y from the table above. Now, press STAT again, and arrow to the right, to CALC. Arrow down to the LinReg option and press ENTER. The resulting a and b are the slope a and y-intercept b of the linear regression line. You should find that a≈5.78 and b≈17.56. So the final answer is y=5.78x+17.56 Using spreadsheet software or other statistical software should give you the same result. Question Given that n=31 data points are collected when studying the relationship between average daily temperature and time spent sleeping, use the critical values table below to determine if a calculated value of r=−0.324 is significant or not. df CV (+ and -) df CV (+ and -) df CV (+ and -) df CV (+ and -) 1 0.997 11 0.555 21 0.413 40 0.304 2 0.950 12 0.532 22 0.404 50 0.273 3 0.878 13 0.514 23 0.396 60 0.250 4 0.811 14 0.497 24 0.388 70 0.232 5 0.754 15 0.482 25 0.381 80 0.217 6 0.707 16 0.468 26 0.374 90 0.205 7 0.666 17 0.456 27 0.367 100 0.195 8 0.632 18 0.444 28 0.361 9 0.602 19 0.433 29 0.355 10 0.576 20 0.423 30 0.349 ________________________________________ Not quite - review the answer explanation to help get the next one. ________________________________________ r is significant because it is between the positive and negative critical values. r is not significant because it is between the positive and negative critical values. r is significant because it is not between the positive and negative critical values. r is not significant because it is not between the positive and negative critical values. Answer Explanation Correct answer: r is not significant because it is between the positive and negative critical values. There are n−2=31−2=29 degrees of freedom. Looking at the table of critical values, the critical values corresponding to df=29 are −0.355 and 0.355. Since the value of r is between −0.355 and 0.355, r is not significant. Your answer: r is not significant because it is not between the positive and negative critical values. r=−0.324 is between the critical values −0.355<−0.324<0.355. Therefore, r is between the critical values. Question In studying the relationship between age and eating fast food, suppose you computed r=0.133 using n=19 data points. Using the critical values table below, determine if the value of r is significant or not. df CV (+ and -) df CV (+ and -) df CV (+ and -) df CV (+ and -) 1 0.997 11 0.555 21 0.413 40 0.304 2 0.950 12 0.532 22 0.404 50 0.273 3 0.878 13 0.514 23 0.396 60 0.250 4 0.811 14 0.497 24 0.388 70 0.232 5 0.754 15 0.482 25 0.381 80 0.217 6 0.707 16 0.468 26 0.374 90 0.205 7 0.666 17 0.456 27 0.367 100 0.195 8 0.632 18 0.444 28 0.361 9 0.602 19 0.433 29 0.355 10 0.576 20 0.423 30 0.349 ________________________________________ Great work! That's correct. ________________________________________ r is significant because it is between the positive and negative critical values. r is not significant because it is between the positive and negative critical values. r is significant because it is not between the positive and negative critical values. r is not significant because it is not between the positive and negative critical values. Answer Explanation Correct answer: r is not significant because it is between the positive and negative critical values. There are n−2=19−2=17 degrees of freedom. Looking at the table of critical values, the critical values corresponding to df=17 are −0.456 and 0.456. Since the value of r is between −0.456 and 0.456, r is not significant. Question Data is collected on the relationship between the time spent doing homework per day and the time spent taking notes per day. The data is shown in the table and the line of best fit for the data is yˆ=0.175x+31.0. Assume the line of best fit is significant and there is a strong linear relationship between the variables. Doing Homework (Minutes) Taking Notes (Minutes) 80 45 100 49 120 51 140 56 (a) According to the line of best fit, what would be the predicted number of minutes spent taking notes for someone who spent 137 minutes doing homework? Round your answer to two decimal places, as needed. ________________________________________ Perfect. Your hard work is paying off ? ________________________________________ The estimate, a predicted time of 54.98 minutes, is both reliable and reasonable. Substitute 137 for x into the line of best fit to estimate the number of minutes spent taking notes for someone who spent 137 minutes doing homework yˆ=0.175 * 137 +31.0≈54.98. Question Michelle is studying the relationship between the hours worked (per week) and time spent reading (per day) and has collected the data shown in the table. The line of best fit for the data is yˆ=−0.79x+98.8. Assume the line of best fit is significant and there is a strong linear relationship between the variables. Hours Worked (per week) 30405060 Minutes Reading (per day) 75685852 (a) According to the line of best fit, what would be the predicted number of minutes spent reading for a person who works 27 hours (per week)? Round your answer to two decimal places, as needed. ________________________________________ Well done! You got it right. ________________________________________ The predicted number of minutes spent reading is 77.47. Answer Explanation The predicted number of minutes spent reading is 1$$. Substitute 27 for x into the line of best fit to estimate the number of minutes spent reading for a person who works 27hours (per week): yˆ=−0.79(27)+98.8=77.47. Question Michelle is studying the relationship between the hours worked (per week) and time spent reading (per day) and has collected the data shown in the table. The line of best fit for the data is yˆ=−0.79x+98.8. Hours Worked (per week) 30405060 Minutes Reading (per day) 75685852 (a) According to the line of best fit, the predicted number of minutes spent reading for a person who works 27 hours (per week) is 77.47. (b) Is it reasonable to use this line of best fit to make the above prediction? ________________________________________ Not quite - review the answer explanation to help get the next one. ________________________________________ The estimate, a predicted time of 77.47 minutes, is unreliable but reasonable. The estimate, a predicted time of 77.47 minutes, is reliable but unreasonable. The estimate, a predicted time of 77.47 minutes, is both unreliable and unreasonable. The estimate, a predicted time of 77.47 minutes, is both reliable and reasonable. Answer Explanation Correct answer: The estimate, a predicted time of 77.47 minutes, is unreliable but reasonable. The data in the table only includes the time worked between 30 and 60 hours, so the line of best fit gives reliable and reasonable predictions for values of x between 30 and 60. Since 27 is not between these values, the estimate is not reliable. However, 77.47 minutes is a reasonable time. Your answer: The estimate, a predicted time of 77.47 minutes, is reliable but unreasonable. This estimate is not reliable, because 27 is outside of the range 30 to 60 given in the table. And, it is a realistic time, so it is reasonable. Question The table shows data collected on the relationship between time spent playing video games and time spent with family. The line of best fit for the data is yˆ=−0.24x+71.7. Assume the line of best fit is significant and there is a strong linear relationship between the variables. Video Games (Minutes) 45607590 Time with Family (Minutes) 61575450 (a) According to the line of best fit, what would be the predicted number of minutes spent with family for someone who spent 87 minutes playing video games? Round your answer to two decimal places. Answer 1: ________________________________________ That's not right - let's review the answer. ________________________________________ The predicted number of minutes spent with family is $$92.58. Answer 2: ________________________________________ Great work! That's correct. ________________________________________ The predicted number of minutes spent with family is 50.82. Answer Explanation Substitute 87 for x into the line of best fit to estimate the number of minutes spent with family for someone who spent 87minutes playing video games: yˆ=−0.24(87)+71.7=50.82. Question The table shows data collected on the relationship between time spent playing video games and time spent with family. The line of best fit for the data is yˆ=−0.24x+71.7. Video Games (Minutes) 45607590 Time with Family (Minutes) 61575450 (a) According to the line of best fit, the predicted number of minutes spent with family for someone who spent 87 minutes playing video games is 50.82. (b) Is it reasonable to use this line of best fit to make the above prediction? ________________________________________ Great work! That's correct. ________________________________________ The estimate, a predicted time of 50.82 minutes, is unreliable but reasonable. The estimate, a predicted time of 50.82 minutes, is reliable but unreasonable. The estimate, a predicted time of 50.82 minutes, is both reliable and reasonable. The estimate, a predicted time of 50.82 minutes, is both unreliable and unreasonable. Answer Explanation Correct answer: The estimate, a predicted time of 50.82 minutes, is both reliable and reasonable. The data in the table only includes video game times between 45 and 90 minutes, so the line of best fit gives reliable and reasonable predictions for values of x between 45 and 90. Since 87 is between these values, the estimate is both reliable and reasonable. Coefficient of Determination A medical experiment on tumor growth gives the following data table. x y 57 38 61 50 63 76 68 97 72 113 The least squares regression line was found. Using technology, it was determined that the total sum of squares (SST) was 3922.8 and the sum of squares of regression (SSR) was 3789.0. Calculate R2, rounded to three decimal places. ________________________________________ Great work! That's correct. ________________________________________ 0.966 Answer Explanation Correct answers: • $0.966$0.966 R2=SSRSST R2=3789.03922.8 R2=0.966 A scientific study on mesothelioma caused by asbestos gives the following data table. Micrograms of asbestos inhaled Area of scar tissue (cm2) 58 162 62 189 63 188 67 215 70 184 Using technology, it was determined that the total sum of squares (SST) was 1421.2 and the sum of squares due to error (SSE) was 903.51. Calculate R2 and determine its meaning. Round your answer to four decimal places. ________________________________________ Correct! You nailed it. ________________________________________ R2=0.3643 Therefore, 36.43% of the variation in the observed y-values can be explained by the estimated regression equation. R2=0.3643 Therefore, 0.3643% of the variation in the observed y-values can be explained by the estimated regression equation. R2=0.6357 Therefore, 63.57% of the variation in the observed y-values can be explained by the estimated regression equation. R2=0.6357 Therefore, 0.6357% of the variation in observed y-values can be explained by the estimated regression equation. Answer Explanation Correct answer: R2=0.3643 Therefore, 36.43% of the variation in the observed y-values can be explained by the estimated regression equation. R2=1−SSESST R2=1−903.511421.2 R2=1−0.6357 R2=0.3643 R2=36.43% A scientific study on speed limits gives the following data table. Average speed limit Average annual fatalities 25 16 27 29 29 38 32 71 35 93 Using technology, it was determined that the total sum of squares (SST) was 4029.2, the sum of squares regression (SSR) was 3968.4, and the sum of squares due to error (SSE) was 60.835. Calculate R2 and determine its meaning. Round your answer to four decimal places. ________________________________________ Perfect. Your hard work is paying off ? ________________________________________ R2=0.0153 Therefore, 1.53% of the variation in the observed y-values can be explained by the estimated regression equation. R2=0.9849 Therefore, 98.49% of the variation in the observed y-values can be explained by the estimated regression equation. R2=0.0151 Therefore, 1.51% of the variation in the observed y-values can be explained by the estimated regression equation. R2=1.0153 Therefore, 10.153% of the variation in the observed y-values can be explained by the estimated regression equation. Answer Explanation Correct answer: R2=0.9849 Therefore, 98.49% of the variation in the observed y-values can be explained by the estimated regression equation. R2=SSRSST R2=3968.44029.2 R2=0.9849 R2=98.49% Question A scientific study on calorie intake gives the following data table. Calorie intake (1000) Hours of exercise need to maintain weight 6 13 7 12 10 17 14 15 17 23 Using technology, it was determined that the total sum of squares (SST) was 76, the sum of squares regression (SSR)was 54.850, and the sum of squares due to error (SSE) was 21.150. Calculate R2 and determine its meaning. Round your answer to four decimal places? ________________________________________ Great work! That's correct. ________________________________________ R2=0.3856 Therefore, 38.56% of the variation in the observed y-values can be explained by the estimated regression equation. R2=0.7217 Therefore, 72.17% of the variation in the observed y-values can be explained by the estimated regression equation. R2=1.3856 Therefore, 13.856% of the variation in the observed y-values can be explained by the estimated regression equation. R2=0.2783 Therefore, 27.83% of the variation in the observed y-values can be explained by the estimated regression equation. Answer Explanation Correct answer: R2=0.7217 Therefore, 72.17% of the variation in the observed y-values can be explained by the estimated regression equation. R2=SSRSST R2=54.86176.012 R2=0.7217 R2=72.17% Correlation and Causation True or False: The more mangoes you eat, the more rashes you get. ________________________________________ Correct! You nailed it. ________________________________________ True False Answer Explanation Correct answer: False Many things can cause an increase or decrease in rashes: diet, exercise, hormones, medication, etc. There are too many other confounding variables that it can not be determined that Mango's are the cause of a rash. The scatter plot below shows data for the number of sea turtles (y) tagged by scientists in a given year, where x is the year. The least squares regression line is given by yˆ=917,234−444x. A coordinate plane has a horizontal x-axis labeled Year from 2002 to 2010 in increments of 2 and a vertical y-axis labeled Number of sea turtles from 20,000 to 30,000 in increments of 2000. The following points are plotted: left-parenthesis 2003 comma 28,500 right-parenthesis, left-parenthesis 2005 comma 25,000 right-parenthesis, left-parenthesis 2007 comma 27,500 right-parenthesis, left-parenthesis 2009 comma 27,000 right-parenthesis, and left-parenthesis 2010 comma 25,000 right-parenthesis. A line falls from left to right, passing through left-parenthesis 2003 comma 28,500 right-parenthesis and left-parenthesis 2010 comma 25,000 right-parenthesis. All coordinate are approximate. Interpret the y-intercept of the least squares regression line. ________________________________________ Perfect. Your hard work is paying off ? ________________________________________ The predicted number of sea turtles tagged by scientists in the year 0 is 917,234. The predicted number of sea turtles tagged by scientists in the year 2000 is −444. The predicted number of sea turtles tagged by scientists in the year 2002 is 917,234. The y-intercept should not be interpreted. Answer Explanation Correct answer: The y-intercept should not be interpreted. Scientists did not tag sea turtles in the year 2000, so it is not appropriate to interpret the y-intercept Suppose that data collected from police reports of motor vehicle crashes show a moderate positive correlation between the speed of the motor vehicle at the time of the crash and the severity of injuries to the driver. Answer the following question based only on this information. True or false: It can be concluded that the faster a motor vehicle is traveling at the time of a crash, the more severe the injuries to the driver are. ________________________________________ Correct! You nailed it. ________________________________________ True False Answer Explanation Correct answer: False Correlation does not prove causation. The provided information shows that there is a positive association between speed and severity of injuries, but that information alone is not sufficient to conclude that greater speed causes more severe injuries. Based only on this information, there could be a third variable associated with speed that causes more severe injuries in crashes. That said, the statement "the faster a motor vehicle is traveling at the time of a crash, the more severe the injuries to the driver are" does not imply a causal relationship between speed and severity of injuries. Which of the following data sets or plots could have a regression line with a negative slope? Select all that apply. ________________________________________ Great work! That's correct. ________________________________________ • the difference in the number of ships launched by competing ship builders as a function of the number of months since the start of last year • the number of hawks sighted per day as a function of the number of days since the two-week study started • the total number of ships launched by a ship builder as a function of the number of months since the start of last year • the average number of hawks sighted per day in a series of studies as a function of the number of days since the ten-week study started Answer Explanation Correct answer: the difference in the number of ships launched by competing ship builders as a function of the number of months since the start of last year the number of hawks sighted per day as a function of the number of days since the two-week study started the average number of hawks sighted per day in a series of studies as a function of the number of days since the ten-week study started The slope is related to the increase or decrease of the dependent variable as a function of the independent variable. If the dependent variable can decrease, then the slope can be negative, such as with the difference in the number of ships launched. Suppose that a large controlled experiment tests whether caffeine improves reaction times. A very large number of randomly selected participants are randomly given identical-seeming pills with varying doses of caffeine (including none) and then given tests of reaction times under the same conditions. The experiment finds a strong negative correlation between caffeine dose and reaction time. (Note that lower reaction times are better.) Identify what can be concluded based on this information. ________________________________________ Great work! That's correct. ________________________________________ There is evidence that caffeine causes lower (better) reaction times. People with lower (better) reaction times generally choose to consume more caffeine. Lower reaction times are associated with higher caffeine doses, but this study provides no evidence that caffeine causes lower reaction times. There is no relationship between reaction time and caffeine. Answer Explanation Correct answer: There is evidence that caffeine causes lower (better) reaction times. Correlation alone does not prove causation, but this scenario provides more evidence than just correlation between two variables. Since the data were obtained from an appropriately randomized controlled experiment, a correlation can be used as evidence of a causal relationship. Since all other variables were controlled, there is no third variable that could be associated with caffeine that actually causes differences in reaction times. Question A non-profit finds that donations decrease when the economy measured by GDP decreases. Identify the relation between donations and GDP. ________________________________________ Great work! That's correct. ________________________________________ Donations and GDP are positively correlated. Donations and GDP are negatively correlated. A decrease in donations causes a decrease in GDP. A decrease in GDP causes a decrease in donations. Answer Explanation Correct answer: Donations and GDP are positively correlated. A decrease in donations is associated with a decrease in GDP, which implies a positive relationship. There would need to be more evidence to prove causation. Question Which of the following data sets or plots could have a regression line with a negative slope. Answer Explanation Correct answer: the number of miles a ship has traveled each year as a function of the number of years since it was launched the number of cats living in an abandoned lot as a function of the number of years since the building was torn down the number of cats born each year in an abandoned lot as a function of the number of years since the building was torn down The slope is related to the increase or decrease of the dependent variable as a function of the independent variable. If the dependent variable can decrease, then the slope can be negative, such as with the number of cats born each year. Your answer: the number of miles a ship has traveled as a function of the number of years since it was launched The distance a ship has traveled can only increase, so the slope of the line can only be positive. the number of miles a ship has traveled each year as a function of the number of years since it was launched the number of cats born each year in an abandoned lot as a function of the number of years since the building was torn down Which of the following data sets or plots could have a regression line with a negative slope? Select all that apply. ________________________________________ Perfect. Your hard work is paying off ? ________________________________________ • the number of tons of trash a dump truck has hauled as a function of the number of years since it was built • ________________________________________ • the number of people who work on a dump truck as a function of the number of years since it was built • ________________________________________ • the number of people who have worked on a dump truck as a function of the number of years since it was built • • the highest number of tons of trash any dump truck has hauled during the year as a function of the number of years since 1955 • ________________________________________ Answer Explanation Correct answer: 2. the number of people who work on a dump truck as a function of the number of years since it was built 4. the highest number of tons of trash any dump truck has hauled during the year as a function of the number of years since 1955 The slope is related to the increase or decrease of the dependent variable as a function of the independent variable. If the dependent variable can decrease, then the slope can be negative, such as with the number of people who work on a dump truck or the amount of trash a dump truck hauls. Linear Regression Equations The scatter plot below shows data relating competitive chess players' ratings and their IQ. Which of the following patterns does the scatter plot show? Correct! You nailed it. ________________________________________ positive linear pattern positive linear pattern with deviations negative linear pattern negative linear pattern with deviations no pattern Answer Explanation Correct answer: no pattern Here, there is no visible pattern or relationship between the x-values (IQ) and y-values (chess ratings). Jamie owns a house painting service. For each house, she charges $70 plus $40 per hour of work. A linear equation that expresses the total amount of money Jamie earns per house is y=70+40x. What are the independent and dependent variables? What is the y-intercept and the slope? ________________________________________ Well done! You got it right. ________________________________________ The independent variable (x) is the amount, in dollars, Jamie earns for a house. The dependent variable (y) is the amount of time Jamie paints a house. Jamie charges a one-time fee of $40 (this is when x=0), so the y-intercept is 40. Jamie earns $70 for each hour she works, so the slope is 70. The independent variable (x) is the amount, in dollars, Jamie earns for a house. The dependent variable (y) is the amount of time Jamie paints a house. Jamie charges a one-time fee of $70 (this is when x=0), so the y-intercept is 70. Jamie earns $40 for each hour she works, so the slope is 40. The independent variable (x) is the amount of time Jamie paints a house. The dependent variable (y) is the amount, in dollars, Jamie earns for a house. Jamie charges a one-time fee of $40 (this is when x=0), so the y-intercept is 40. Jamie earns $70 for each hour she works, so the slope is 70. The independent variable (x) is the amount of time Jamie paints a house. The dependent variable (y) is the amount, in dollars, Jamie earns for a house. Jamie charges a one-time fee of $70 (this is when x=0), so the y-intercept is 70. Jamie earns $40 for each hour she works, so the slope is 40. Answer Explanation Correct answer: The independent variable (x) is the amount of time Jamie paints a house. The dependent variable (y) is the amount, in dollars, Jamie earns for a house. Jamie charges a one-time fee of $70 (this is when x=0), so the y-intercept is 70. Jamie earns $40 for each hour she works, so the slope is 40. The independent variable (x) is the amount of time Jamie paints a house because it is the value that changes. She may work different amounts per house, and her earnings are dependent on how many hours she works. This is why the amount, in dollars, Jamie earns for a house is the dependent variable (y). The y-intercept is 70 (b=70). This is her one-time fee. The slope is 40 (a=40). This is the increase for each hour she works. George is an avid plant lover and is concerned about the lack of daffodils that grow in his backyard. He finds the growth of the daffodils, G, is dependent on the percent of aluminum measured in the soil, x, and can be modeled by the function G(x)=16−4x. Draw the graph of the growth function by plotting its G-intercept and another point. ________________________________________ Correct! You nailed it. ________________________________________ 0, 16 4, 0 Answer Explanation $$0, 16 $$7, −12 The function G(x)=16−4x is a linear equation, so its graph is a straight line that can be drawn by plotting 2 points and connecting them. Its G intercept occurs when x=0, so G(0)=16, and (0,16) is the G-intercept. To find another point, plug in another x value into the function G(x). For example, when x=7, we have G(7)=16−4(7)=−12. So, (7,−12) is another point on the graph of G(x). What percent of aluminum in the soil must there be for the daffodils to grow only by 5 centimeters? • Round your final answer to the nearest whole number. ________________________________________ Great work! That's correct. ________________________________________ 3 percent Answer Explanation For the daffodils to grow only by 5 centimeters, the growth must be 5. So, we must find the percent of aluminum in the soil, x, so that G(x)=5. For G(x)=5, we have 16−4x=5, −4x=−11, x=−11/−4, x=2.75, x≈3. The scatter plot below shows data relating total income and the number of children a family has. Which of the following patterns does the scatter plot show? A scatterplot has a horizontal axis labeled Number of children from negative 1 to 7 in increments of 1 and a vertical axis labeled Income left-parenthesis thousands right-parentheses from 0 to 200 in increments of 50. A series of plotted points loosely forms a line that falls from left to right and passes through the points left-parenthesis 0 comma 180 right-parentheses and left-parenthesis 6 comma 25 right-parentheses. All coordinates are approximate. ________________________________________ Perfect. Your hard work is paying off ? ________________________________________ Positive linear pattern Positive linear pattern with deviations Negative linear pattern Negative linear pattern with deviations No pattern Answer Explanation Correct answer: Negative linear pattern with deviations We can see that as the x-values (number of children) increase, the y-values (income) decrease. So it is a negative relationship. But there are points that deviate from the negative linear pattern, so it is a weaker pattern, instead of a strong one. Question A gym teacher finds that the distance students run in miles per week in gym class, D, is dependent on the time students warm-up beforehand in minutes per week, x, and can be modeled by the function D(x)=2+0.5x. Draw the graph of the distance function by plotting its D-intercept and another point. Answer 1: ________________________________________ That's not right - let's review the answer. ________________________________________ $$0, 14 $$11, 3 Answer 2: ________________________________________ Not quite - review the answer explanation to help get the next one. ________________________________________ 0, 14 11, 3 Answer Explanation 0, 2 6, 5 The function D(x)=2+0.5x is a linear equation, so its graph is a straight line that can be drawn by plotting 2 points and connecting them. Its D intercept occurs when x=0, so D(0)=2, and (0,2) is the D-intercept. To find another point, plug in another x value into the function D(x). For example, when x=6, we have D(6)=2+0.5(6)=5. So, (6,5) is another point on the graph of D(x) How long did a student warm-up in order for them to run 10 miles per week in gym class? ________________________________________ Great work! That's correct. ________________________________________ $$16 minutes Answer Explanation Correct answers: • $16\ \text{minutes}$16 minutes For a student to run 10 miles per week in gym class, the distance must be 10. So, we must find the amount of warm-up time, x, so that D(x)=10. For D(x)=10, we have, 2+0.5x=10, 0.5x=8, x=8/0.5=16. An owner of multiple online clothing stores explored the relationship between the percent of on-call service representatives and the percent of purchases over $75 at the same stores. The owner collects information from 6of their online stores, shown in the table below. Use the graph below to plot the points and develop a linear relationship between the percent of on-call service representatives and the percent of purchases over $75. Store Number % of On-call service reps % of purchase over $75 1 20 20 2 35 25 3 50 40 4 55 35 5 60 40 6, 75, 34 ________________________________________ Yes that's right. Keep it up! ________________________________________ The percent of on-call service representatives is the x-coordinate, while the percent of purchases over $75 is the y-coordinate. So, the table of values corresponds to the points (20,20), (35,25), (50,40), (55,35), (60,40), (75,54). ON THIS QUESTION, IT’S ASKING YOU TO GRAPH THE %OF ONCALL SRVC WITH %OF PURCHASE Using the linear relationship graphed above, estimate the percent of over $75 purchases if there are 40% on-call service representatives. Answer 1: ________________________________________ Not quite - review the answer explanation to help get the next one. ________________________________________ $$60% Answer 2: ________________________________________ That's not right - let's review the answer. ________________________________________ $$67.5% Answer Explanation Correct answers: • 30% Based on the linear relationship that is graphed, when the percent of on-call service representatives is 40%, the line has a value between 25 and 35. A government agency explored the relationship between the percent of companies that are technology related and the percent of higher paying jobs. The researchers collects information from 5 states, shown in the table below. Use the graph below to plot the points and develop a linear relationship between the percent of technology companies and the percent of higher paying jobs. State number % of tech com. % of higher paying jobs 1 20 25 2 35 30 3 50 45 4 55 65 5 60 70 Answer 2: ________________________________________ Great work! That's correct. ________________________________________ Answer Explanation The percent of tech companies is the x-coordinate, while the percent of higher paying jobs is the y-coordinate. So, the table of values corresponds to the points (20,25), (35,30), (50,45), (55,65), (60,70). Using the linear relationship graphed above, estimate the percent of higher paying jobs if there are 30% technology companies. ________________________________________ Well done! You got it right. ________________________________________ 32.5% Answer Explanation Correct answers: • 30% Based on the linear relationship that is graphed, when the percent of technology companies is 30%, the line has a value between 25 and 35. Question: A random sample of 11 employees produced the following data where x is the number of shifts worked in 8 weeks, and y is the number of breaks taken. X = explanatory variable Y = outcome of the study # of breaks taken per shifts worked x y 27 15 29 19 30 19 32 17 33 20 35 22 36 20 37 23 39 22 21 24 43 20 What is the equation of the regression line? y = 0.381z + 6.9 Question: A random sample of 11 university students produced the following data where x is the minutes spent studying per day, and y is the first exam score (out a maximum of 100 points). x y 11 39 13 55 14 43 17 46 19 69 22 75 24 77 25 78 28 77 31 93 34 92 What is the value of the intercept of the regression line, b rounded to one decimal place. Answer: 16.4 Independent (x) Dependent (y) 11 39 Slope (β1) 2.369324 13 55 y-Intercept (β0) 16.372817 14 43 Correlation Coefficient (r) 0.940900 17 46 Coefficient of Determination (r2) 0.885293 19 69 Standard Error 6.802371 22 75 24 77 25 78 28 77 31 93 34 92 Question: Which of the following data sets or plots could have a regression line with a negative y-intercept? Answer: The difference in height between two twins plotted as a function of age. [Show More]
Last updated: 1 year ago
Preview 1 out of 52 pages
Reviews( 0 )
Recommended For You
Biology> QUESTIONS & ANSWERS > American Public University - BIO 133 / BIO133 Exam 2 Chapter 10 Week 8 LATEST (2020) (All)

American Public University - BIO 133 / BIO133 Exam 2 Chapter 10 Week 8 LATEST (2020)
Chapter 10- wk 7 Study Questions Part 1 of 1 - 10.0/ 10.0 Points Question 1 of 10 1.0/ 1.0 Points Damaged DNA can potentially be repaired during which checkpoint. Select all that apply. A. G1 B...
By Nutmegs , Uploaded: Mar 06, 2022
$13
Biology> QUESTIONS & ANSWERS > American Public University - BIO 133 / BIO133 Exam 2 Chapters 7-11 Week 8 LATEST (2021) (All)
American Public University - BIO 133 / BIO133 Exam 2 Chapters 7-11 Week 8 LATEST (2021)
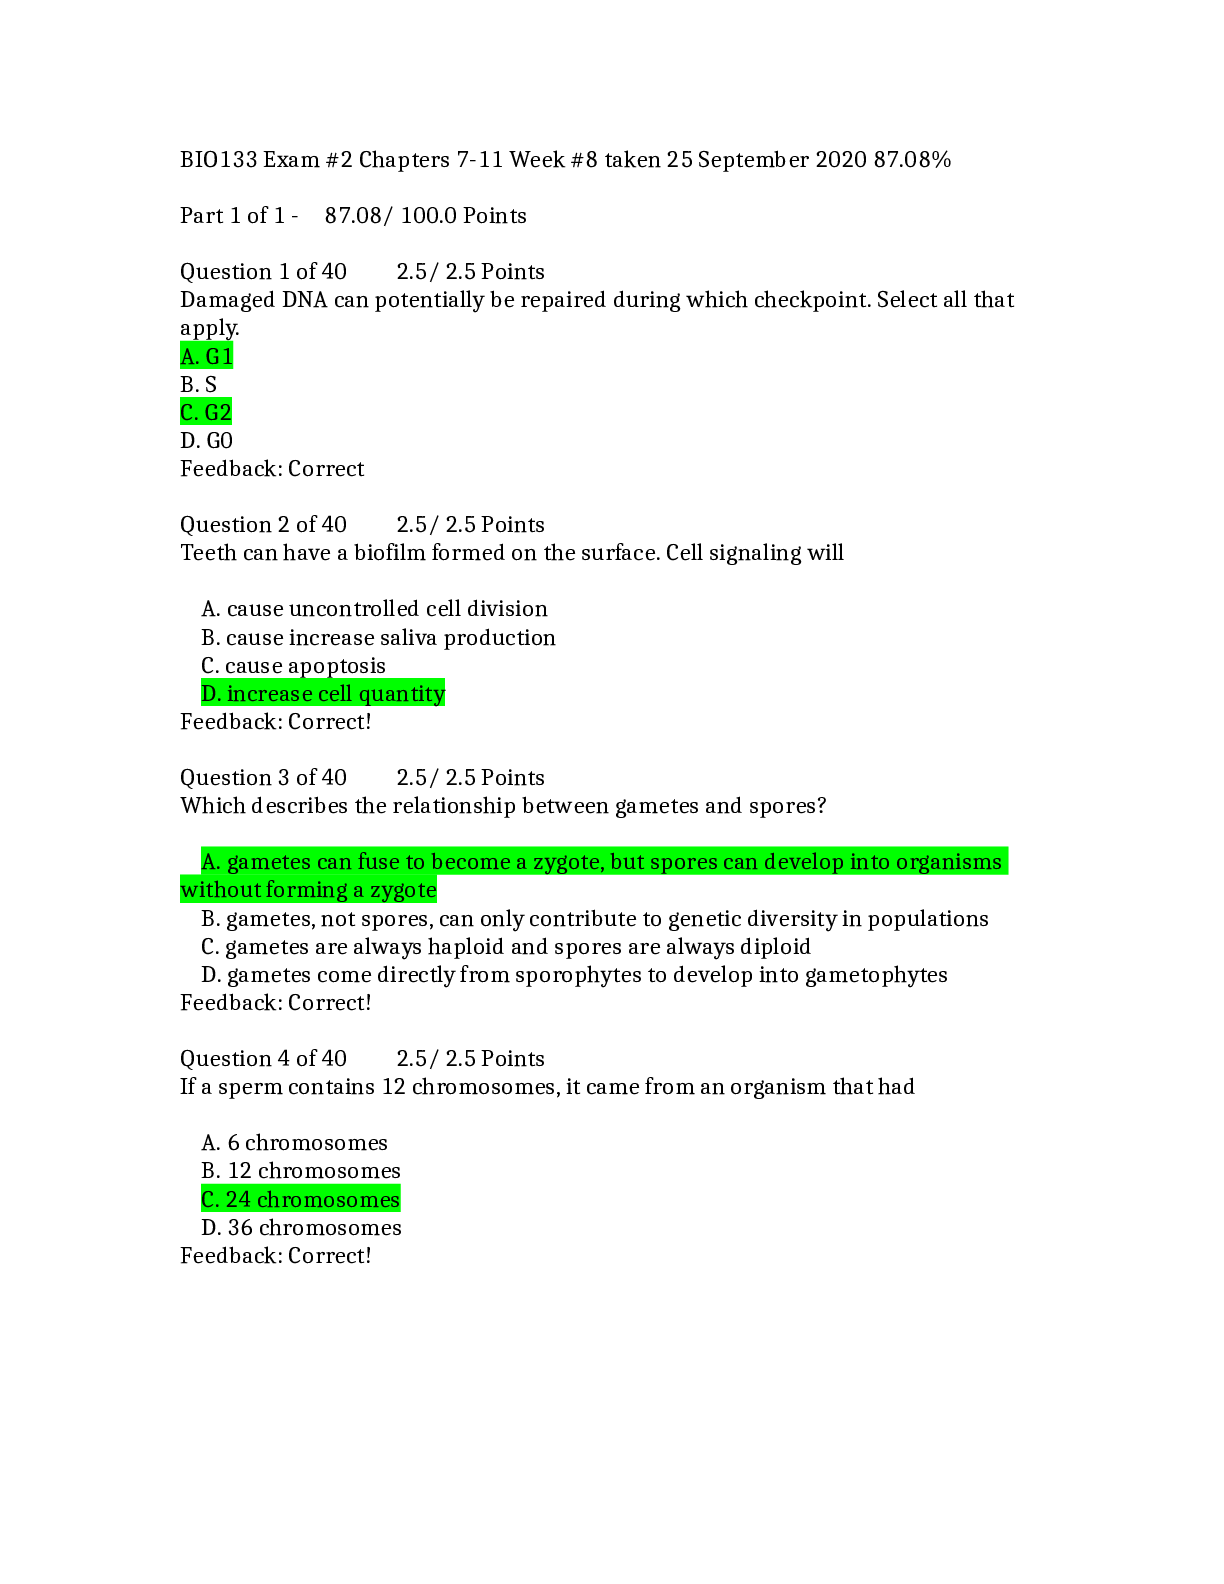
BIO133 Exam #2 Chapters 7-11 Week #8 taken 25 September 2020 87.08% Part 1 of 1 - 87.08/ 100.0 Points Question 1 of 40 2.5/ 2.5 Points Damaged DNA can potentially be repaired during which checkpoin...
By Nutmegs , Uploaded: Mar 06, 2022
$13
*NURSING> QUESTIONS & ANSWERS > NSG 6420 | NSG6420 Week 8 LATEST 2021 ALREADY GRADED A (All)

NSG 6420 | NSG6420 Week 8 LATEST 2021 ALREADY GRADED A
Week 8 Return to deck 1. Which of the following best describes the pain associated with osteoarthritis? Constant, burning, and throbbing with an acute onset Dull and primarily affected by expos...
By Nutmegs , Uploaded: Mar 03, 2022
$11
Mathematics> QUESTIONS & ANSWERS > MATH 225N - Week 8: Performing Linear Regressions with Technology. Questions and Answers. (All)
MATH 225N - Week 8: Performing Linear Regressions with Technology. Questions and Answers.
MATH 225N - Week 8: Performing Linear Regressions with Technology. Questions and Answers. Week 8 questions and answers Performing Linear Regressions with Technology An amateur astronomer is resea...
By Innocent Kyalo , Uploaded: Aug 05, 2021
$10
*NURSING> QUESTIONS & ANSWERS > Performing Linear Regressions with Technology Questions and Approved Answers 100% Graded A+ (All)
Performing Linear Regressions with Technology Questions and Approved Answers 100% Graded A+
An amateur astronomer is researching statistical properties of known stars using a variety of databases. They collect the absolute magnitude or MV and stellar mass or M⊙ for 30 stars. The absolute m...
By Nutmegs , Uploaded: Aug 02, 2021
$12.5
Mathematics> QUESTIONS & ANSWERS > MATH 225N Week 8 Quiz [Performing Linear Regressions with Technology] (All)
MATH 225N Week 8 Quiz [Performing Linear Regressions with Technology]
Week 8 questions and answers Performing Linear Regressions with Technology An amateur astronomer is researching statistical properties of known stars using a variety of databases. They collect the...
By d.occ , Uploaded: Jul 29, 2021
$12
*NURSING> QUESTIONS & ANSWERS > NCSBN TEST BANK for the NCLEX-RN & NCLEX-PN. Contains More than 2000 Q&A Plus Review and Rationale in 517 PAGES. (All)
NCSBN TEST BANK for the NCLEX-RN & NCLEX-PN. Contains More than 2000 Q&A Plus Review and Rationale in 517 PAGES.
NCSBN TEST BANK -for the NCLEX-RN & NCLEX-PN. Updated 2022/2023. Contains More than 2000 Q&A Plus Review and Rationale in 517 PAGES. (All Testable Questions for NCLEX-RN & NCLEX-PN)
By Expert1 , Uploaded: Jul 28, 2020
$20
Business> QUESTIONS & ANSWERS > CLM 031 EXAM (All)
CLM 031 EXAM
CLM 031 = 100% Question 1: 5b Select the statement that is correct concerning performance work statement (PWS) requirements: - All answers are correct. - PWS should describe requirements necessary...
By Book Worm, Certified , Uploaded: Nov 03, 2022
$5
*NURSING> QUESTIONS & ANSWERS > PHIL 347 Week 6 Checkpoint Quiz. Score 100/100 (All)
PHIL 347 Week 6 Checkpoint Quiz. Score 100/100
Question: What are the three fundamental reasoning strategies listed in the text? Question: What is comparative reasoning? On what skill is it based? Question: We learned four tests for evaluating...
By Amanda Rosales , Uploaded: Mar 24, 2021
$7
Business> QUESTIONS & ANSWERS > BUSINESS 1007 (All)

BUSINESS 1007
BUSINESS 1007 07 Key 1. (p. 178) Managers utilize organizational resources such as employees, information, and equipment to accomplish goals. 2. (p. 178) The main job of managers today is to w...
By Kirsch , Uploaded: Oct 19, 2019
$6
Document information
Connected school, study & course
About the document
Uploaded On
Mar 30, 2020
Number of pages
52
Written in

Additional information
This document has been written for:
Uploaded
Mar 30, 2020
Downloads
0
Views
185