*NURSING > EXAM > SOC 200 - Case Study Report 1: THREE JAYS CORPORATION; Complete solution( Rated A) (All)
SOC 200 - Case Study Report 1: THREE JAYS CORPORATION; Complete solution( Rated A)
Document Content and Description Below
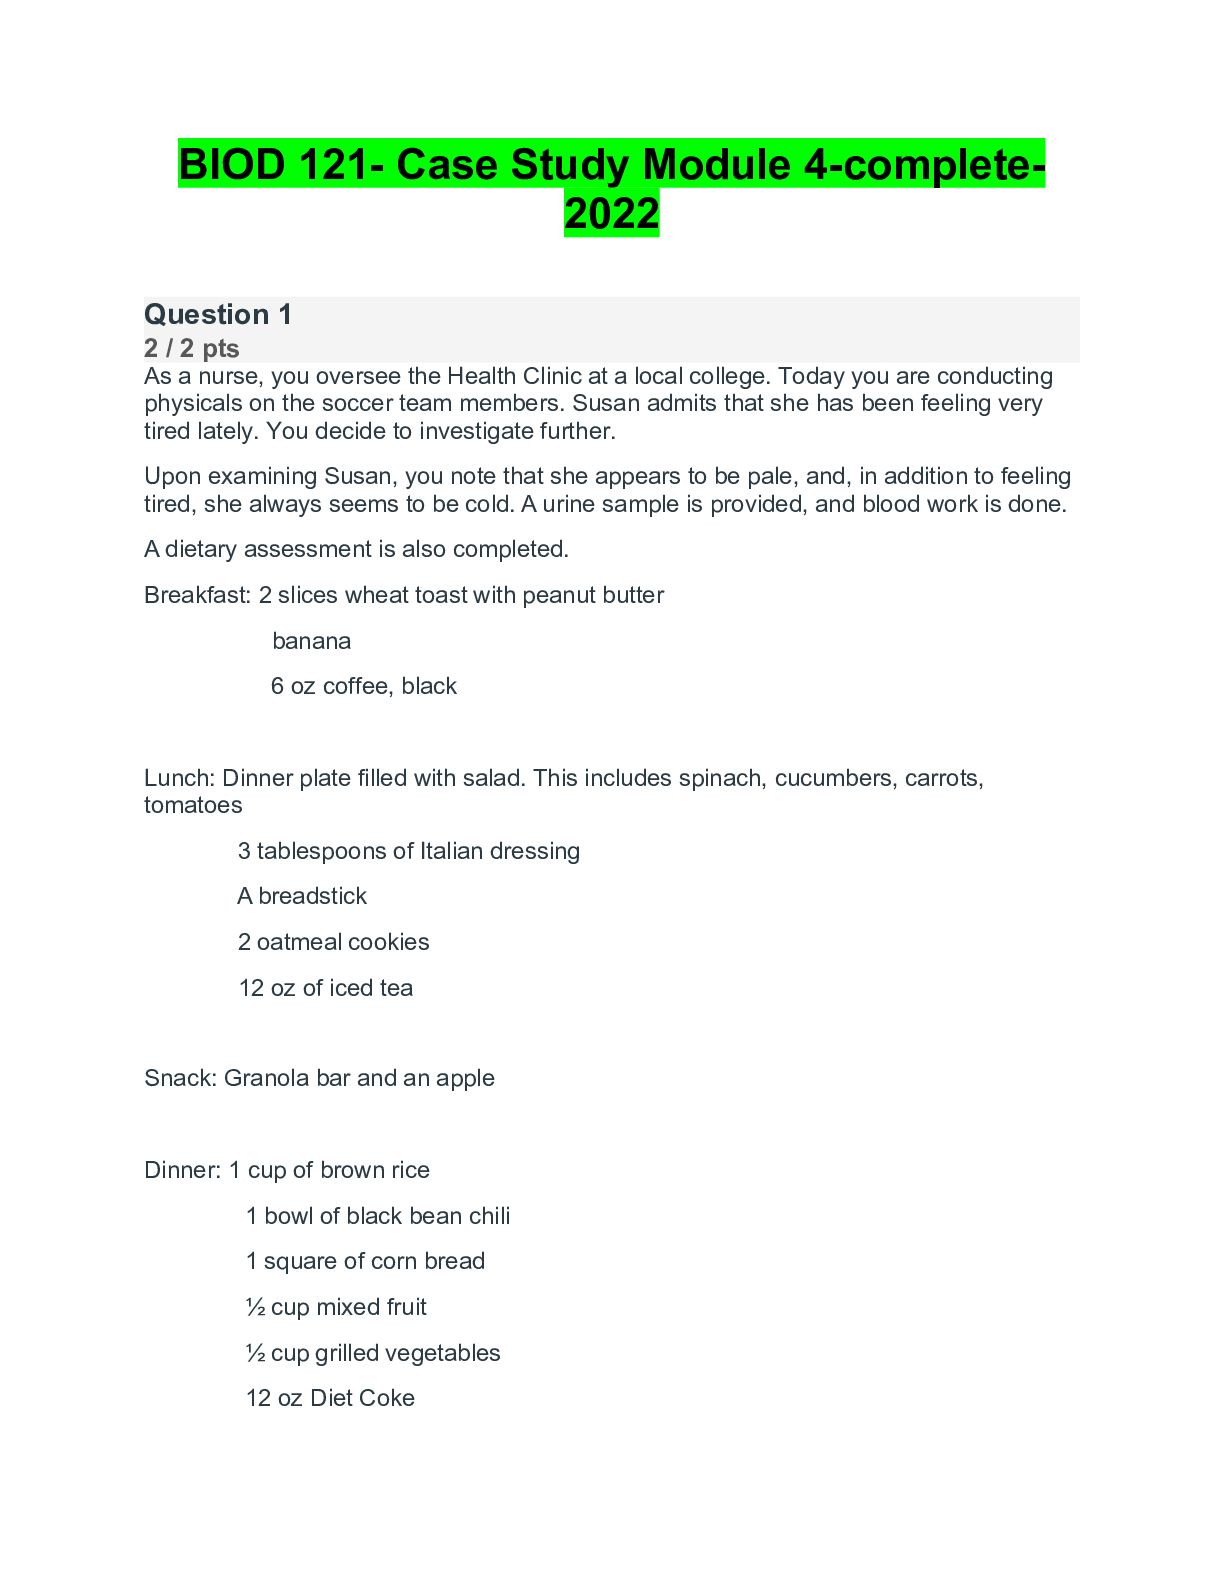
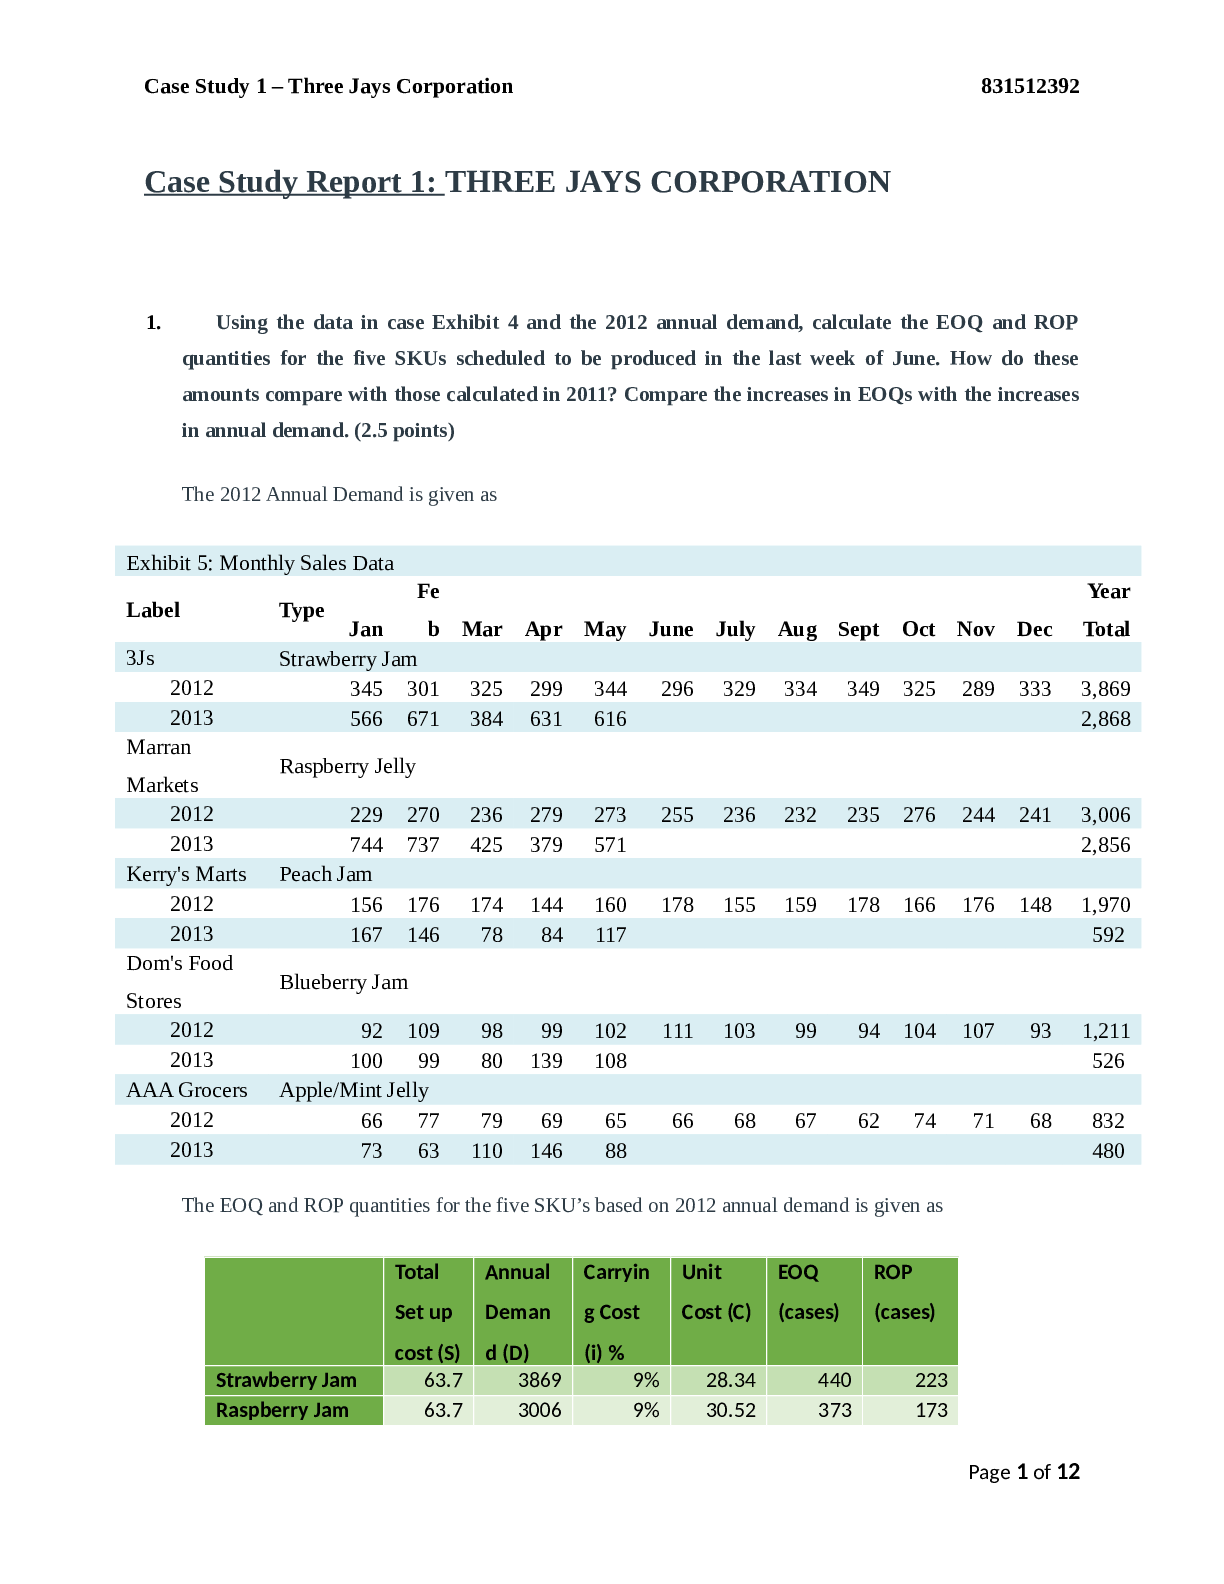
Case Study Report 1: THREE JAYS CORPORATION . 1. Using the data in case Exhibit 4 and the 2012 annual demand, calculate the EOQ and ROP quantities for the five SKUs scheduled to be produced... in the last week of June. How do these amounts compare with those calculated in 2011? Compare the increases in EOQs with the increases in annual demand. (2.5 points) The 2012 Annual Demand is given as Exhibit 5: Monthly Sales Data Label Type Ja n Fe b Mar Apr Ma y June July Aug Sept Oc t Nov Dec Year Total 3Js Strawberry Ja m 2012 345 301 325 299 344 296 329 334 349 325 289 333 3,869 Marran Markets Raspberry Jelly 2012 229 270 236 279 273 255 236 232 235 276 244 241 3,006 2013 744 737 425 379 571 2,856 Kerry's Marts Peach Jam 2012 156 176 174 144 160 178 155 159 178 166 176 148 1,970 2013 167 146 78 84 117 592 Dom's Food Blueberry Jam Stores 2012 92 109 98 99 102 111 103 99 94 104 107 93 1,211 2013 100 99 80 139 108 526 AAA Grocers Apple/Mint Jelly 2012 66 77 79 69 65 66 68 67 62 74 71 68 832 2013 73 63 110 146 88 480 The EOQ and ROP quantities for the five SKU’s based on 2012 annual demand is given as [Show More]
Last updated: 1 year ago
Preview 1 out of 10 pages
Instant download
 (1).png)
Buy this document to get the full access instantly
Instant Download Access after purchase
Add to cartInstant download
Reviews( 0 )
Document information
Connected school, study & course
About the document
Uploaded On
Jul 09, 2021
Number of pages
10
Written in

Additional information
This document has been written for:
Uploaded
Jul 09, 2021
Downloads
0
Views
34
.png)


.png)
 Already Graded A.png)

