Clinical Chemistry > EXAM > Gizmo Boyle & Charles Law Student Lab Sheet Question And Answers (All)
Gizmo Boyle & Charles Law Student Lab Sheet Question And Answers
Document Content and Description Below
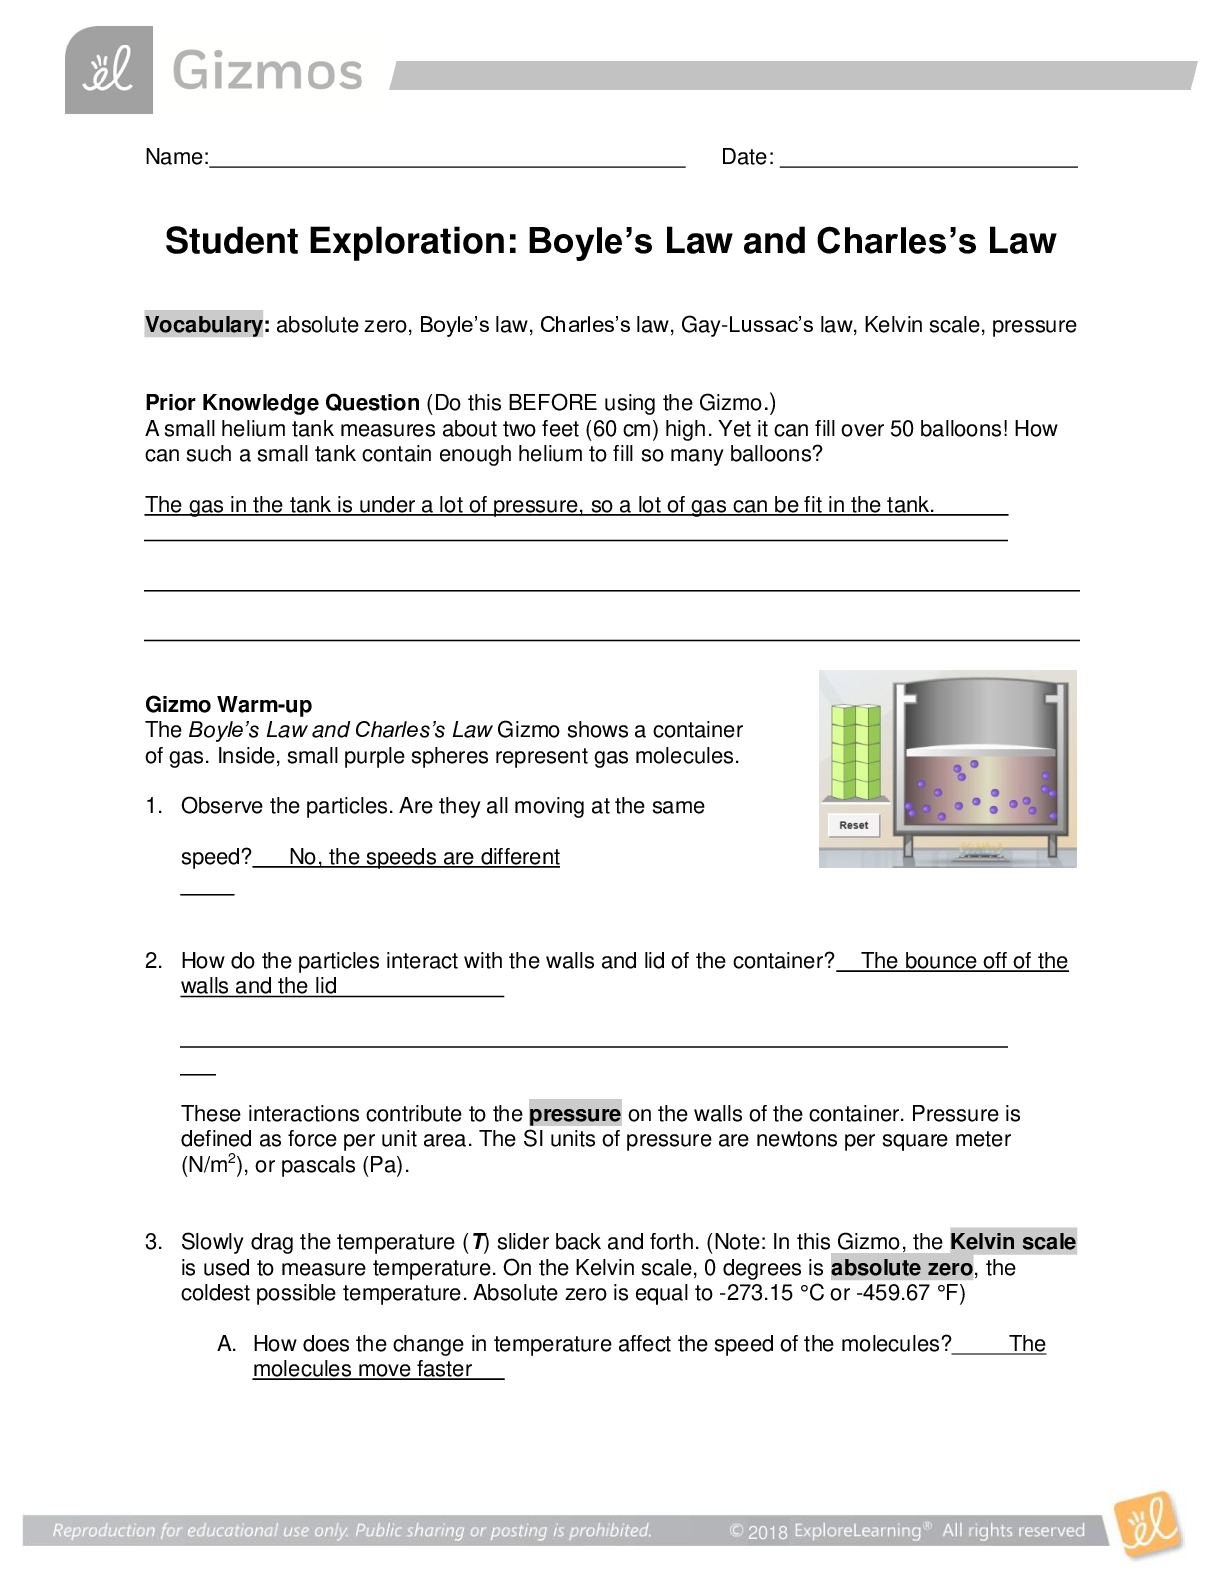
Name: ______________________________________ Date: ________________________ Student Exploration: Boyle’s Law and Charles’s Law Vocabulary: absolute zero, Boyle’s law, Charles’s law, Gay-Lussac... ’s law, Kelvin scale, pressure Prior Knowledge Question (Do this BEFORE using the Gizmo.) A small helium tank measures about two feet (60 cm) high. Yet it can fill over 50 balloons! How can such a small tank contain enough helium to fill so many balloons? The gas in the tank is under a lot of pressure, so a lot of gas can be fit in the tank. Gizmo Warm-up The Boyle’s Law and Charles’s Law Gizmo shows a container of gas. Inside, small purple spheres represent gas molecules. 1. Observe the particles. Are they all moving at the same speed? No, the speeds are different 2. How do the particles interact with the walls and lid of the container? The bounce off of the walls and the lid These interactions contribute to the pressure on the walls of the container. Pressure is defined as force per unit area. The SI units of pressure are newtons per square meter (N/m2), or pascals (Pa). 3. Slowly drag the temperature (T) slider back and forth. (Note: In this Gizmo, the Kelvin scale is used to measure temperature. On the Kelvin scale, 0 degrees is absolute zero, the coldest possible temperature. Absolute zero is equal to -273.15 °C or -459.67 °F) A. How does the change in temperature affect the speed of the molecules? The molecules move faster B. How does the change in temperature affect the volume of the container? Volume increases Activity A: Boyle’s law Get the Gizmo ready: • Set the temperature (T) to 300 K. • Check that the mass (m) is set to 0 kg. Question: How does pressure affect the volume of a gas? 1. Form hypothesis: In this experiment, you will pile weights on the lid of the container of gas. What do you think will happen as more weight is added to the lid? Volume will decrease 2. Notice: Look at the DESCRIPTION pane. What is the mass of the lid? 10kg How much pressure does the lid exert on the gas? 98.1 3. Collect data: With the temperature held constant at 300 K, use the Select mass slider to place weights on the lid. Record the pressure and volume of the gas for each added mass. Added mass on the lid Total mass (lid + added mass) Pressure* Volume 0 kg 10 kg 98.1 N/m^2 2.54 m^3 10 kg 20 kg 196.2 N/m^2 1.27 m^3 20 kg 30 kg 294.3 N/m^2 0.85 m^3 30 kg 40 kg 392.4 N/m^2 0.64 m^3 *This model does not include atmospheric pressure, which is 101,325 N/m2. 4. Analyze: As the pressure increases at constant temperature, what happens to the volume of the gas? As pressure increases, gas volume decreases This relationship is called Boyle’s law. 5. Calculate: Compare the pressure and volume values in your data table. A. How did doubling the pressure change the gas volume? Divided by 2 B. How did tripling the pressure change the gas volume? Divided by 3 C. How did quadrupling the pressure change the gas volume? Divided by 4 (Activity A continued on next page) Activity A (continued from previous page) 6. Predict: If the added mass on the lid was 50 kg, a total mass of 60 kg would exert pressure on the gas inside the container. What will be the volume of the gas? 42 7. Test: Test your prediction using the Gizmo. What is the volume of the gas? 42 Was your prediction correct? yes 8. Create a graph: On the GRAPH tab, select V vs. P. Set m to 0 kg, and click Record to plot a point on the graph. Plot a point for each possible mass to create a graph showing the relationship between pressure and volume. When your graph is completed, click the camera ( ) icon to take a snapshot. Right-click the image, and click Copy Image. Paste the image into a blank word-processing document, and label the graph “Volume vs. Pressure.” A. What is the shape of the graph? A downwards curve from left to right B. How does this graph illustrate Boyle’s law? Pressure increases, gas volume ddecreases C. How do you think the graph might change if the temperature was held constant at a higher temperature, say 400 K? The pressure would stay the same 9. Apply: Think about a small helium tank that can fill 50 balloons. What must be true about the helium in the tank compared to the helium in the balloons? The helium in the tank must be under higher pressure than the balloon Activity B: Charles’s law Get the Gizmo ready: • On the SIMULATION pane, set T to 100 K and m to 0 kg. Question: How does temperature affect the volume of a gas? 1. Form hypothesis: How do you think the volume of a gas will change as the temperature rises and falls? Rises 2. Collect data: Without changing the mass on the lid, record the pressure and volume of the gas at each of the given temperatures. Temperature Pressure* Volume 100 K 98.1 .85 200 K 98.1 1.7 300 K 98.1 2.54 400 K 98.1 3.39 500 K 98.1 424 *This model does not include atmospheric pressure, which is 101,325 N/m2. 3. Analyze: As the temperature increases at constant pressure, what happens to the volume of the gas? It increases This relationship is called Charles’s law. 4. Explain: Based on the motions of the gas molecules, why do you think the volume changed as it did when the temperature was increased? As the temperature increased, the molecules increased in speed 5. Think about it: Why do you think the pressure was the same in each test? Weight on the lid was the same (Activity B continued on next page) Activity B (continued from previous page) 6. Calculate: Compare the pressure and volume values in your data table. A. How did doubling the temperature affect the gas volume? Gas volume doubled B. How did tripling the temperature affect the gas volume? Gas volume tripled C. How did quadrupling the temperature affect the gas volume? Gas volume quadrupled. 7. Predict: Suppose the temperature was 50 K. What will be the volume of the gas? 42 8. Test: Test your prediction using the Gizmo. What is the volume of the gas? 42 Was your prediction correct? yes 9. Create a graph: On the GRAPH tab, select V vs. T. Set T to 50 K, and click Record to plot a point on the graph. Plot a point every 50 degrees to create a graph showing the relationship between temperature and volume. When your graph is complete, click the camera icon to take a snapshot. Paste the image into your document, and label the graph “Volume vs. Temperature.” A. What is the shape of the graph? A straight diagonal line from lower left than upper right B. How does this graph illustrate Charles’s law? As temp increases, volume increases linearly 10. Apply: Based on what you learned, what would happen to a balloon placed in the freezer? It would shrink, because it cools down What would happen to a balloon placed in a warm oven? (Assume it doesn’t pop.) It would expands because it warms up. 11. Think and discuss: Consider temperature, pressure, and volume. How does the mathematical relationship in Boyle’s law compare to that in Charles’s law? Charles law is a direct relationship, Boyle’s law is an inverse relationship. Activity C: Gay-Lussac’s Law Get the Gizmo ready: • On the SIMULATION pane, set T to 300 K and m to 15 kg. • Turn on the Constant volume checkbox. Question: How does temperature affect the pressure of a gas when volume is constant? 1. Form hypothesis: If the volume of a gas is held constant, how do you think the pressure will change as temperature increases? Decreases 2. Collect data: Select the TABLE tab. Record the pressure when T = 100 K, 200 K, and so forth up to 500 K. (Note: The volume will remain constant at 1.02 m3.) Temperature Pressure Pressure Temperature 100 K 98.1 .981 200 K 196.2 .981 300 K 294.3 .981 400 K 392.4 .981 500 K 490.5 .981 3. Analyze: Divide the pressure by the temperature to fill in the last column of the table. Since 1 N/m2 is equal to 1 pascal (Pa), write the units of the ratio as Pa/K. A. When the volume is held constant, how does the pressure change as temperature increases? Pressure increases as temperature increases B. What do you notice about the ratio of pressure to temperature, when volume is constant? It is always .981 Pa/K Gay-Lussac’s law states that, at constant volume, the ratio of pressure to temperature is constant. As temperature increases, pressure increases as well. 4. Explain: Based on the motions of the gas molecules, why do you think the pressure changed as it did when the temperature was increased? Temp increases the molecule speec increases, which increases collisions. (Activity C continued on next page) Activity C (continued from previous page) 5. Calculate: Compare the pressure and temperature values in your data table. A. At constant volume, how did doubling the temperature affect the pressure? Pressure doubled when temperature doubles B. How did tripling the temperature affect the pressure? Tripled C. How did quadrupling the temperature affect the gas pressure? Quadrupled 1. Create a graph: Record the pressure for temperatures of 50 K, 150 K, 250 K, 350 K, and 450 K. On the GRAPH tab, select P vs. T. Click the camera icon to take a snapshot. Paste the image into your document, and label the graph “Pressure vs. Temperature.” A. What is the shape of the graph? Straight line B. How does this graph illustrate Gay-Lussac’s law? Direct relationship between temp and volume 2. Apply: Based on what you learned, what do you think would happen if you placed a sealed container of gas into a fire? Th temp and pressure would both increase 3. Challenge: Combine Boyle’s law, Charles’s law, and Gay-Lussac’s law into a single proportional relationship between pressure (P), volume (V), and temperature (T). Use the symbol “∝” to represent “is proportional to.” PV∝T Explain your reasoning. Charles law says constant pressure=vol is proportional to temperature. Gay lussac’s law states at constant volume pressure is proportional to temperature. [Show More]
Last updated: 1 year ago
Preview 1 out of 14 pages
Reviews( 0 )
Document information
Connected school, study & course
About the document
Uploaded On
Jun 16, 2021
Number of pages
14
Written in

Additional information
This document has been written for:
Uploaded
Jun 16, 2021
Downloads
0
Views
128