Psychology > EXAM > University of Maryland - STAT 200; Week 7 Homework Problems 2019/20 Latest Graded A Solutions. (All)
University of Maryland - STAT 200; Week 7 Homework Problems 2019/20 Latest Graded A Solutions.
Document Content and Description Below
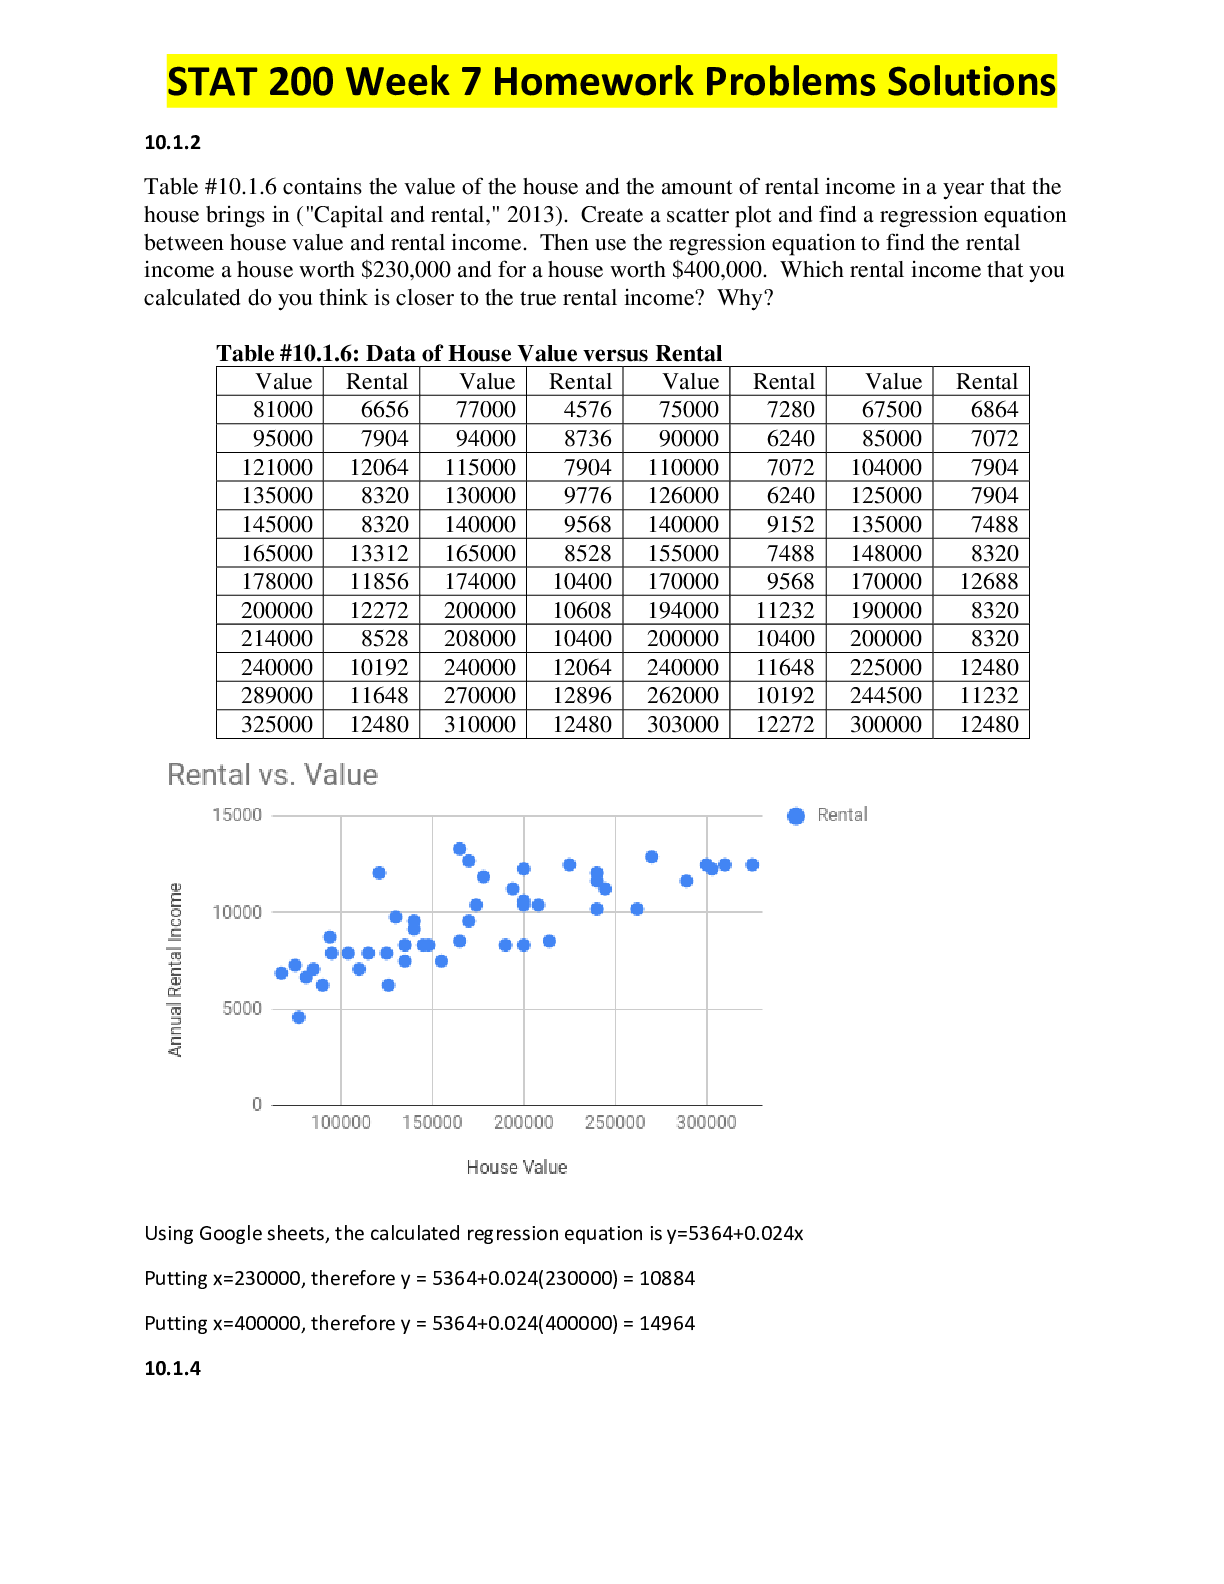
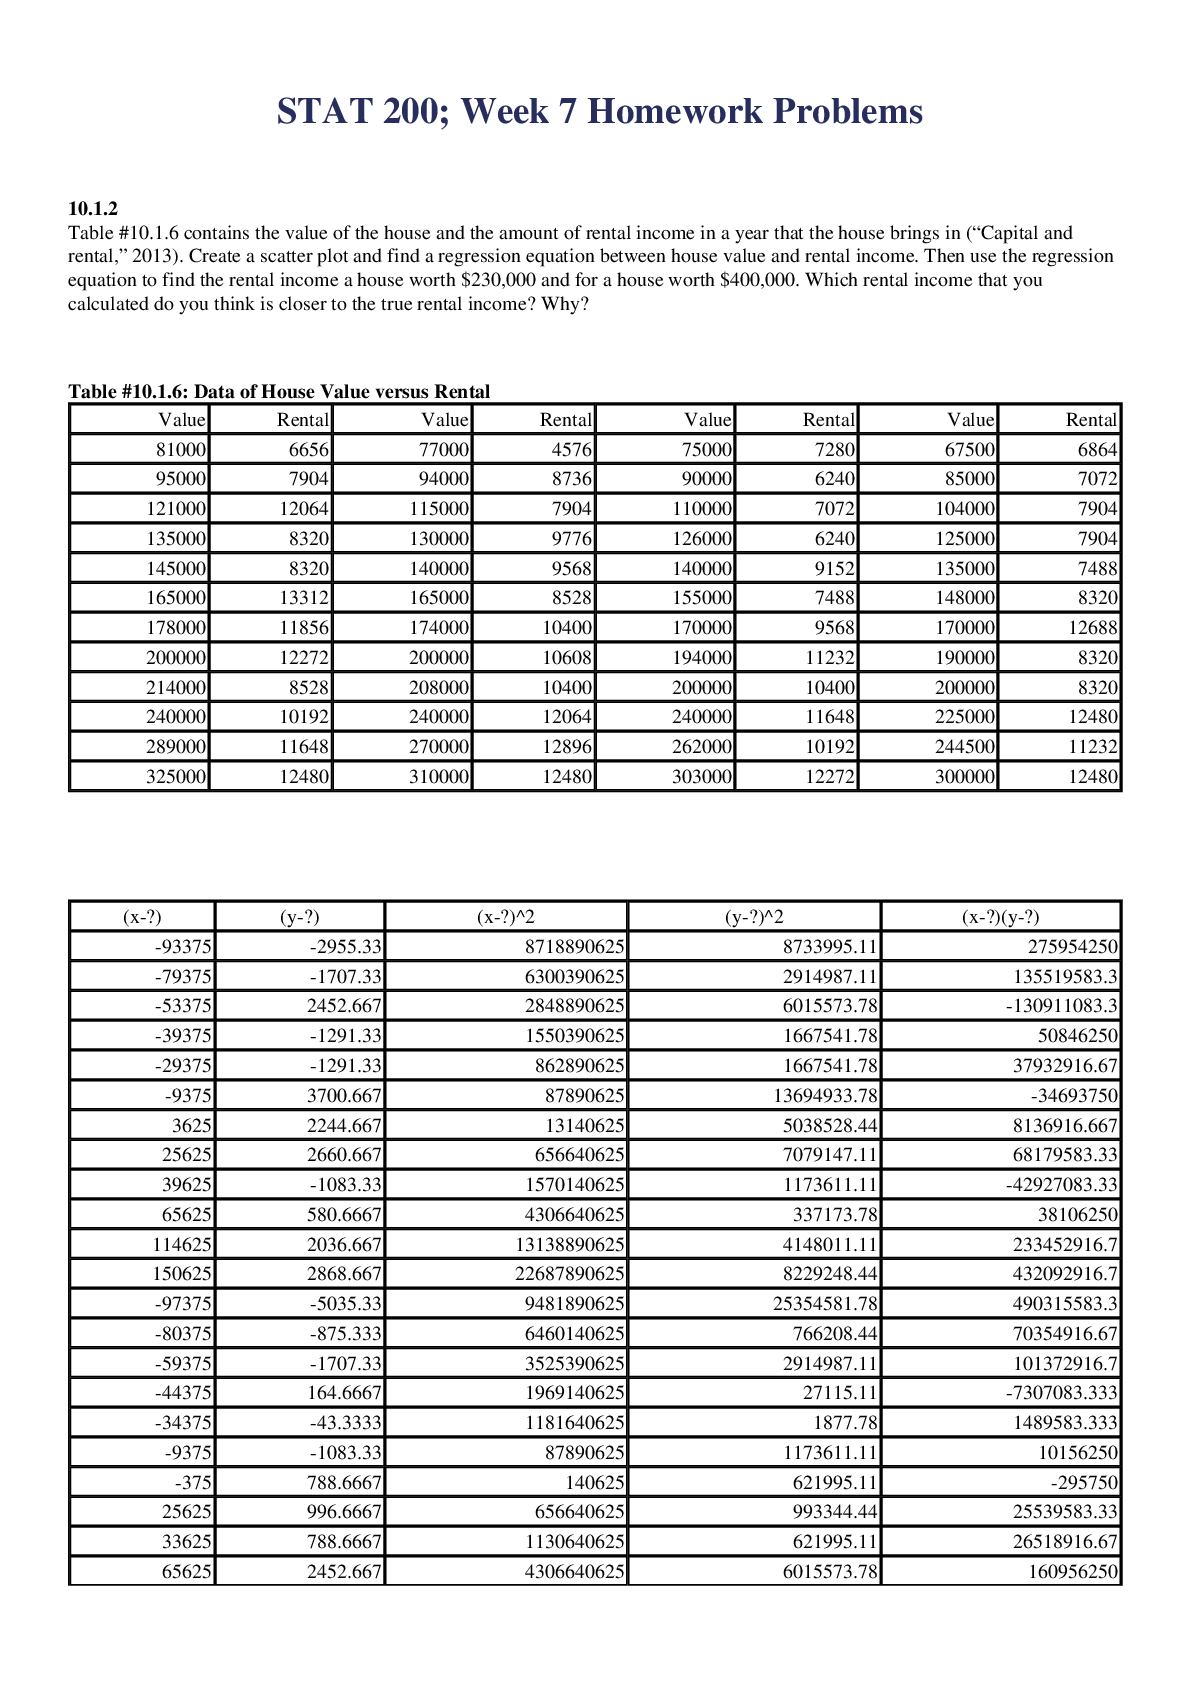
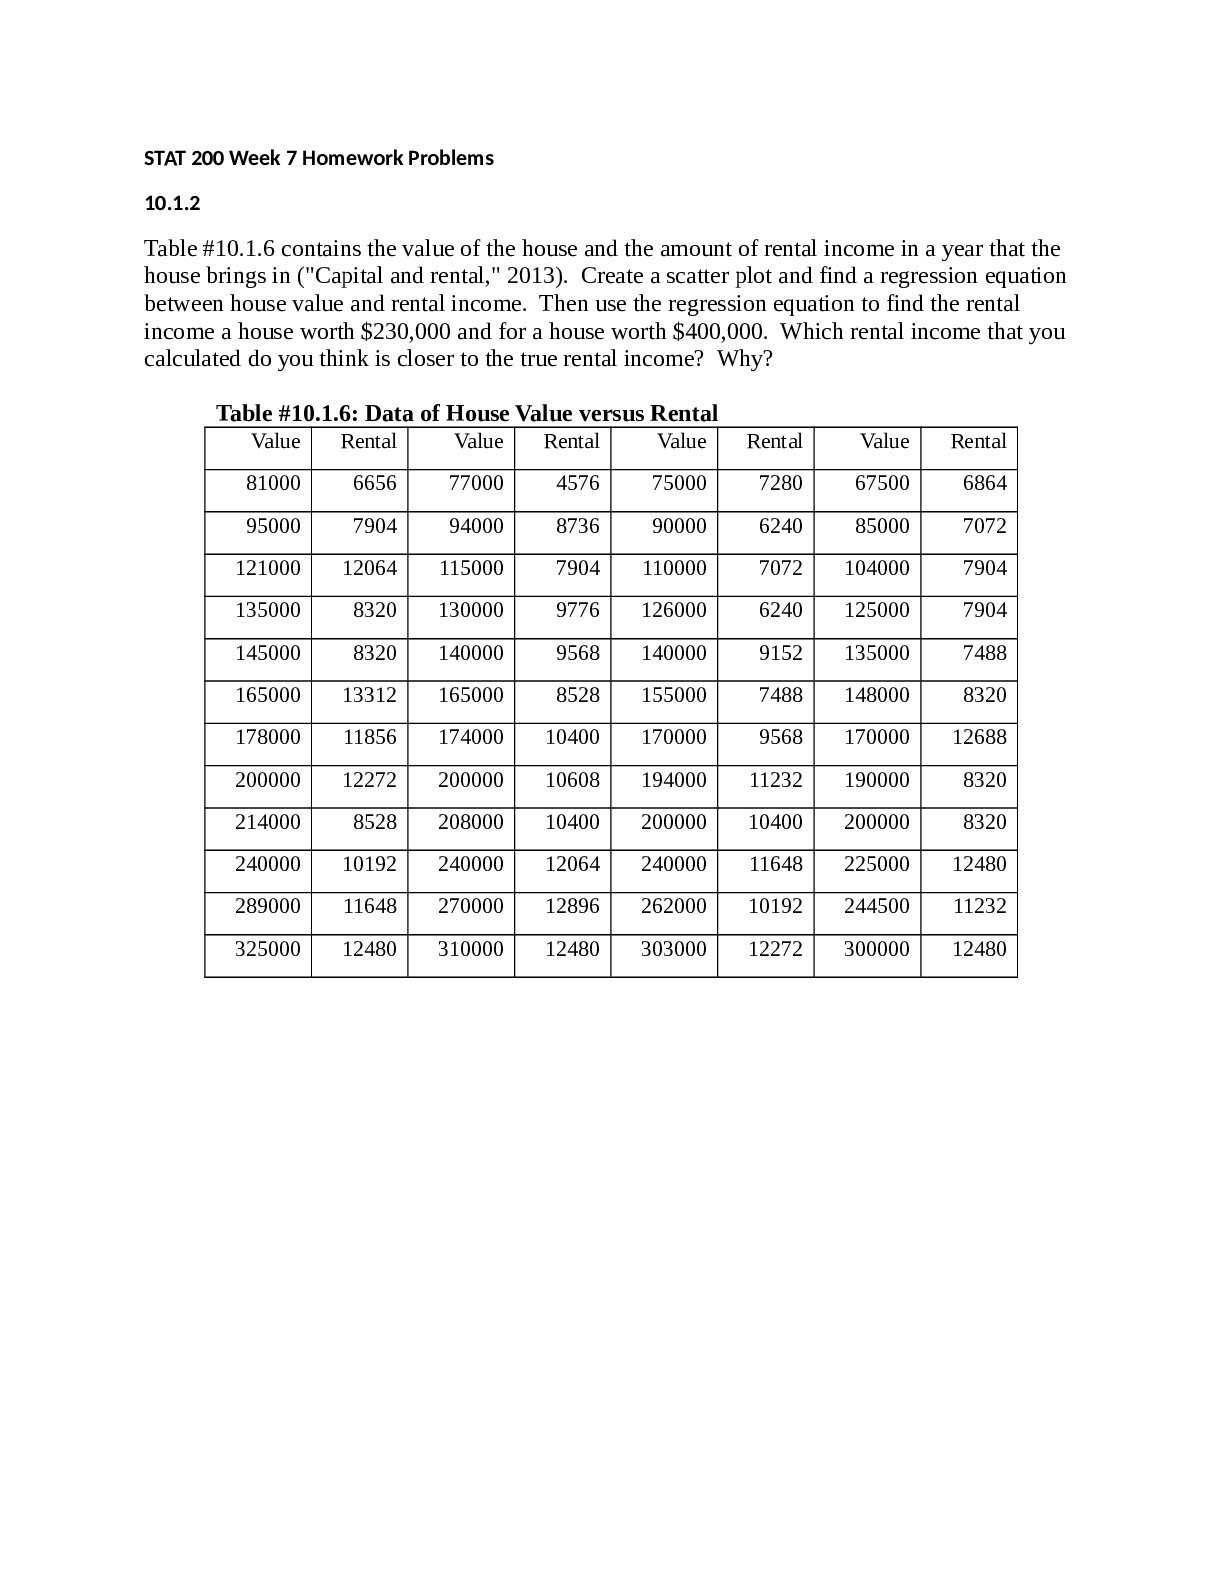
STAT 200; Week 7 Homework Problems THE TABLE FOR EACH QUESTION PLUST THE FULL QUESTIONS CAN BE FOUND IN THE ATTATCHMENT!!!!!!!! 1 table #10.1.6 contains the value of the house and the amount of re nta... l income in a year that the house brings in ("Capital and rental," 2013). Create a scatter plot and find a regression equation between house value and rental income. Then use the regression equation to find the rental income a house worth $230,000 and for a house worth $400,000. Which rental income that you calculated do you think is closer to the true rental income? Why? 2 The World Bank collected data on the percentage of GDP that a country spends on health expenditures ("Health expenditure," 2013) and also the percentage of women receiving prenatal care ("Pregnant woman receiving," 2013). The data for the countries where this information are available for the year 2011 is in table #10.1.8. Create a scatter plot of the data and find a regression equation between percentage spent on health expenditure and the percentage of women receiving prenatal care. Then use the regression equation to find the percent of women receiving prenatal care for a country that spends 5.0% of GDP on health expenditure and for a country that spends 12.0% of GDP. Which prenatal care percentage that you calculated do you think is closer to the true percentage? Why? 3 Table #10.1.6 contains the value of the house and the amount of rental income in a year that the house brings in ("Capital and rental," 2013). Find the correlation coefficient and coefficient of determination and then interpret both. 4 The World Bank collected data on the percentage of GDP that a country spends on health expenditures ("Health expenditure," 2013) and also the percentage of women receiving prenatal care ("Pregnant woman receiving," 2013). The data for the countries where this information is available for the year 2011 are in table #10.1.8. Find the correlation coefficient and coefficient of determination and then interpret both. 5 Table #10.1.6 contains the value of the house and the amount of rental income in a year that the house brings in ("Capital and rental," 2013). Test at the 5% level for a positive correlation between house value and rental amount. 6 The World Bank collected data on the percentage of GDP that a country spends on health expenditures ("Health expenditure," 2013) and also the percentage of women receiving prenatal care ("Pregnant woman receiving," 2013). The data for the countries where this information is available for the year 2011 are in table #10.1.8. Test at the 5% level for a correlation between percentage spent on health expenditure and the percentage of women receiving prenatal care. 7 Researchers watched groups of dolphins off the coast of Ireland in 1998 to determine what activities the dolphins partake in at certain times of the day ("Activities of dolphin," 2013). The numbers in table #11.1.6 represent the number of groups of dolphins that were partaking in an activity at certain times of days. Is there enough evidence to show that the activity and the time period are independent for dolphins? Test at the 1% level. 8 A person’s educational attainment and age group was collected by the U.S. Census Bureau in 1984 to see if age group and educational attainment are related. The counts in thousands are in table #11.1.8 ("Education by age," 2013). Do the data show that educational attainment and age are independent? Test at the 5% level. 9 In Africa in 2011, the number of deaths of a female from cardiovascular disease for different age groups are in table #11.2.6 ("Global health observatory," 2013). In addition, the proportion of deaths of females from all causes for the same age groups are also in table #11.2.6. Do the data show that the death from cardiovascular disease are in the same proportion as all deaths for the different age groups? Test at the 5% level. 10 A project conducted by the Australian Federal Office of Road Safety asked people many questions about their cars. One question was the reason that a person chooses a given car, and that data is in table #11.2.8 ("Car preferences," 2013). [Show More]
Last updated: 1 year ago
Preview 1 out of 10 pages
Reviews( 0 )
Document information
Connected school, study & course
About the document
Uploaded On
Jun 09, 2021
Number of pages
10
Written in

Additional information
This document has been written for:
Uploaded
Jun 09, 2021
Downloads
0
Views
46

.png)


.png)


.png)