Computer Science > QUESTIONS & ANSWERS > University of California, Berkeley - DATA 8lab07 sol Resampling and the Bootstrap (All)
University of California, Berkeley - DATA 8lab07 sol Resampling and the Bootstrap
Document Content and Description Below
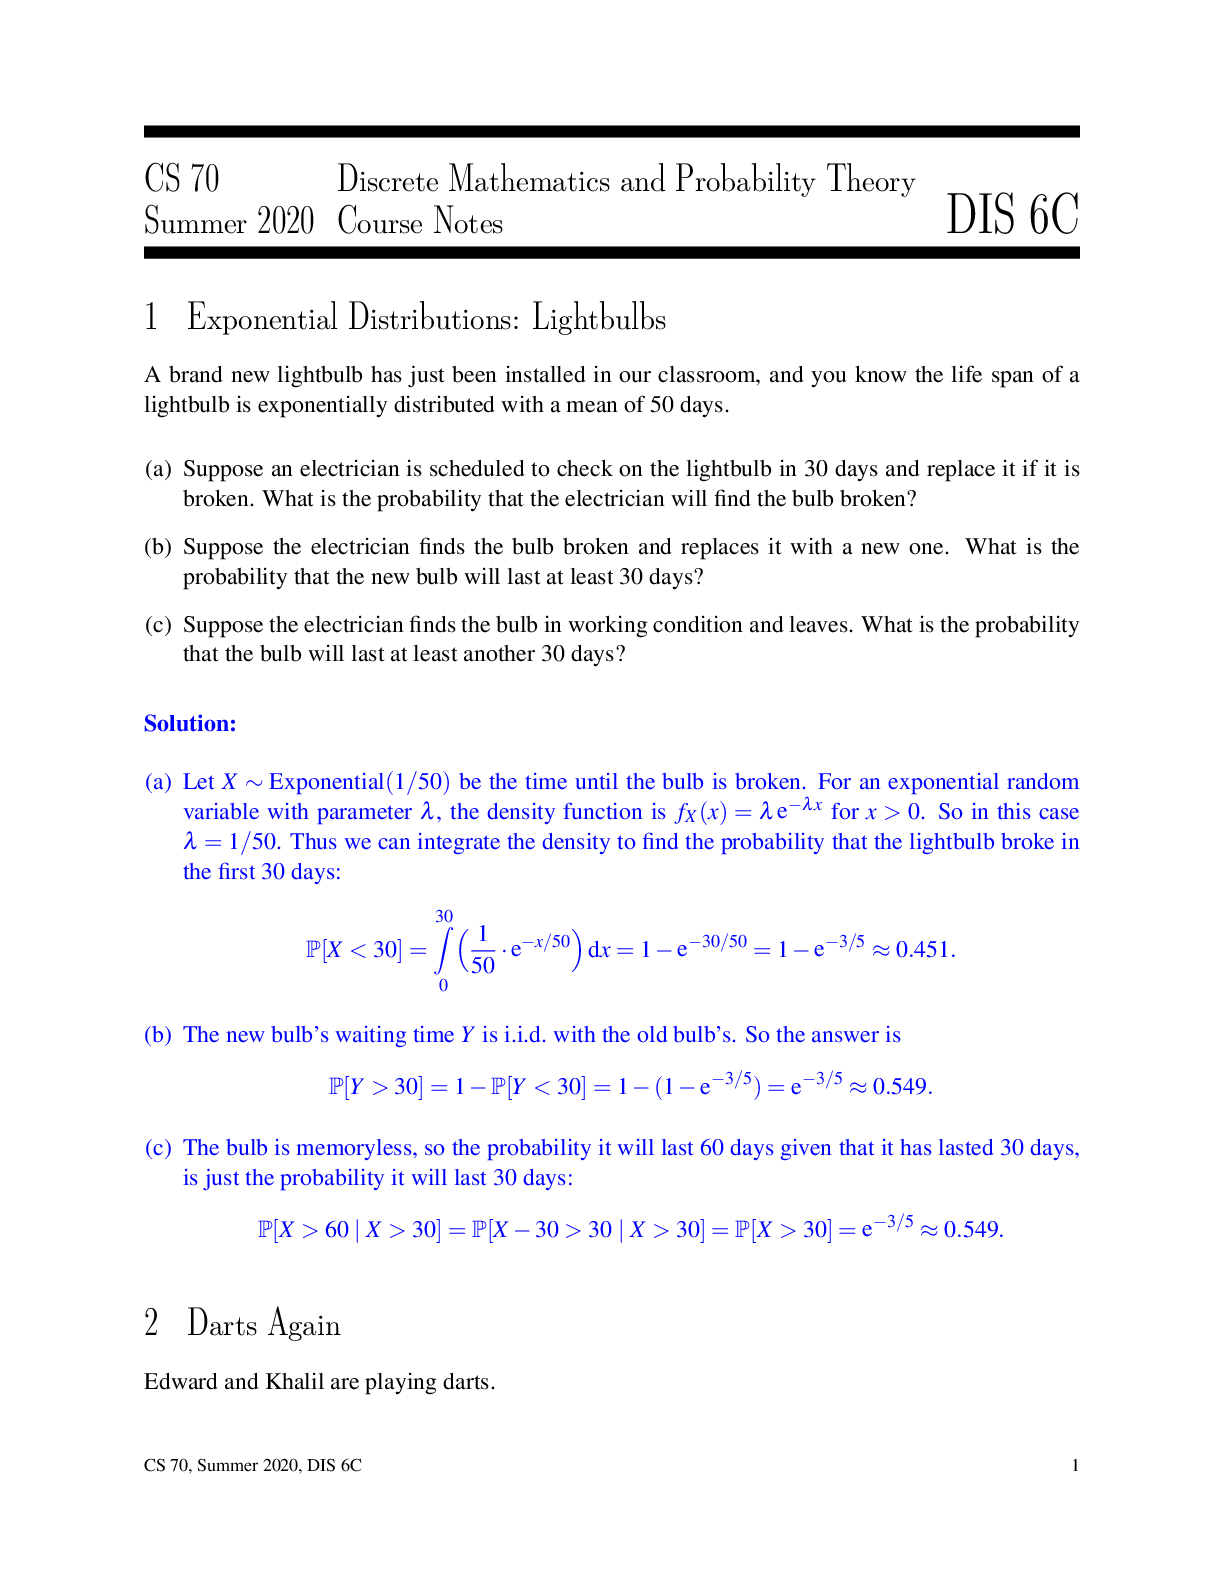
Resampling and the Bootstrap Welcome to lab 7! In textbook section 9.3 (https://www.inferentialthinking.com/chapters/09/3/empirical-distribution-of-astatistic.html), we saw an example of estimation.... The British Royal Air Force wanted to know how many warplanes the Germans had (some number N, a population parameter), and they needed to estimate that quantity knowing only a random sample of the planes' serial numbers (from 1 to N). For example, one estimate was twice the mean of the sample serial numbers. We investigated the random variation in these estimates by simulating sampling from the population many times and computing estimates from each sample. In real life, if the RAF had known what the population looked like, they would have known N and would not have had any reason to think about random sampling. They didn't know what the population looked like, so they couldn't have run the simulations we did. So that was useful as an exercise in understanding random variation in an estimate, but not as a tool for practical data analysis. Now we'll flip that idea on its head to make it practical. Given just a random sample of serial numbers, we'll estimate N, and then we'll use simulation to find out how accurate our estimate probably is, without ever looking at the whole population. This is an example of statistical inference. As usual, run the cell below to prepare the lab and the automatic tests. In [ ]: # Run this cell to set up the notebook, but please don't change it. # These lines import the Numpy and Datascience modules. import numpy as np from datascience import * # These lines do some fancy plotting magic. import matplotlib %matplotlib inline import matplotlib.pyplot as plt plt.style.use('fivethirtyeight') import warnings warnings.simplefilter('ignore', FutureWarning) # These lines load the tests. from client.api.notebook import Notebook ok = Notebook('lab07.ok') _ = ok.auth(inline=True)1. Preliminaries Remember the setup: We (the RAF in World War II) want to know the number of warplanes fielded by the Germans. That number is N. The warplanes have serial numbers from 1 to N, so N is also equal to the largest serial number on any of the warplanes. We only see a small number of serial numbers (assumed to be a random sample with replacement from among all the serial numbers), so we have to use estimation. Question 1.1 Is N a population parameter or a statistic? If we compute a number using our random sample that's an estimate of N, is that a population parameter or a statistic? SOLUTION: N is a population parameter, and an estimate is a statistic. Check your answer with a neighbor or a TA. To make the situation realistic, we're going to hide the true number of warplanes from you. You'll have access only to this random sample: In [ ]: observations = Table.read_table("serial_numbers.csv") num_observations = observations.num_rows observations Question 1.2 Define a function named plot_serial_numbers to make a histogram of any table of serial numbers. It should take one argument, a table like observations with one column called "serial number". It should plot a histogram of the values in the column using bins of width 1 ranging from 1 to 200 but return nothing. Then, call that function to make a histogram of observations. In [ ]: def plot_serial_numbers(numbers): numbers.hist(bins=np.arange(1, 200+2)) #SOLUTION # Assuming the lines above produce a histogram, this next # line may make your histograms look nicer. Feel free to # delete it if you want. plt.ylim(0, .25) plot_serial_numbers(observations)Question 1.3 What does each little bar in the histogram represent and why are all the bars the same height? SOLUTION: Each bar represents one observed serial number. In this particular sample, no two numbers were the same, which is why all the nonempty bars are the same height. Question 1.4 In the previous lab, we saw that one way to estimate N was to take twice the mean of the serial numbers we see. Write a function that computes that statistic. It should take as its argument an array of serial numbers and return twice their mean. Call it mean_based_estimator. After that, use it to compute an estimate of N called mean_based_estimate [Show More]
Last updated: 1 year ago
Preview 1 out of 10 pages
.png)
Reviews( 0 )
Document information
Connected school, study & course
About the document
Uploaded On
Apr 10, 2021
Number of pages
10
Written in

Additional information
This document has been written for:
Uploaded
Apr 10, 2021
Downloads
0
Views
29


.png)
