Geography > QUESTIONS & ANSWERS > University of Florida - BSC 2011LM10_ClimateChangeIndividual9. (All)
University of Florida - BSC 2011LM10_ClimateChangeIndividual9.
Document Content and Description Below
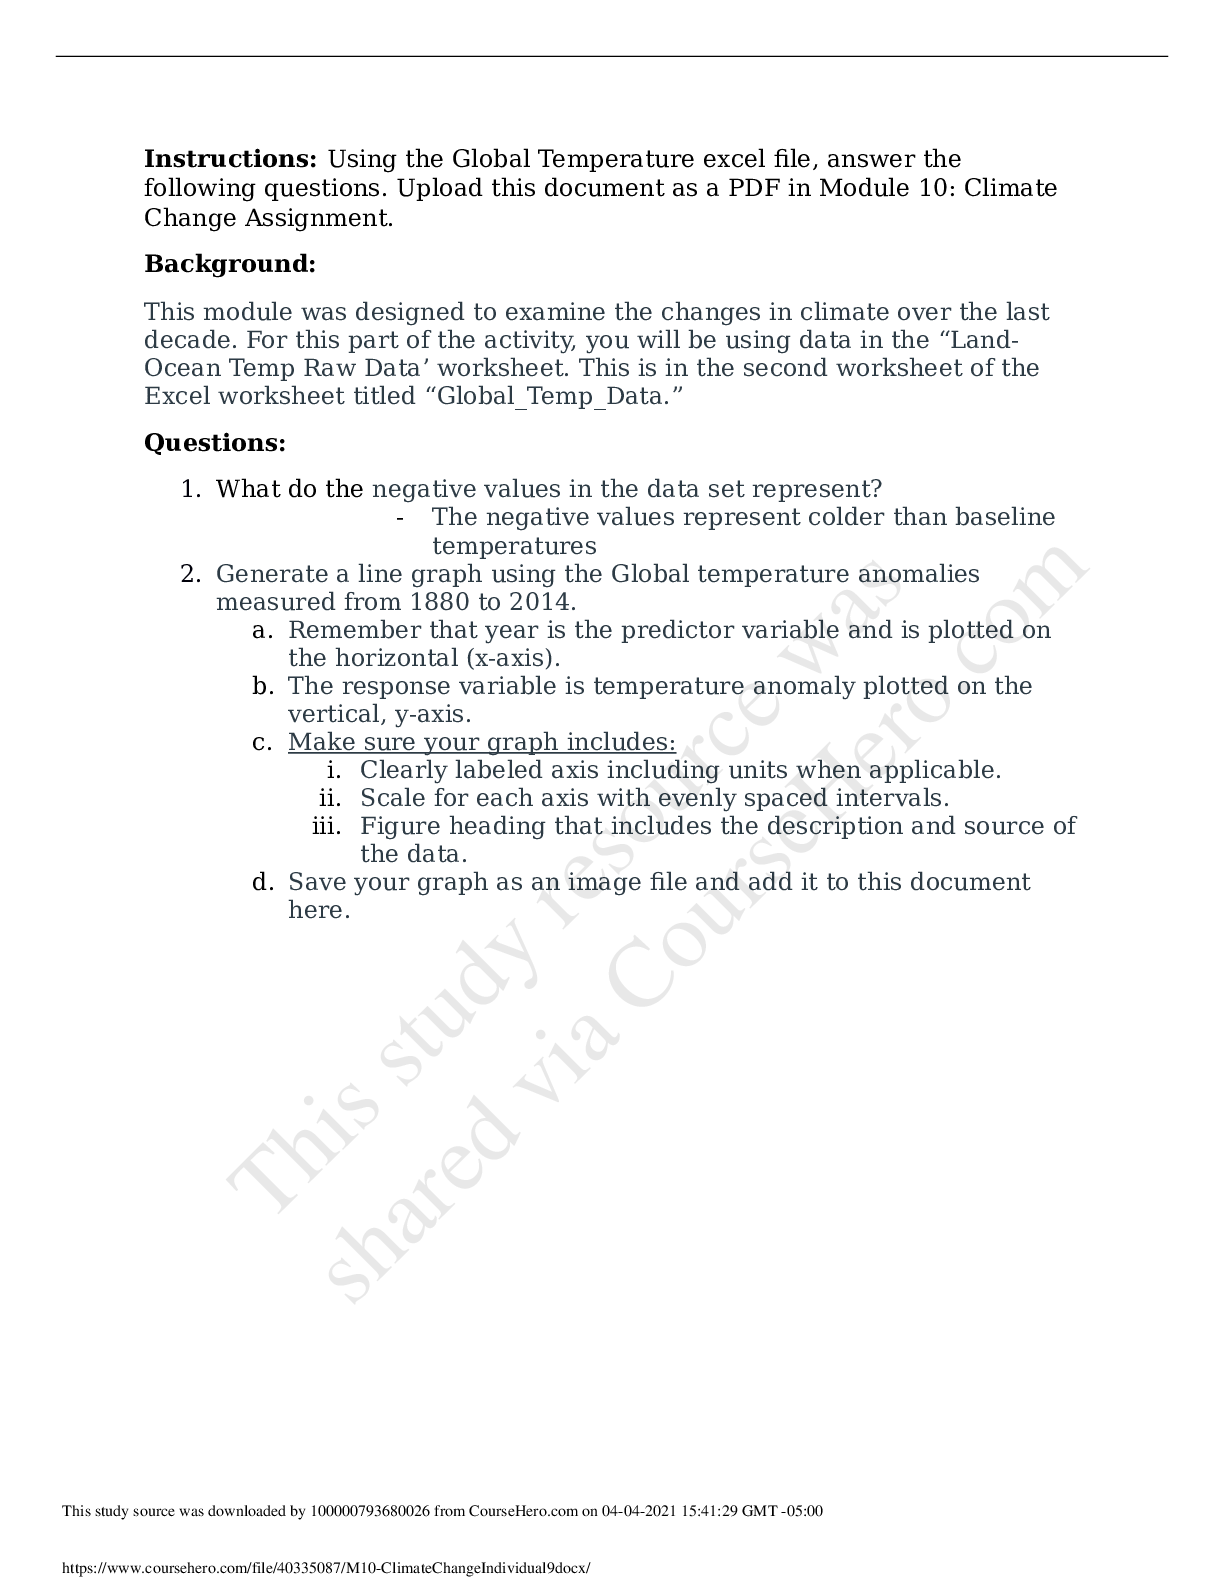
Instructions: Using the Global Temperature excel file, answer the following questions. Upload this document as a PDF in Module 10: Climate Change Assignment. Background: This module was designed t... o examine the changes in climate over the last decade. For this part of the activity, you will be using data in the “LandOcean Temp Raw Data’ worksheet. This is in the second worksheet of the Excel worksheet titled “Global_Temp_Data.” Questions: 1. What do the negative values in the data set represent? - The negative values represent colder than baseline temperatures 2. Generate a line graph using the Global temperature anomalies measured from 1880 to 2014. a. Remember that year is the predictor variable and is plotted on the horizontal (x-axis). b. The response variable is temperature anomaly plotted on the vertical, y-axis. c. Make sure your graph includes: i. Clearly labeled axis including units when applicable. ii. Sca [Show More]
Last updated: 1 year ago
Preview 1 out of 3 pages
Reviews( 0 )
Document information
Connected school, study & course
About the document
Uploaded On
Apr 05, 2021
Number of pages
3
Written in

Additional information
This document has been written for:
Uploaded
Apr 05, 2021
Downloads
0
Views
26


.png)


.png)


.png)


.png)


.png)

.png)
.png)
.png)