Health Care > QUESTIONS & ANSWERS > MATH 225N Week 3 Central Tendancy Questions & Answers (summer 2020) Chamberlain College of Nursing. (All)
MATH 225N Week 3 Central Tendancy Questions & Answers (summer 2020) Chamberlain College of Nursing.
Document Content and Description Below
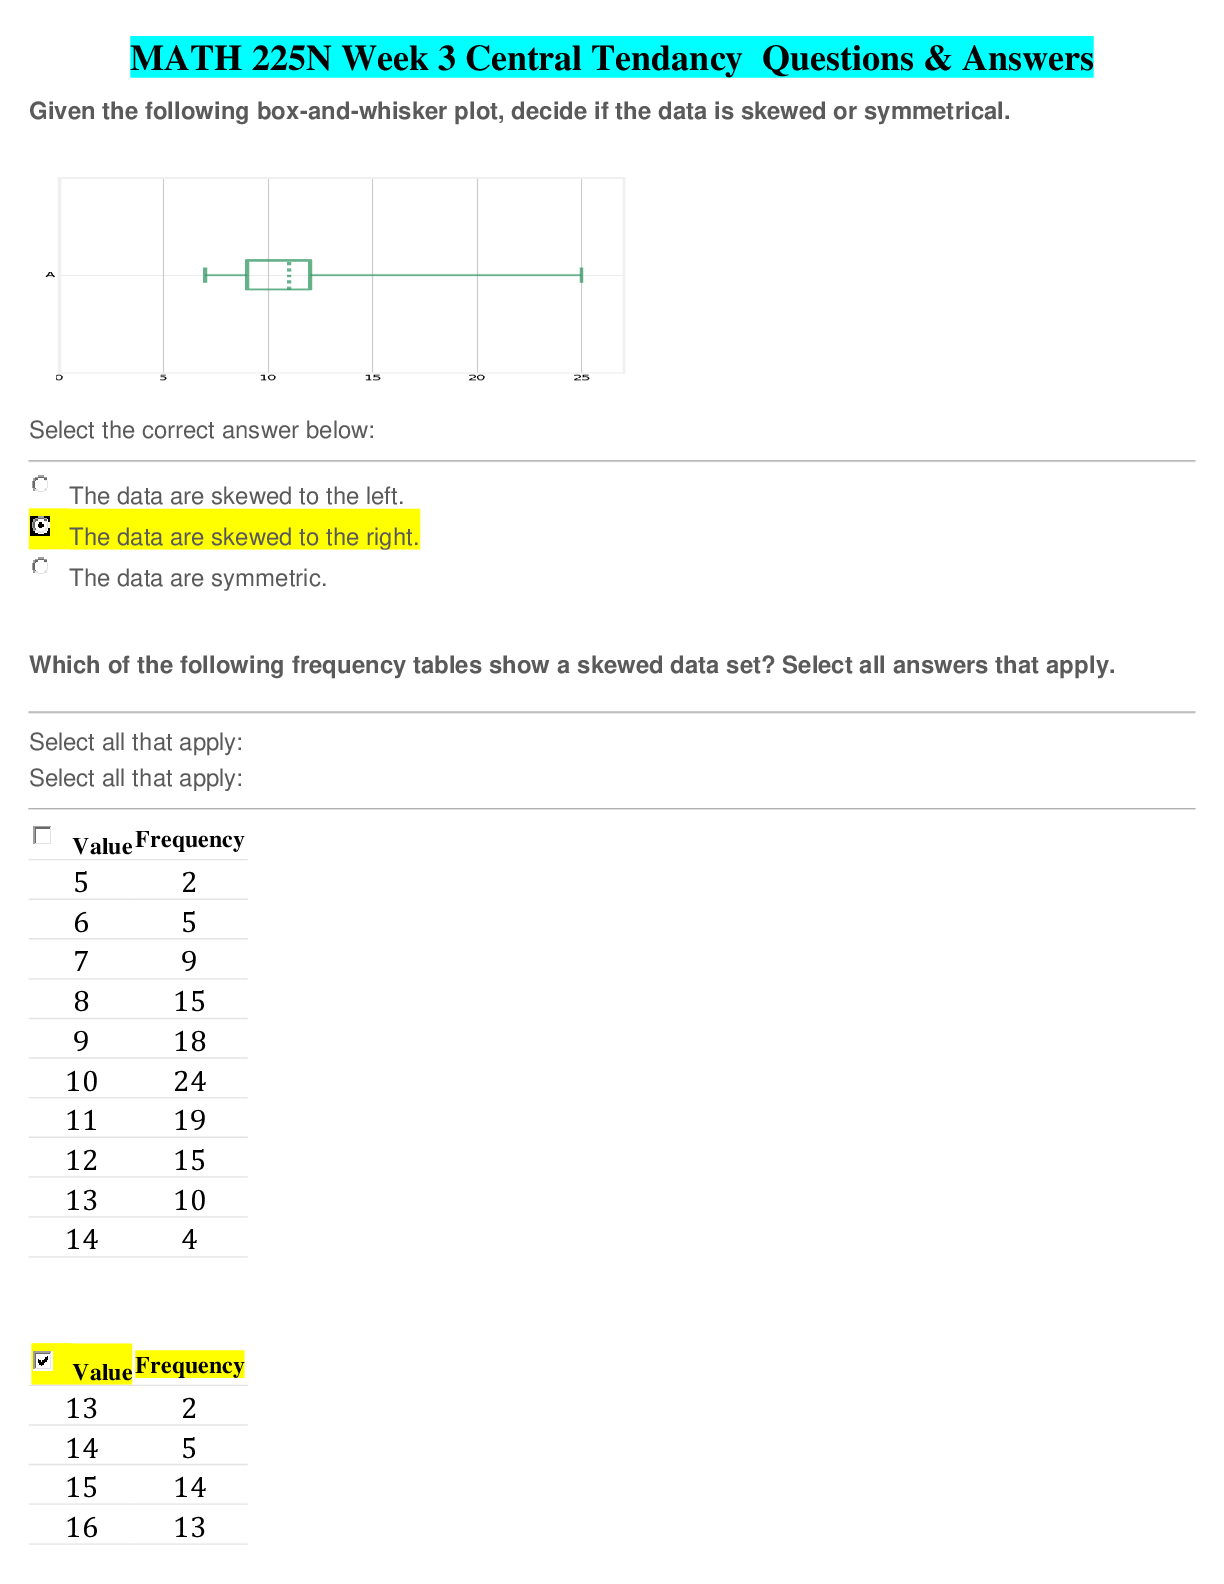
MATH 225N Week 3 Central Tendancy Questions & Answers (summer 2020) Chamberlain College of Nursing. 1. Question: Given the following box-and-whisker plot, decide if the data is skewed or symmetrical.... ……… Select the correct answer below: 2. Question: Which of the following frequency tables show a skewed data set? Select all answers that apply.……… Select the correct answer below: 3. Question: Which of the following frequency tables show a skewed data set? Select all answers that apply. 4. Question: Which of the following frequency tables shows a skewed data set? Select all answers that apply. 5. Question: For the following dataset, you are interested to determine the “spread” of the data……Would you employ calculations for the sample standard deviation, or population standard deviation for this data set: Ages of all students in a Statistics course with an enrollment of 30 students. 6. Question: Which of the data sets represented by the following histograms has the smallest standard deviation? 7. Question: A company is interested to know the variation in yearly sales amount for all 5 salespeople in the company. 8. Question: Which of the data sets represented by the following histograms has the smallest standard deviation? 9. Question: The data set shown below is the sales amount sold by the 5 salespeople in the company (expressed in thousands of dollars): 40,60,65,70,80 ….. Find the variance for this dataset. 10. Question: The data below are the monthly average high temperatures for November, December, January, and February in New York City from the Country Studies/Area Handbook Series sponsored by the U.S. Department of the Army between 1986 and 1998. What is the sample standard deviation? …..54,42,40,40…….Round the final answer to one decimal place. 11. Question: The following data values represent the daily amount spent by a family during a 7 day summer vacation. Find the sample standard deviation of this dataset: $96, $125, $80, $110, $75, $100, $121…. Round the final answer to one decimal place. 12. Question: Which of the following lists of data has the smallest standard deviation? 13. Question: Which of the following lists of data has the smallest standard deviation? 14. Question: Find the median of the following set of miles per gallon for randomly selected sports cars…..36,22,24,30,44,13,21,34,18 15. Question: Find the mode of the following number of times each machine in a car factory needed to be fixed within the last year…..2,5,6,12,14,12,6,2,5,3,14,5 16. Question: Laura runs at the park after school and wants to know the mean number of miles she runs. The numbers for the miles run each day so far are listed below……8,9,7,13,3,9,14…….Find the mean number of miles she runs daily. 17. Question: An art collector bought 20paintings at an art fair, and wants to know the average price of her new paintings. She adds the prices of all the paintings and divides this number by 20 to find an average price of $350 . Is this price a sample mean or a population mean, and which symbol would be used to denote it? 18. Question: Given the following list of the number of pens randomly selected students purchased in the last semester, find the median…..13,7,8,37,32,19,17,32,12,26 19. Question: Find the mode of the following amounts of exercise (in hours) randomly selected runners completed during a weekend……2,14,14,4,2,4,1,14,4,4,8 20. Question: Find the mode of the following list of points earned on a 16 point quiz given during a finance class. 7,7,3,2,7,16,12,16,12 21. Question: Find the median of the following set of data. 35,43,18,35,29,27,19,19…….Give your answer as a number only. For example, if you found the median was 34, you would enter 34. 22. Question: Each person in a group shuffles a deck of cards and keeps selecting a card until an ace appears. Find the mode of the following number of cards drawn from a deck until an ace appears. 14,10,7,14,9,9,10,12,9,7,12 23. Question: A grandfather wants to know the average height of all his grandchildren. He finds that the heights of his 9grandchildren are given in inches by…63,71,60,59,74,60,60,75,58. 24. Question: What is the population mean of the height of his grandchildren in inches? Round your answer to the nearest tenth of an inch and do not include units. 25. Question: Given the following list of the number of pencils randomly selected students used in a school year, find the median…..10,22,6,7,19,5,27 26. Question: A teacher randomly selects 10out of her 30 students and finds that the mean height of those 10 students is 5′2″. Is this a sample mean or a population mean, and which symbol would be used to denote it? 27. Question: A data set lists the number of strikes scored per team during a bowling league championship. For this data set, the minimum is 2, the first quartile is 3, the median is 5, the third quartile is 7, and the maximum is 14. Construct a box-and-whisker plot that shows the number of strikes scored. 28. Question: Given the following frequency table of data, what is the potential outlier? 29. Question: Given the following frequency table of data, what is the potential outlier? 30. Question: A data set lists the number of extra credit points awarded on midterm scores of 15students taking a statistics course. For this data set, the minimum is 3, the median is 15, the third quartile is 16, the interquartile range is 4, and the maximum is 19. Construct a box-and-whisker plot that shows the extra credit points awarded. 31. Question: Given the following list of data, what is the five-number summary? 10, 12, 14, 14, 14, 16, 17, 17, 17, 19, 19 32. Question: The following frequency table summarizes a set of data. What is the five-number summary? 33. Question: The following frequency table summarizes a set of data. What is the five-number summary? 34. Question: The following frequency table summarizes a set of data. What is the five-number summary? 35. Question: Given the following frequency table of data, what is the potential outlier? 36. Question: The five number summary for a set of data is given below. What is the interquartile range of the set of data? Enter just the number as your answer. For example, if you found that the interquartile range was 25, you would enter 25. 37. Question: The five number summary for a set of data is given below. Using the interquartile range, which of the following are outliers? Select all correct answers. 38. Question: Given the following frequency table of data, what is the potential outlier? 39. Question: The five number summary for a set of data is given below….. What is the interquartile range of the set of data? 40. Question: The five number summary for a set of data is given below……Using the interquartile range, which of the following are outliers? Select all correct answers. 41. Question: A data set lists the number of hours each student, from a finance class, studied for a midterm. For this data set, the minimum is 3, the median is 6, the third quartile is 9, the interquartile range is 5, and the maximum is 17. Construct a box-and-whisker plot that shows the number of hours studied. Begin by first placing the middle dot on the median. Then work on placing the rest of the points starting with the ones closest to the median. 42. Question: A data set lists the number of hours waiters worked at a restaurant every Friday during the last year. For this data set, the minimum is 1, the median is 5, the third quartile is 8, the interquartile range is 4, and the maximum is 17. Construct a box-and-whisker plot that shows the number of hours worked on a Friday. 43. Question: The following dataset represents the favorite color reported by young children at a birthday party: Blue, Green, Red, Blue, Blue, Yellow, Pink, Yellow, Red, Red, Blue, Blue, Blue, Green, Blue……Which of the following would be best to describe a typical value in the dataset? 44. Question: The following histogram shows the monthly rents reported in a survey of university students. Which of the following would be a reasonable measure of central tendency for this dataset? Select all that apply. 45. Question: The following dataset represents the dollar amounts of donations collected at the entrance to a free museum during one hour…….. Is the median a reasonably good measure of central tendency for this dataset? What if the outlier were removed from consideration? 46. Question: The following dataset represents the math test scores for a class of 20students….. 90, 60, 85, 100, 100, 90, 100, 75, 100, 95, 95, 85, 30, 100, 40, 15, 100, 90, 70, 80…….. Identify the best measure of central tendency for this dataset. 47. Question: The following is a dataset of salaries for a company (in thousands). Find the mean and median and determine if the mean or median is the better measure of central tendency…..11,87,85,95,92,93,97 48. Question: The following dataset represents the math test scores for a class of 20students……. 90, 85, 95, 100, 100, 90, 100, 65, 100, 85, 80, 95, 80, 100, 85, 75, 100, 90, 90, 75…..Would the mode be a good measure of central tendency for this dataset? 49. Question: The following histogram shows menu prices of entrees at a local restaurant. Identify the best measure of central tendency for this dataset 50. Question: The following dataset represents the math test scores for a class of 20students…… 90, 85, 95, 100, 100, 90, 100, 70, 100, 85, 80, 95, 80, 100, 85, 75, 100, 90, 90, 75…… How many outliers are in this dataset? 51. Question: A trainer would like to find the mean number of sports drinks the people in her class had in the last week. She collects data from 26participants in her aerobics class. The graph shows the frequency for the number of sports drinks……..Find the mean number of sports drinks consumed by the 26 participants, and round your answer to the nearest tenth. Record your answer by dragging the purple point to the mean. 52. Question: A student at a fashion school would like to find the mean number of hats his fellow students own. He collects data from 25students in his fashion design course. The graph shows the frequency for the number of hats owned by his fellow classmates……Find the mean number of hats owned by the 25students, and round your answer to the nearest tenth. Record your answer by dragging the purple point to the mean. 53. Question: Given the frequency table below, which equation shows the mean of the set of data? 54. Question: For the grouped frequency table shown below which shows salaries at a company (expressed in thousands), find the midpoint for the second row in the table: 55. Question: Given the frequency table below, what is the estimated mean? Round your answer to two decimal places. 56. Question: A manager at a shoe factory would like to find the mean number of breaks taken by employees on a particular Friday. He collects data from 15fellow coworkers in the factory. The graph shows the frequency for the number of breaks taken during this time period…….Find the mean number of breaks for the 15 coworkers, and round your answer to the nearest tenth. Record your answer by dragging the purple point to the mean. 57. Question: A student would like to find the mean number of people living in households in a neighborhood. She collects data from 65homes in the area. The graph shows the frequency for the number of people living in the homes. 58. Question: Find the mean number of people living in the 65homes, and round your answer to the nearest tenth. Record your answer by dragging the purple point to the mean…….A student would like to find the mean number of people living in households in a neighborhood. She collects data from 65homes in the area. The graph shows the frequency for the number of people living in the homes…….Find the mean number of people living in the 65 homes, and round your answer to the nearest tenth. Record your answer by dragging the purple point to the mean. 59. Question: Find the mode of the following amounts (in thousands of dollars) in checking accounts of randomly selected people aged 20-25……2,4,4,7,2,9,9,2,4,4,11 60. Question: Find the mode of the following number of states randomly selected travelers at a service plaza visited in the past three years…….18,13,8,8,13,10,13,10,9,18 61. Question: The following is a dataset of the average weekly number of cups of coffee consumed by employees in an office. Find the mean and median and determine if the mean or median is the better measure of central tendency…….5,0,5,2,0,10,7,8,10,21,5,8,2,5,3,5 62. Question: The following histogram shows the dollar amounts of donations collected by a charitable organization over the course of a month. Identify the best measure of central tendency for this dataset. 63. Question: The following dataset represents the math test scores for a class of 20students……90, 85, 95, 100, 100, 90, 100, 65, 100, 85, 80, 95, 80, 100, 85, 75, 100, 90, 90, 75…..Suppose that the last value, 75, was mistakenly recorded as 5. What measure(s) of the typical value in a dataset would be affected by this error? Select all that apply. [Show More]
Last updated: 1 year ago
Preview 1 out of 26 pages
Reviews( 1 )

by Veiland83 · 3 years ago
Great
Recommended For You
Statistics> QUESTIONS & ANSWERS > MATH 225N Medical Statistics Mid Term Exam. Chamberlain College of Nursing. All Questions and Answers (All)
MATH 225N Medical Statistics Mid Term Exam. Chamberlain College of Nursing. All Questions and Answers
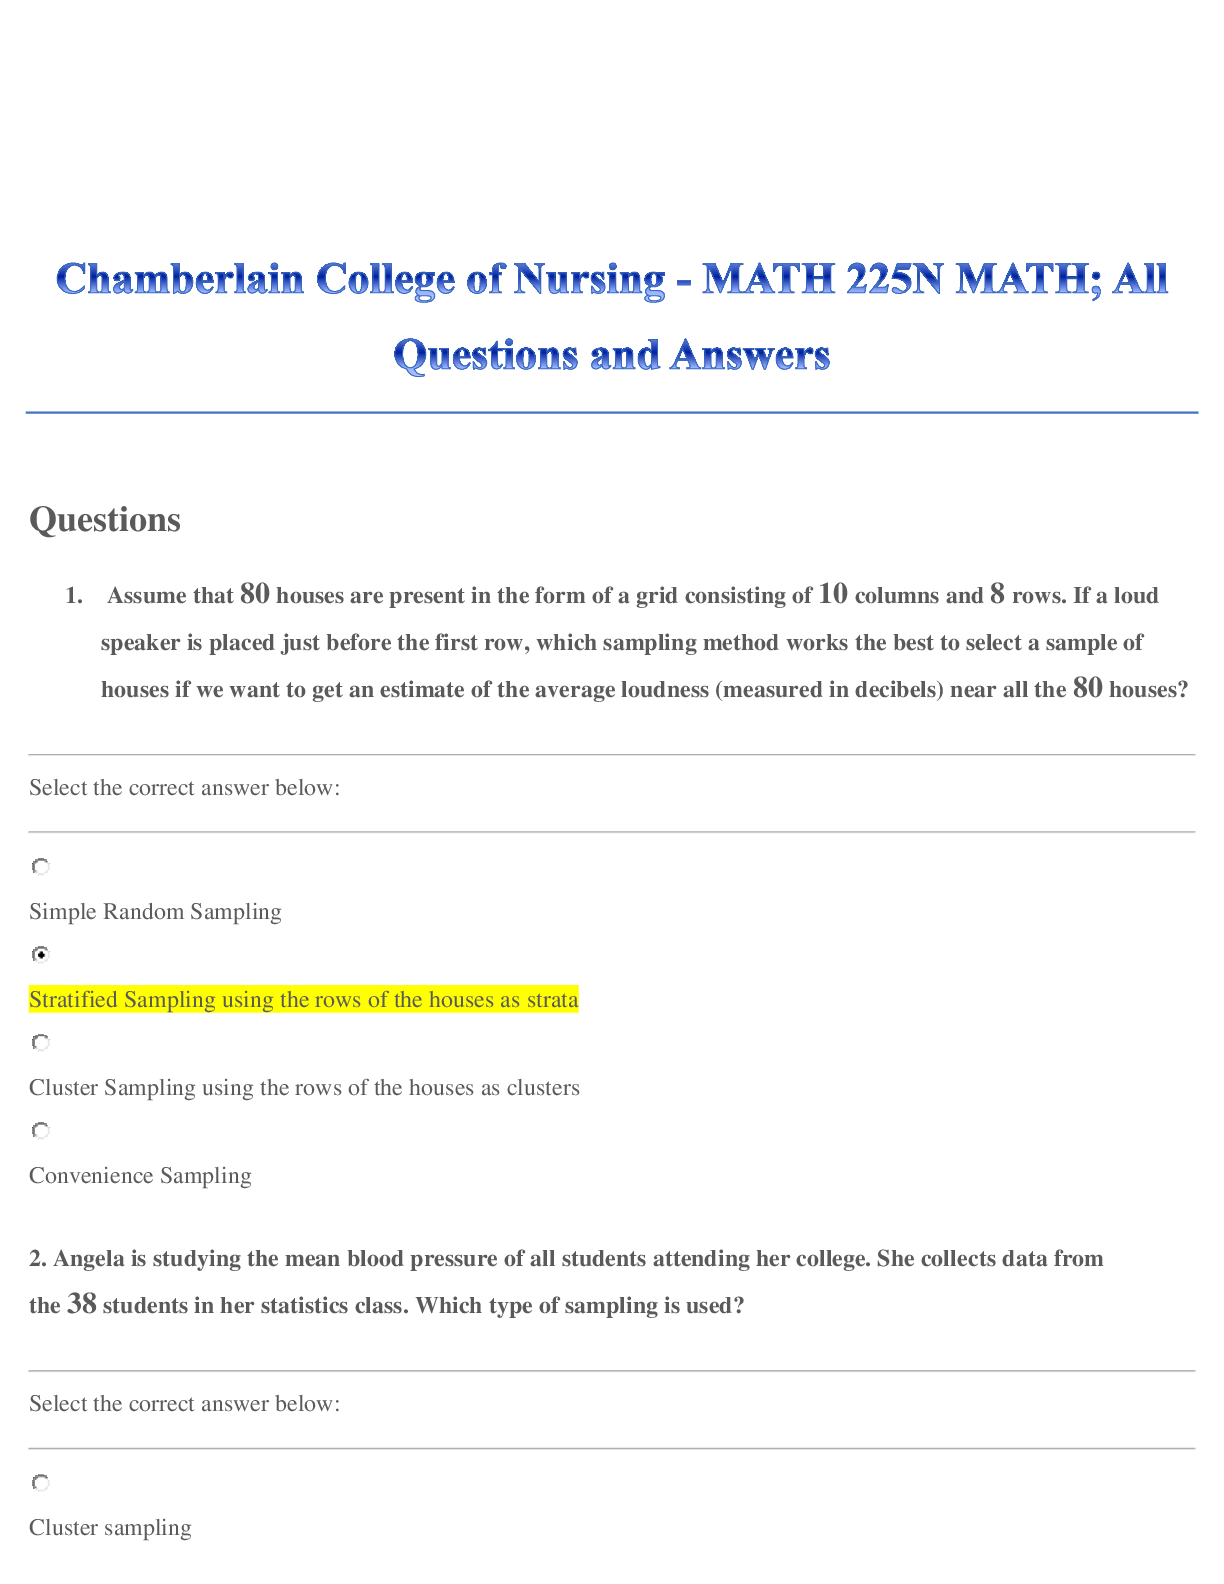
MATH 225N Medical Statistics. Chamberlain College of Nursing. Questions 1. Assume that 80 houses are present in the form of a grid consisting of 10 columns and 8 rows. If a loud speaker is placed...
By Kirsch , Uploaded: Mar 30, 2020
$15
*NURSING> QUESTIONS & ANSWERS > NURSING NR 228 Nutrition- Week 3 nutrition edapt - Introduction to Energy - Chamberlain College of Nursing (All)
NURSING NR 228 Nutrition- Week 3 nutrition edapt - Introduction to Energy - Chamberlain College of Nursing
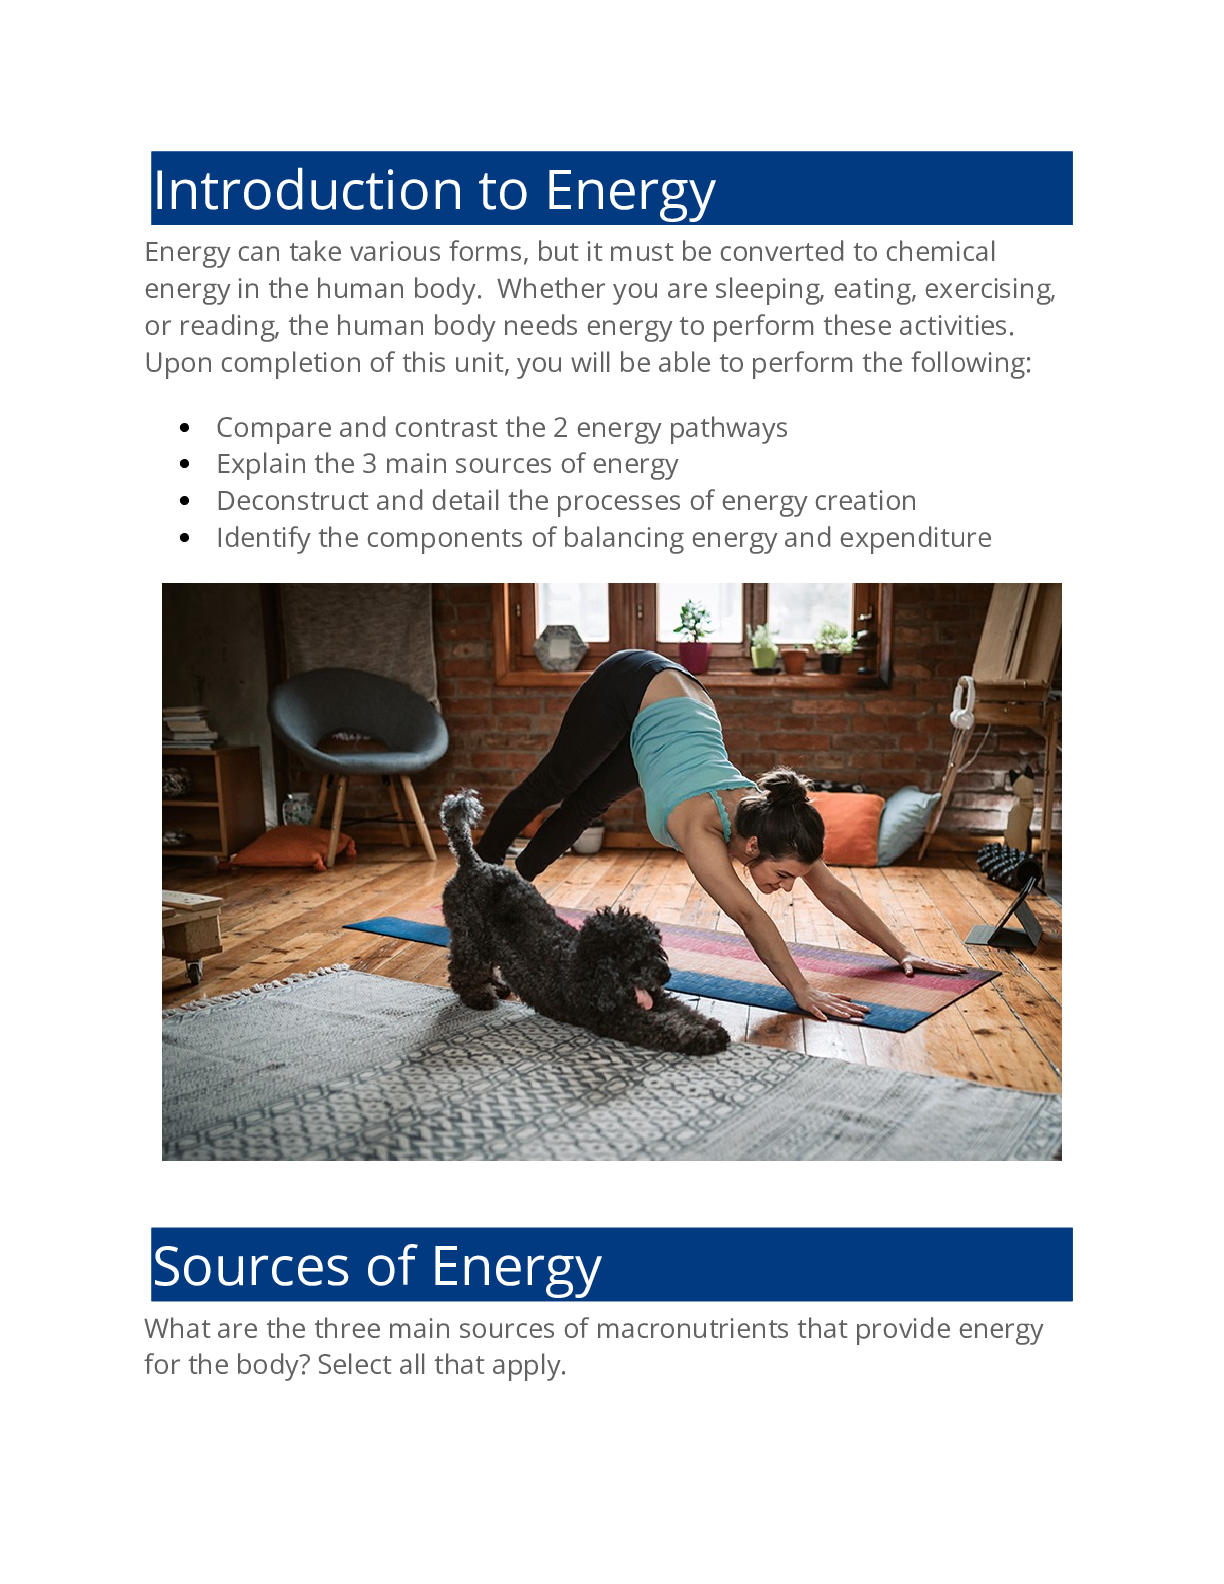
NURSING NR 228 Nutrition- Week 3 nutrition edapt - Introduction to Energy - Chamberlain College of Nursing
By QuizMaster , Uploaded: Mar 29, 2023
$8
*NURSING> QUESTIONS & ANSWERS > NR 601 Midterm Exam Chamberlain College Of Nursing (Already graded A) (All)
NR 601 Midterm Exam Chamberlain College Of Nursing (Already graded A)
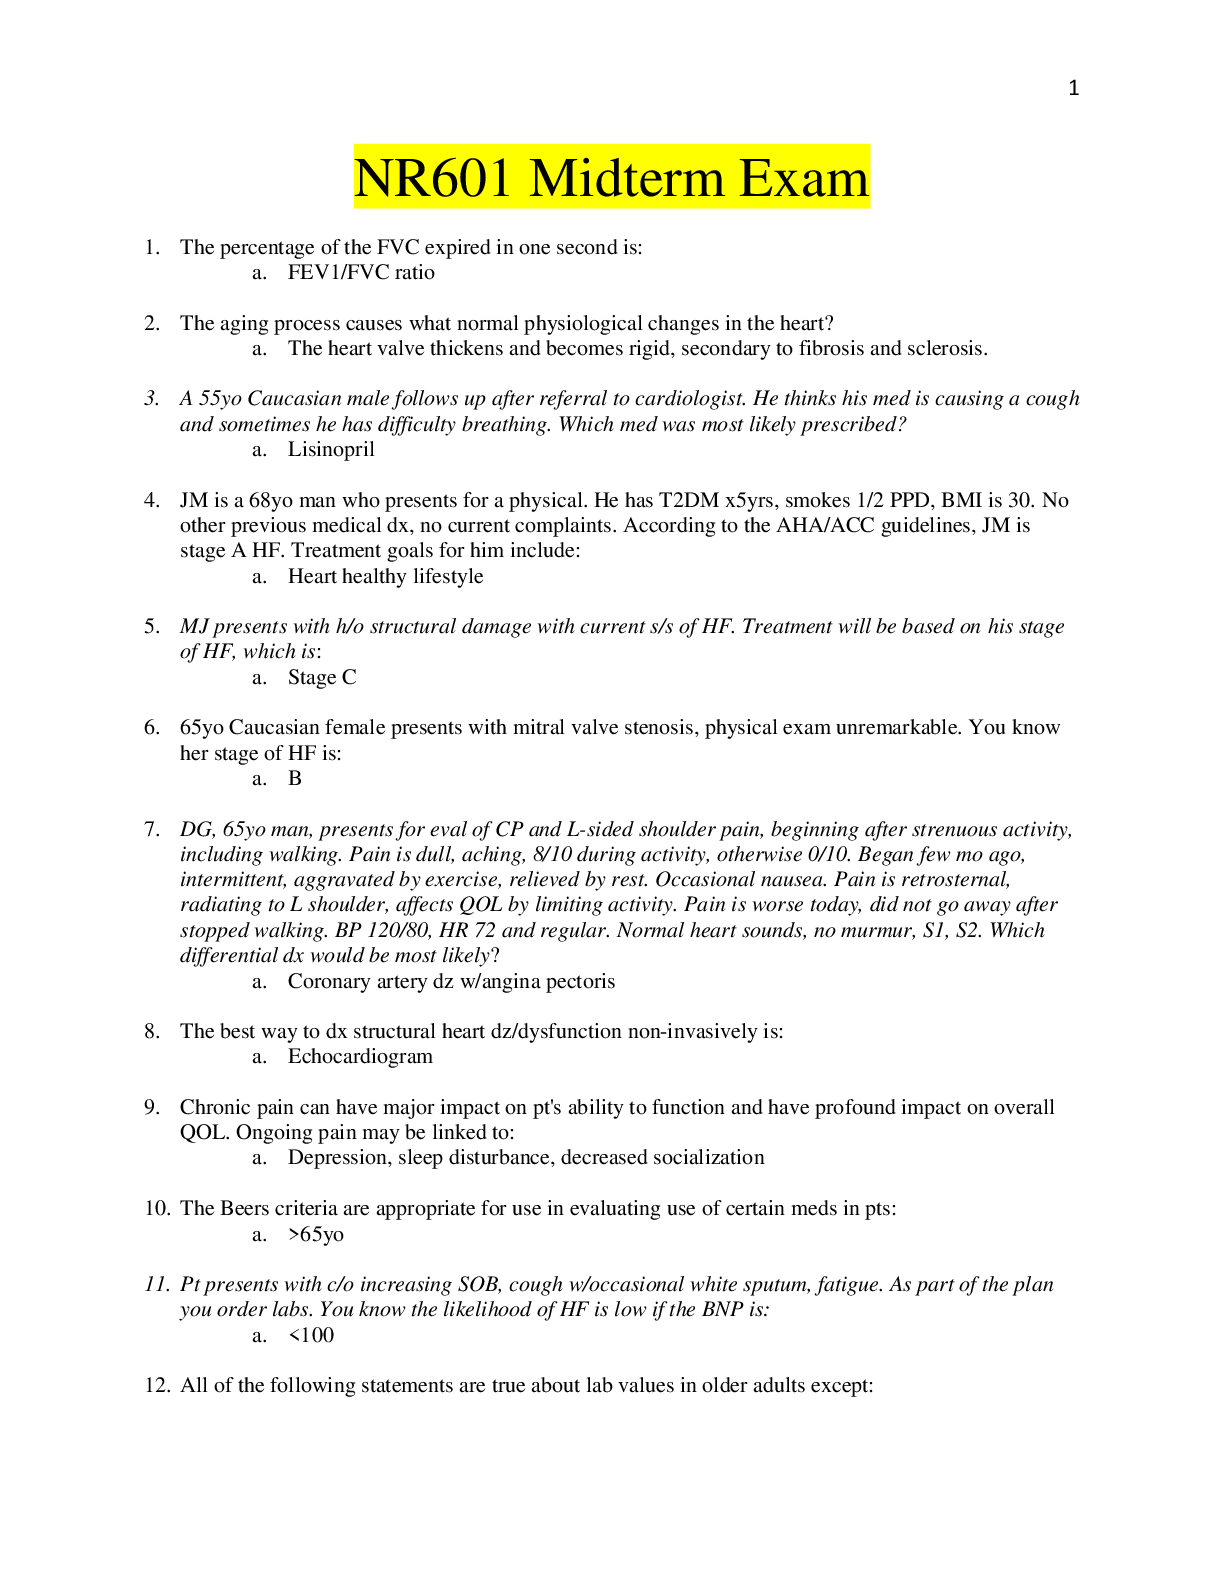
NURS 601 Midterm Exam / NURS601 Midterm Exam / NUR 601 Midterm Exam / NUR601 Midterm Exam /NR601 Midterm Exam / NR 601 Midterm Exam : Chamberlain College Of Nursing (Already graded A)
By James , Uploaded: Jun 01, 2020
$11
Mathematics> QUESTIONS & ANSWERS > MATH225N Week 1 Assignment: Variables and Measures of Data: Chamberlain College of Nursing Graded A) (All)
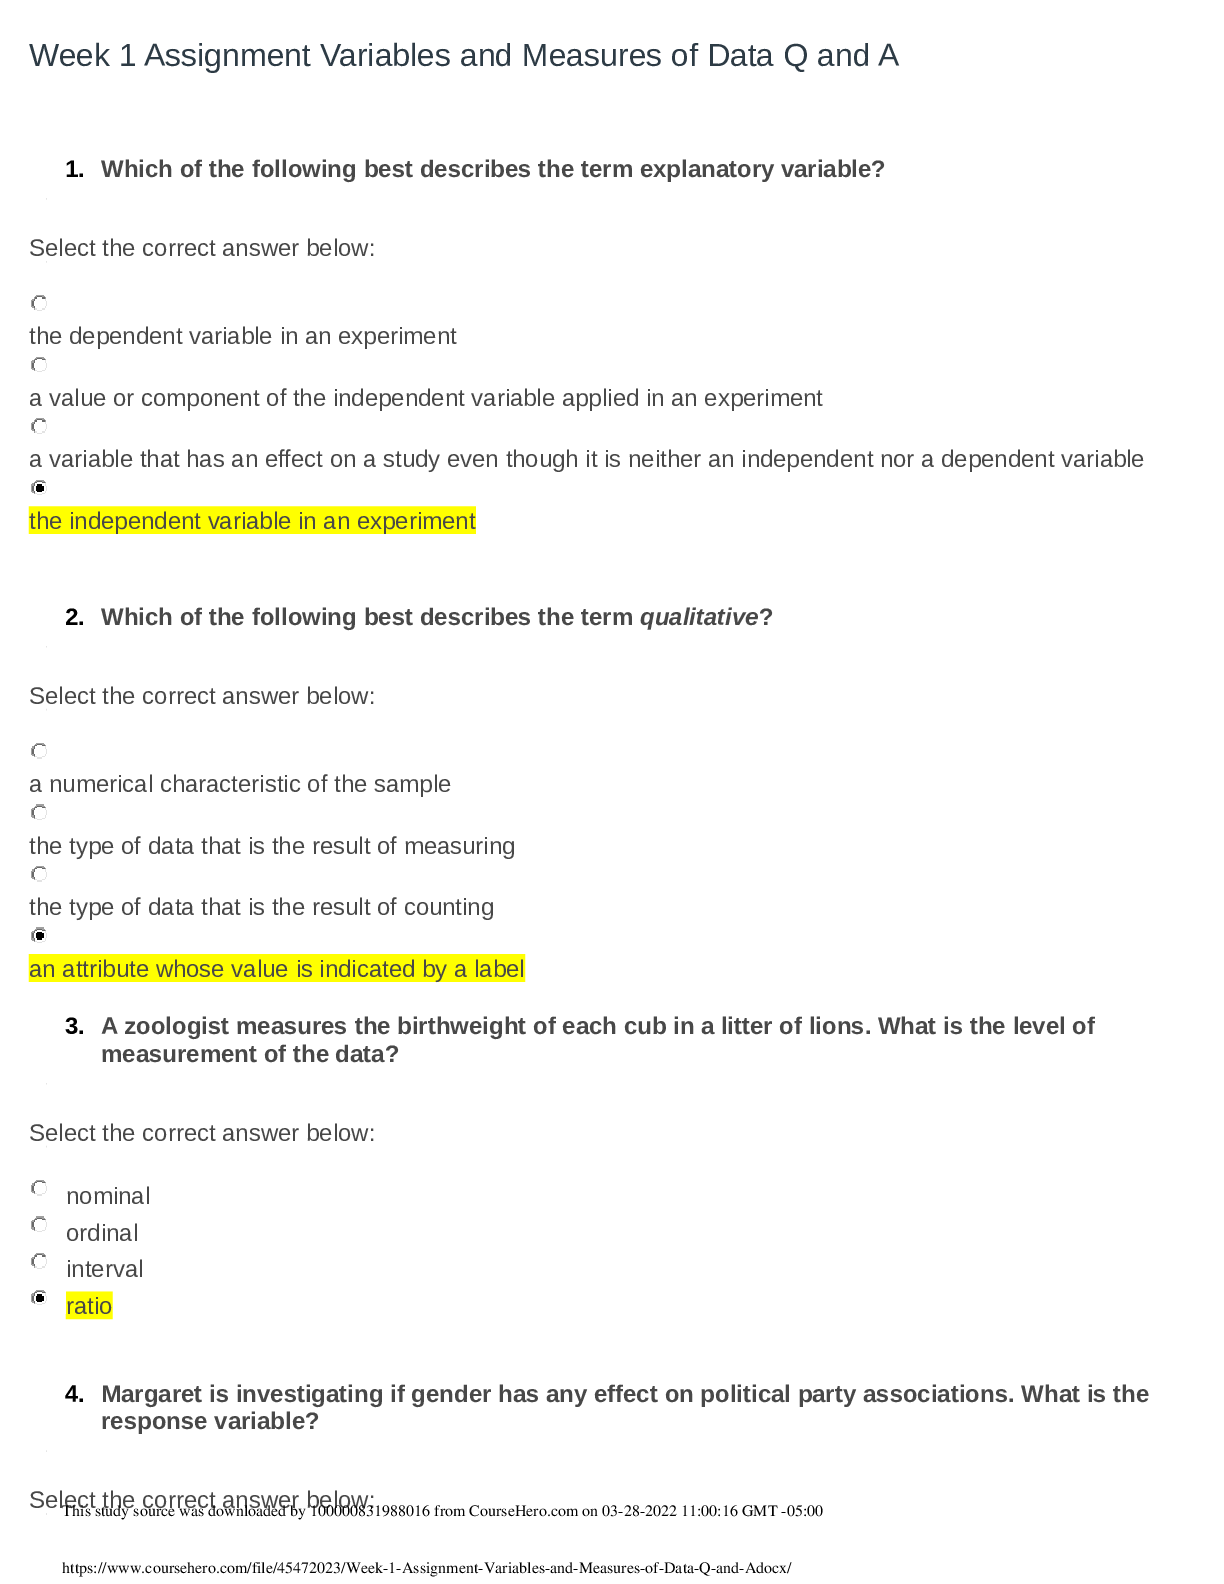
MATH225N Week 1 Assignment: Variables and Measures of Data: Chamberlain College of Nursing Graded A)
MATH 225 Week 1 Assignment: Variables and Measures of Data: Statistical reasoning for health sciences (Latest): Chamberlain College of Nursing MATH225N Week 1 Assignment: Variables and Measures of Dat...
By succeeded , Uploaded: Oct 07, 2020
$10
Statistics> QUESTIONS & ANSWERS > Math 225N Statistics: Week 4 Quiz. - Chamberlain College of Nursing. All Answers Provided (All)
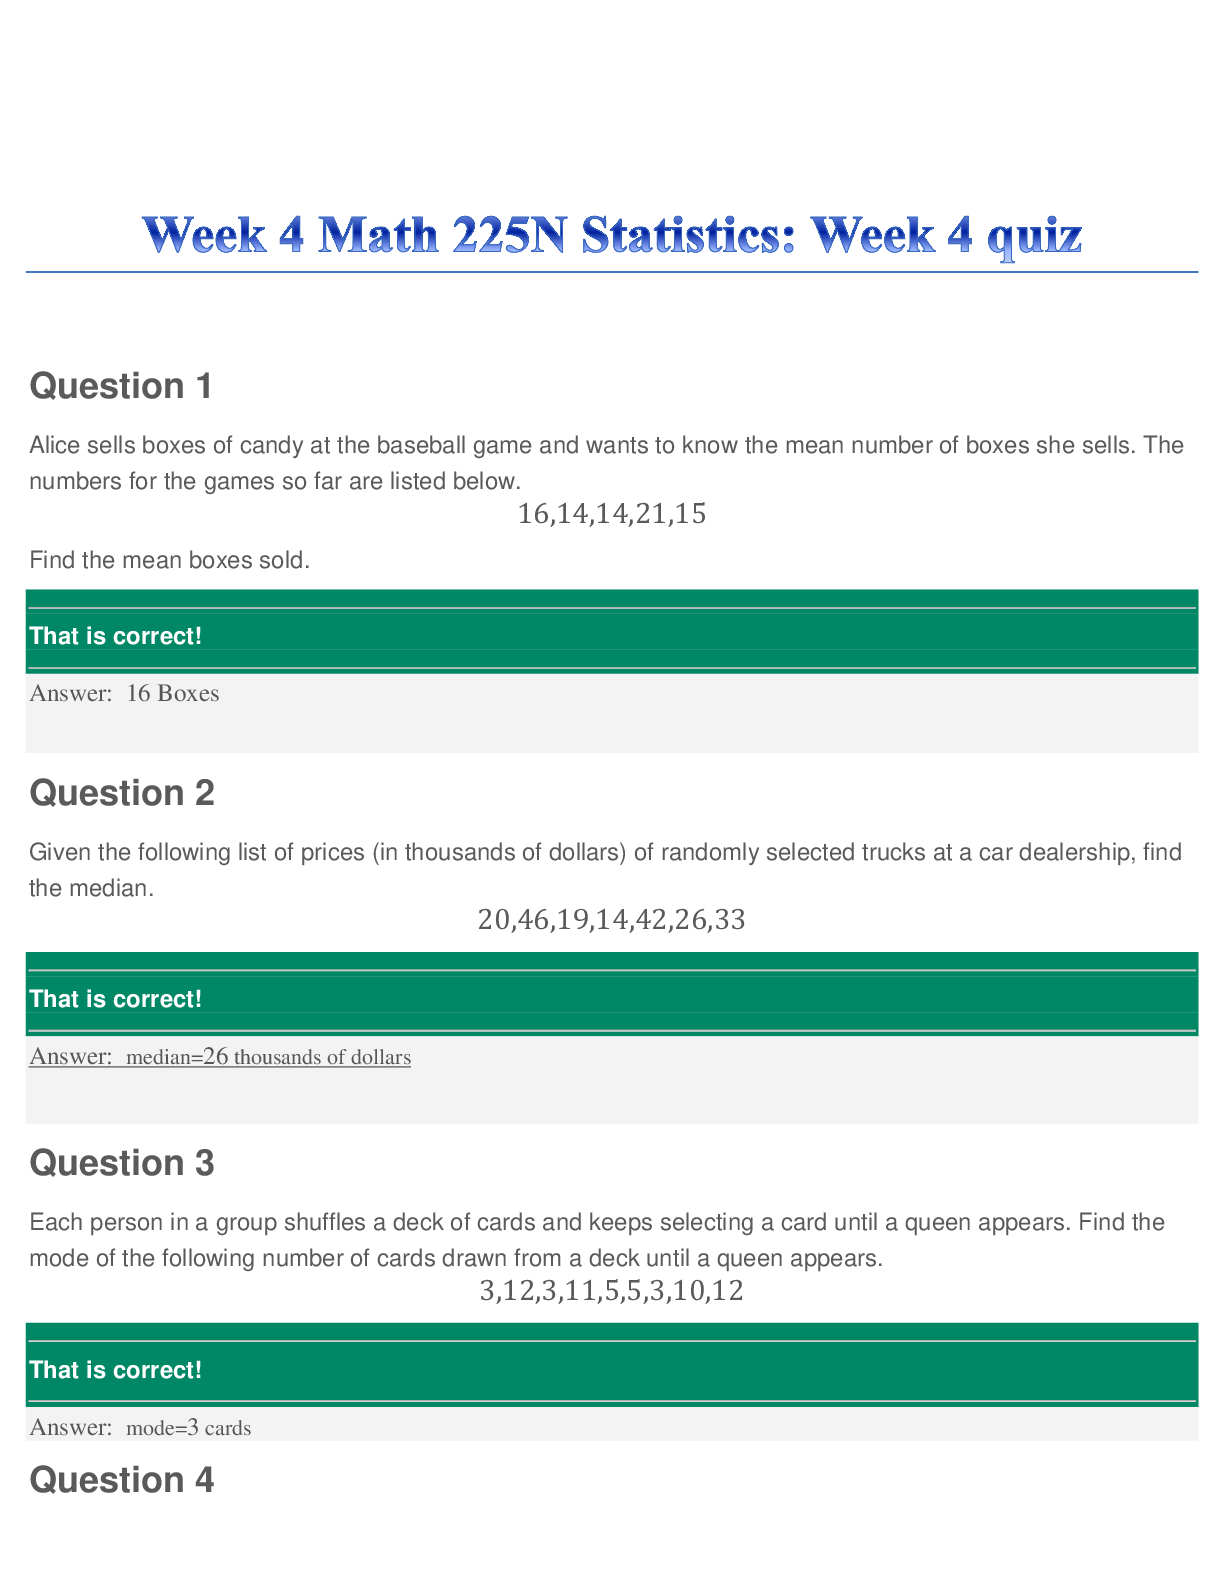
Math 225N Statistics: Week 4 Quiz. - Chamberlain College of Nursing. All Answers Provided
Math 225N Statistics: Week 4 Quiz. - Chamberlain College of Nursing. Question 1 Alice sells boxes of candy at the baseball game and wants to know the mean number of boxes she sells. The numbers fo...
By Kirsch , Uploaded: Mar 29, 2020
$10
*NURSING> QUESTIONS & ANSWERS > NURSING NR 228 Nutrition Week 7 edapt - Nutrition and Biliary Health- nutrition for gastrointestinal health - Chamberlain College of Nursing (All)
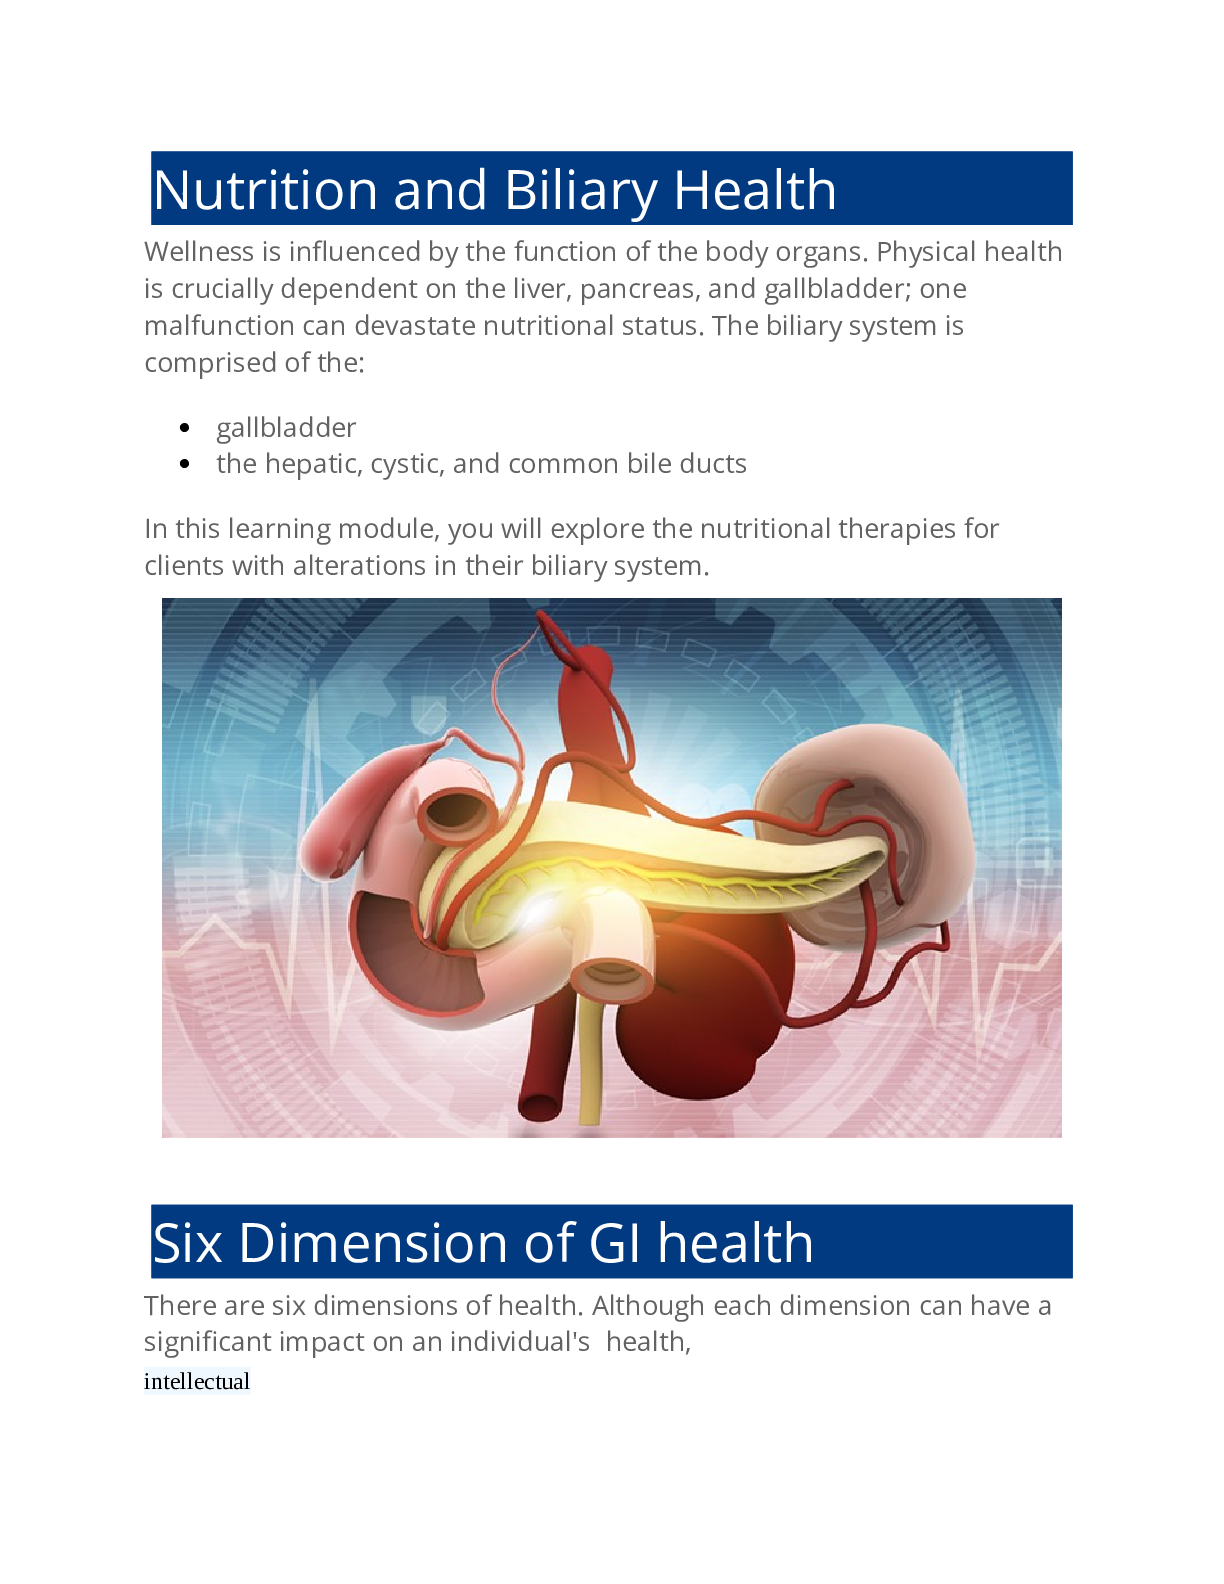
NURSING NR 228 Nutrition Week 7 edapt - Nutrition and Biliary Health- nutrition for gastrointestinal health - Chamberlain College of Nursing
NURSING NR 228 Nutrition Week 7 edapt - Nutrition and Biliary Health- nutrition for gastrointestinal health - Chamberlain College of Nursing
By QuizMaster , Uploaded: Mar 29, 2023
$10.5
Statistics> QUESTIONS & ANSWERS > MATH 225N WEEK 4 QUIZ. Chamberlain College of Nursing (All)

MATH 225N WEEK 4 QUIZ. Chamberlain College of Nursing
MATH 225N WEEK 4 QUIZ. Chamberlain College of Nursing Alice sells boxes of candy at the baseball game and wants to know the mean number of boxes she sells. The numbers for the games so far are liste...
By Academia1434 , Uploaded: Oct 15, 2020
$13
Health Care> QUESTIONS & ANSWERS > Chamberlain College of Nursing - NR 507 Patho Midterm week 4 exam - Latest 2019; Verified Answers with Instructor's Explanations. (All)

Chamberlain College of Nursing - NR 507 Patho Midterm week 4 exam - Latest 2019; Verified Answers with Instructor's Explanations.
1. Question : Hemolytic disease of the newborn (HDN) can occur if the mother: Student Answer: Is Rh-positive and the fetus is Rh-negative Is Rh-negative and the fetus is Rh-positive Has type A...
By QuizGuider82 , Uploaded: Feb 01, 2022
$13
Health Care> QUESTIONS & ANSWERS > Chamberlain College of Nursing - BIOS 242 Quiz 1 Microbiology, Latest Complete Guide; Attempt Score 29 Out of 30. (All)
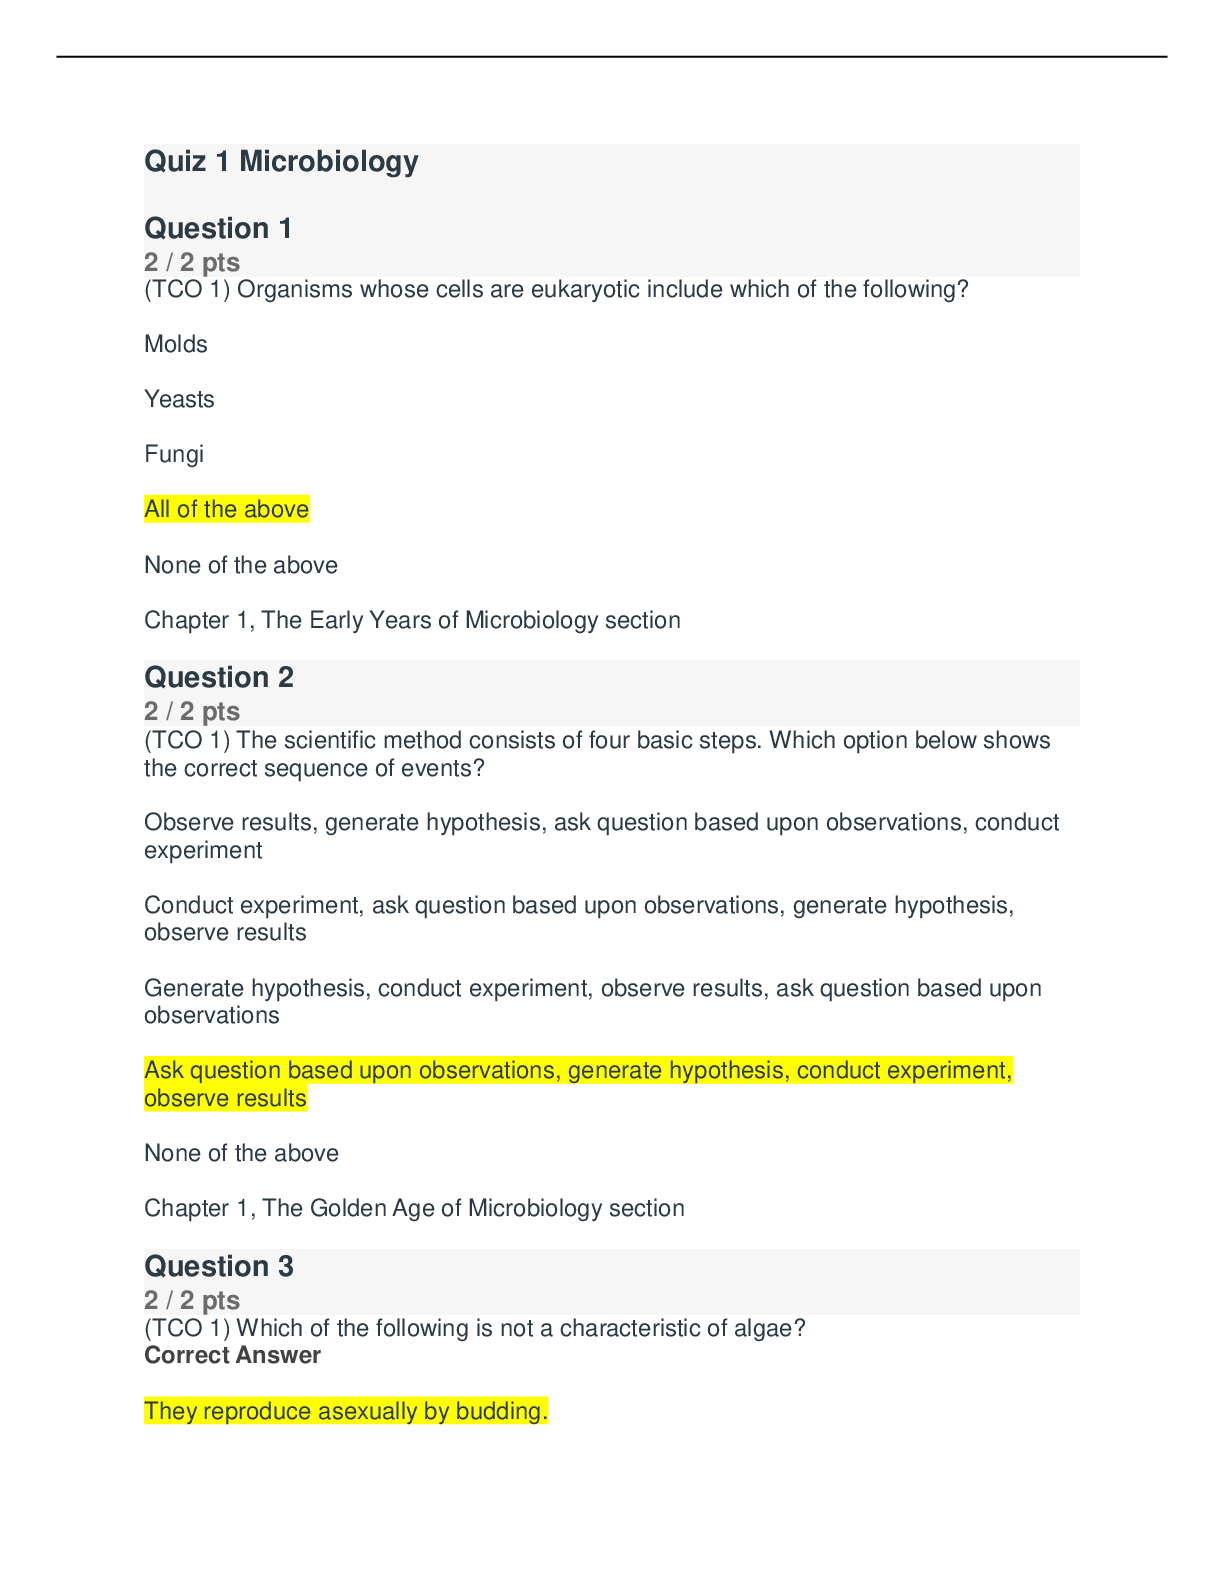
Chamberlain College of Nursing - BIOS 242 Quiz 1 Microbiology, Latest Complete Guide; Attempt Score 29 Out of 30.
Question 2 2 / 2 pts Question 3 2 / 2 pts (TCO 1) Organisms whose cells are eukaryotic include which of the following? Molds Yeasts Fungi All of the above None of the above Chapter 1, The Early...
By QuizGuider82 , Uploaded: Feb 01, 2022
$10
Mathematics> QUESTIONS & ANSWERS > MATH 225 WEEK 8 FINAL EXAM (4 VERSIONS)/ MATH 225N WEEK 8 FINAL EXAM / MATH225 WEEK 8 FINAL EXAM (LATEST, 2020): CHAMBERLAIN COLLEGE OF NURSING |100% CORRECT ANSWERS, DOWNLOAD TO SCORE A| (All)
MATH 225 WEEK 8 FINAL EXAM (4 VERSIONS)/ MATH 225N WEEK 8 FINAL EXAM / MATH225 WEEK 8 FINAL EXAM (LATEST, 2020): CHAMBERLAIN COLLEGE OF NURSING |100% CORRECT ANSWERS, DOWNLOAD TO SCORE A|
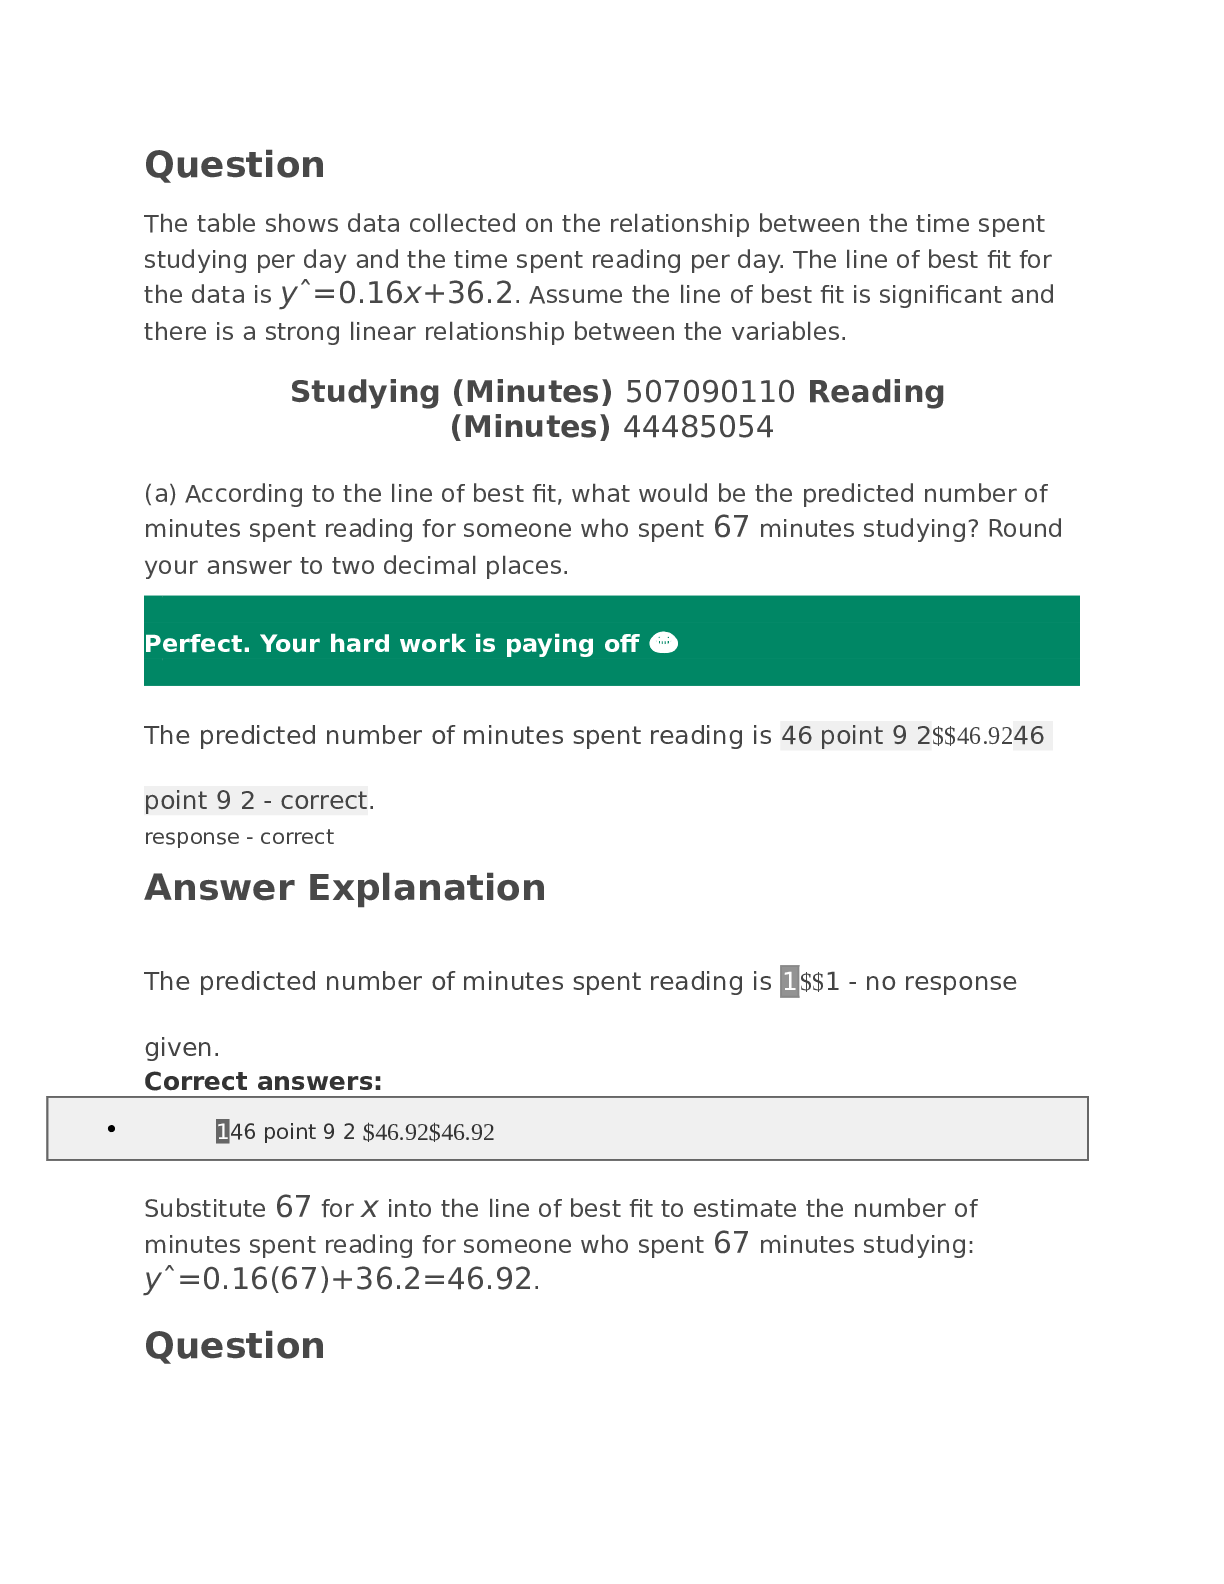
Question The table shows data collected on the relationship between the time spent studying per day and the time spent reading per day. The line of best fit for the data is yˆ=0.16x+36.2. Assume th...
By Nutmegs , Uploaded: Feb 01, 2022
$13
Document information
Connected school, study & course
About the document
Uploaded On
Apr 27, 2020
Number of pages
26
Written in

Additional information
This document has been written for:
Uploaded
Apr 27, 2020
Downloads
1
Views
87