Mathematics > EXAM > MATH 225N Week 8 Final Exam (Version 2) Spring 2022 / MATH225N Week 8 Final Exam Spring 2023 complet (All)
MATH 225N Week 8 Final Exam (Version 2) Spring 2022 / MATH225N Week 8 Final Exam Spring 2023 complete solutions questions & Answers.
Document Content and Description Below
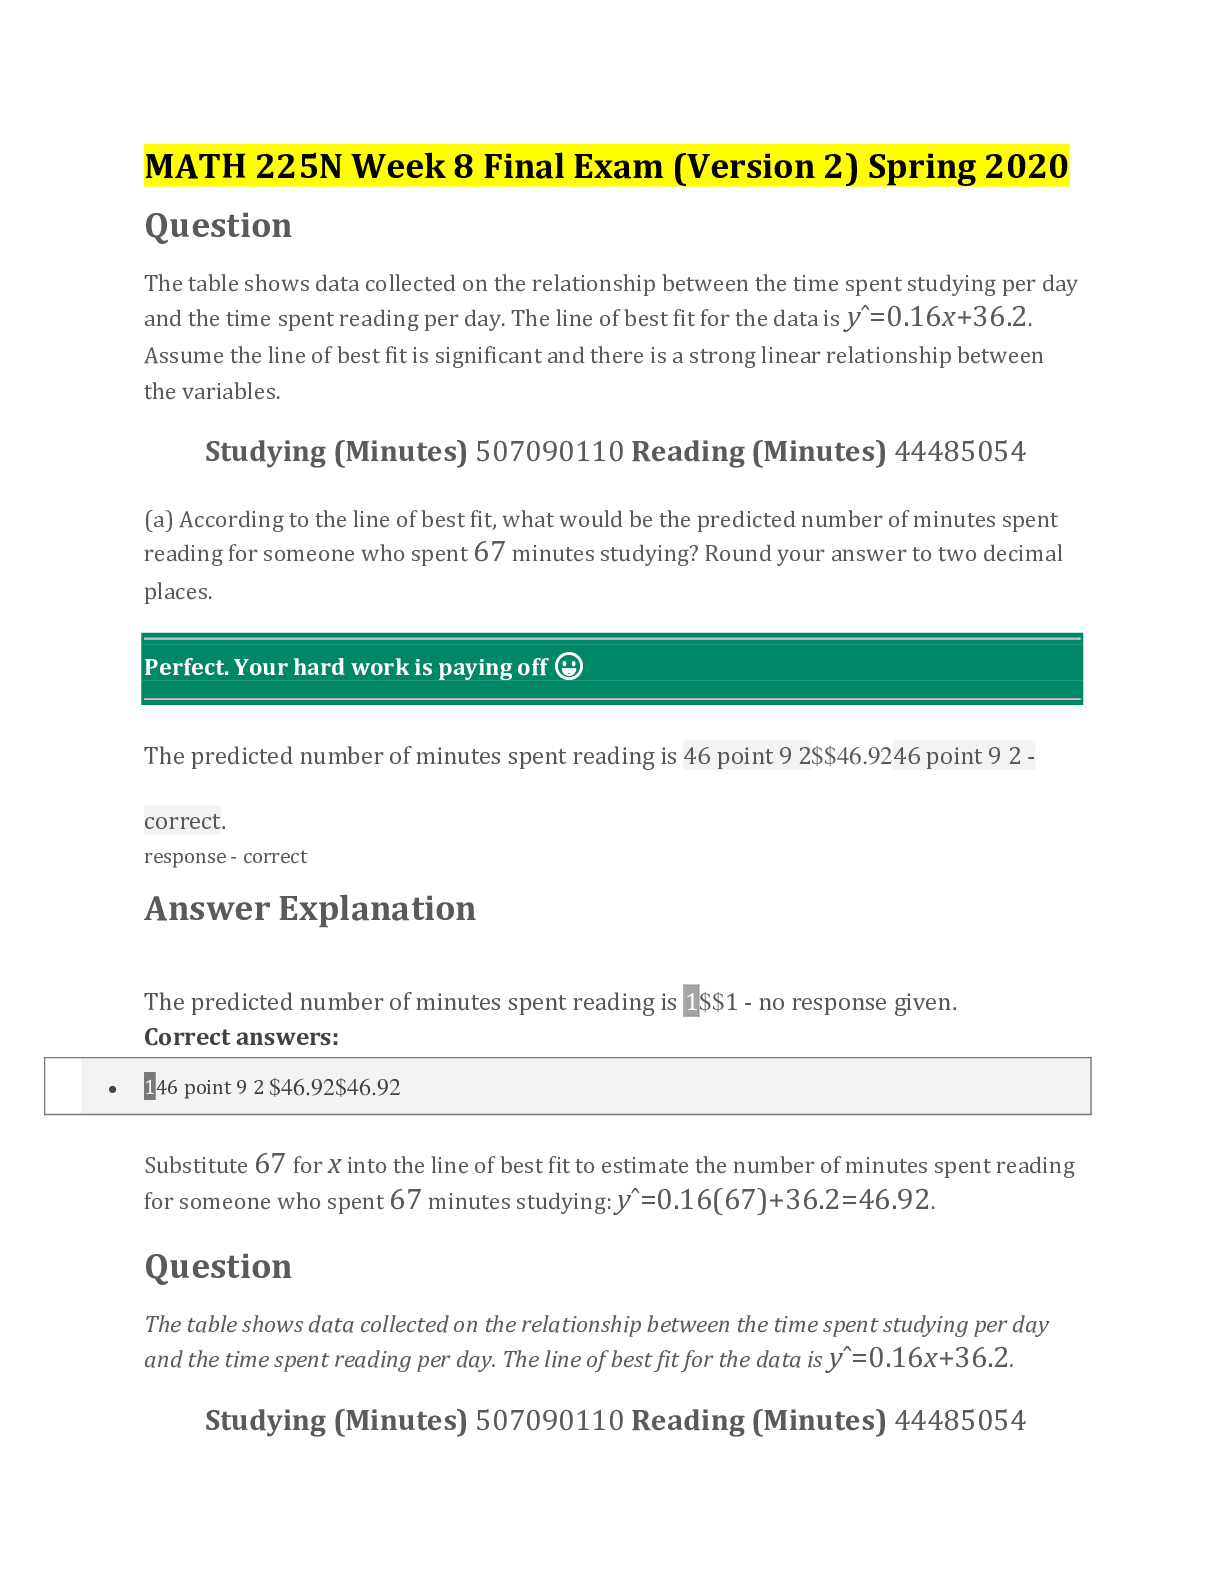
MATH 225N Week 8 Final Exam (Version 2) Spring 2020 Question The table shows data collected on the relationship between the time spent studying per day and the time spent reading per day. The line ... of best fit for the data is yˆ=0.16x+36.2. Assume the line of best fit is significant and there is a strong linear relationship between the variables. Studying (Minutes) 507090110 Reading (Minutes) 44485054 (a) According to the line of best fit, what would be the predicted number of minutes spent reading for someone who spent 67 minutes studying? Round your answer to two decimal places. ________________________________________ ________________________________________ Substitute 67 for x into the line of best fit to estimate the number of minutes spent reading for someone who spent 67 minutes studying: yˆ=0.16(67)+36.2=46.92. Question The table shows data collected on the relationship between the time spent studying per day and the time spent reading per day. The line of best fit for the data is yˆ=0.16x+36.2. (a) According to the line of best fit, the predicted number of minutes spent reading for someone who spent 67 minutes studying is 46.92. (b) Is it reasonable to use this line of best fit to make the above prediction? ________________________________________ ________________________________________ The estimate, a predicted time of 46.92 minutes, is both reliable and reasonable. The estimate, a predicted time of 46.92 minutes, is both unreliable and unreasonable. The estimate, a predicted time of 46.92 minutes, is reliable but unreasonable. The estimate, a predicted time of 46.92 minutes, is unreliable but reasonable. Question Michelle is studying the relationship between the hours worked (per week) and time spent reading (per day) and has collected the data shown in the table. The line of best fit for the data is yˆ=−0.79x+98.8. Assume the line of best fit is significant and there is a strong linear relationship between the variables. (a) According to the line of best fit, what would be the predicted number of minutes spent reading for a person who works 27 hours (per week)? Round your answer to two decimal places, as needed. ________________________________________ Substitute 27 for x into the line of best fit to estimate the number of minutes spent reading for a person who works 27 hours (per week): yˆ=−0.79(27)+98.8=77.47. Question Michelle is studying the relationship between the hours worked (per week) and time spent reading (per day) and has collected the data shown in the table. The line of best fit for the data is yˆ=−0.79x+98.8. (b) Is it reasonable to use this line of best fit to make the above prediction? ________________________________________ ________________________________________ The estimate, a predicted time of 77.47 minutes, is unreliable but reasonable. The estimate, a predicted time of 77.47 minutes, is reliable but unreasonable. The estimate, a predicted time of 77.47 minutes, is both unreliable and unreasonable. The estimate, a predicted time of 77.47 minutes, is both reliable and reasonable. Question A medical experiment on tumor growth gives the following data table. x y 57 38 61 50 63 76 68 97 72 113 The least squares regression line was found. Using technology, it was determined that the total sum of squares (SST ) was 3922.8 and the sum of squares of regression (SSR ) was 3789.0 . Calculate R2 , rounded to three decimal places. ________________________________________ • Something's not right... There is an error in the instruction or question. • This looks broken... A graph/image/equation/video isn't working • I cannot enter my answer. A problem is preventing me from entering an answer to this question. • I have an idea! I have some feedback/suggestions. Question A scientific study on mesothelioma caused by asbestos gives the following data table. Micrograms of asbestos inhaled Area of scar tissue (cm2) 58 162 62 189 63 188 67 215 70 184 R2=0.3643 Therefore, 36.43% of the variation in the observed y -values can be explained by the estimated regression equation. R2=0.3643 Therefore, 0.3643% of the variation in the observed y -values can be explained by the estimated regression equation. R2=0.6357 Therefore, 63.57% of the variation in the observed y -values can be explained by the estimated regression equation. R2=0.6357 Therefore, 0.6357% of the variation in observed y -values can be explained by the estimated regression equation. Question A new mine opened and the number of dump truck loads of material removed was recorded. The table below shows the number of dump truck loads of material removed and the number of days since the mine opened. Days (since opening) # of dump truck loads 2 45 5 53 8 60 9 60 12 67 Question A new mine opened and the number of dump truck loads of material removed was recorded. The table below shows the number of dump truck loads of material removed and the number of days since the mine opened. Days (since opening) # of dump truck loads 6 54 9 78 14 92 17 86 21 121 A least squares regression line was found. Using technology, it was determined that the total sum of squares (SST) was 2349 and the sum of squares of error (SSE) was 329. Use these values to calculate the coefficient of determination. Round your answer to three decimal places. ________________________________________ . 0.860 0.140 2020.000 Question A scientific study on bat populations gives the following data table. x y 15 19 20 16 21 18 26 25 31 21 31% 69% 0.69% 13% Question A fishing enthusiast puts out different numbers of lines at once on several fishing trips to the same location and records the number of fish he catches on each trip. The table below shows the number of lines and number of fish caught on his trips. Fishing lines Fish caught 4 13 5 15 7 25 11 29 12 26 0.7952 0.2049 161.5 0.3825 Question A scientific study on calorie intake gives the following data table. Calorie intake (1000) Weight gained (Ounces) 70 28 72 34 76 23 80 24 84 13 2=0.2498 Therefore, 24.98% of the variation in the observed y -values can be explained by the estimated regression equation. R2=0.7503 Therefore, 75.03% of the variation in the observed y -values can be explained by the estimated regression equation. R2=1.3329 Therefore, 13.329% of the variation in the observed y -values can be explained by the estimated regression equation. R2=0.3329 Therefore, 33.29% of the variation in the observed y -values can be explained by the estimated regression equation. Your answer: R2=0.2498 Therefore, 24.98% of the variation in the observed y -values can be explained by the estimated regression equation. The coefficient of determination is SSRSST and not SSESST Question A scientific study on graphite density gives the following data table. Distance from center of vein Density 17 36 21 25 22 21 27 12 32 6 Using technology, it was determined that the total sum of squares (SST) was 542.07 , the sum of squares regression (SSR) was 521.02 , and the sum of squares due to error (SSE) was 21.044 . Calculate R2 and determine its meaning. Round your answer to four decimal places. ________________________________________ Question Given the SSE, SSR, and SST, find the variance in the dependent variable that can't be explained by the variance in the independent variable. SSE 15 SSR 25 SST 40 Question For a particular regression equation, SSR=325 and SST=550. What is SSE? Question For a particular regression equation, SSE=19 and SST=31. What is SSR? ________________________________________ ________________________________________ 12$$1212 - correct Question Given the SSR and SSE, find SST. SSR 27 SSE 10 ________________________________________ Question A scientific study on construction delays gives the following data table. Construction delay (hours) Increased cost ($1000) 51 104 55 103 58 89 61 56 63 52 Using technology, it was determined that the total sum of squares (SST) was 2542.8 , the sum of squares regression (SSR) was 2194.8 , and the sum of squares due to error (SSE) was 347.99 . Calculate R2 and determine its meaning. Round your answer to four decimal places. ________________________________________ ________________________________________ R2=0.8631 Therefore, 86.31% of the variation in the observed y -values can be explained by the estimated regression equation. R2=1.1586 Therefore, 1.1586% of the variation in the observed y -values can be explained by the estimated regression equation. R2=0.1369 Therefore, 13.69% of the variation in the observed y -values can be explained by the estimated regression equation. R2=0.1586 Therefore, 15.86% of the variation in the observed y -values can be explained by the estimated regression equation. Question Given the SSE, SSR, and SST, find the variance in the dependent variable that can be explained by the variance in the independent variable. SSE 2 SSR 6 SST 8 ________________________________________ Question Given the SSE, SSR, and SST, find the variance in the dependent variable that can be explained by the variance in the independent variable. SSE 12 SSR 24 SST 36 ________________________________________ Question A scientific study on calorie intake gives the following data table. Calorie intake (1000) Hours of exercise need to maintain weight 6 13 7 12 10 17 14 15 17 23 Using technology, it was determined that the total sum of squares (SST) was 76 , the sum of squares regression (SSR) was 54.850 , and the sum of squares due to error (SSE) was 21.150 . Calculate R2 and determine its meaning. Round your answer to four decimal places? ________________________________________ ________________________________________ R2=0.3856 Therefore, 38.56% of the variation in the observed y -values can be explained by the estimated regression equation. R2=0.7217 Therefore, 72.17% of the variation in the observed y -values can be explained by the estimated regression equation. R2=1.3856 Therefore, 13.856% of the variation in the observed y -values can be explained by the estimated regression equation. R2=0.2783 Therefore, 27.83% of the variation in the observed y -values can be explained by the estimated regression equation. Question A scientific study on lift strength gives the following data table. Lift strength (Tons) Time to move load (seconds) 46 159 47 166 51 123 55 128 56 117 Using technology, it was determined that the total sum of squares (SST) was 1989.2 , the sum of squares regression (SSR) was 1598.1 , and the sum of squares due to error (SSE) was 391.10 . Calculate R2 and determine its meaning. Round your answer to four decimal places. ________________________________________ ________________________________________ R2=0.2447 Therefore, 24.47% of the variation in the observed y -values can be explained by the estimated regression equation. R2=0.1966 Therefore, 19.66% of the variation in the observed y -values can be explained by the estimated regression equation. R2=0.8034 Therefore, 80.34% of the variation in the observed y -values can be explained by the estimated regression equation. R2=1.2447 Therefore, 12.447% of the variation in the observed y -values can be explained by the estimated regression equation. [Show More]
Last updated: 1 year ago
Preview 1 out of 25 pages
Reviews( 1 )

by jjmiller08 · 3 years ago
good
Recommended For You
Nutrition> EXAM > Nutrition Through the Life Cycle EXAM 2. 50 Questions & Answers. (Score 100%) (All)
Nutrition Through the Life Cycle EXAM 2. 50 Questions & Answers. (Score 100%)
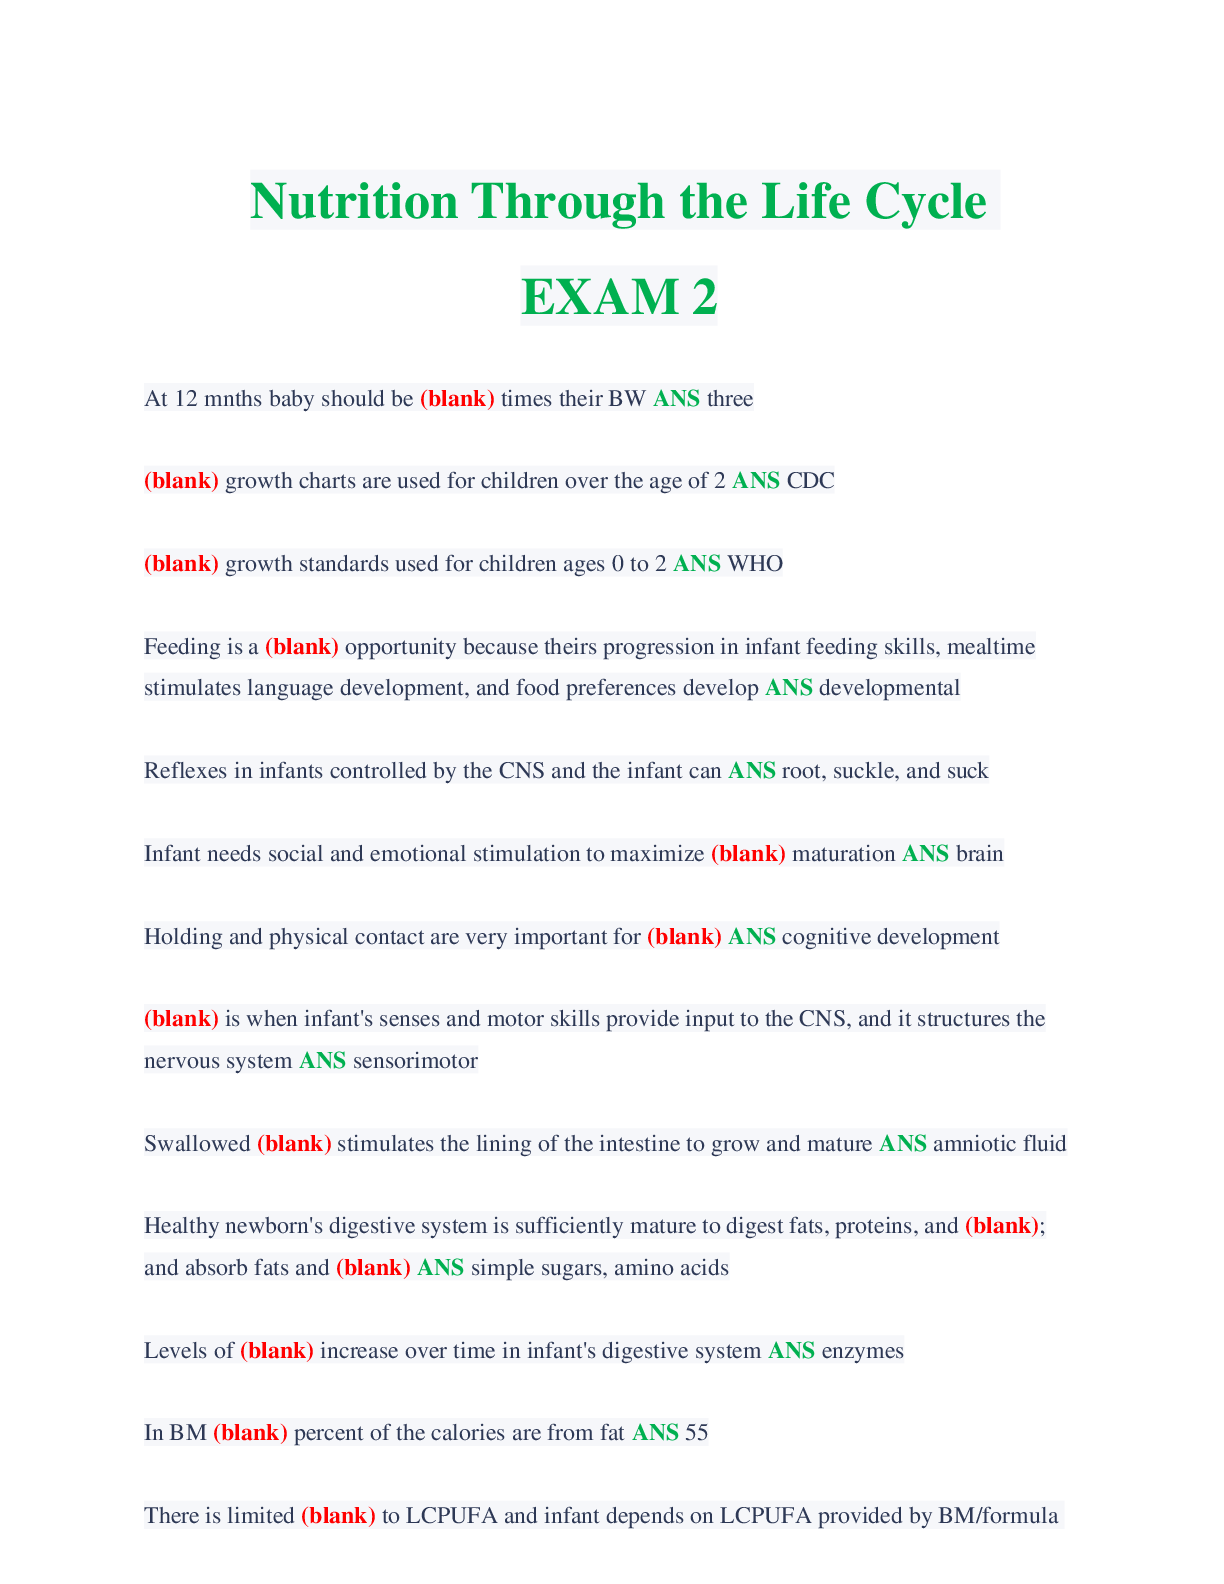
Nutrition Through the Life Cycle EXAM 2 Latest
By Academic mines , Uploaded: Apr 27, 2023
$10
Health Care> EXAM > NR 599 Week 8 Final Exam study Guide/ NR 599 Week 8 Final Exam study Guide (All)
NR 599 Week 8 Final Exam study Guide/ NR 599 Week 8 Final Exam study Guide
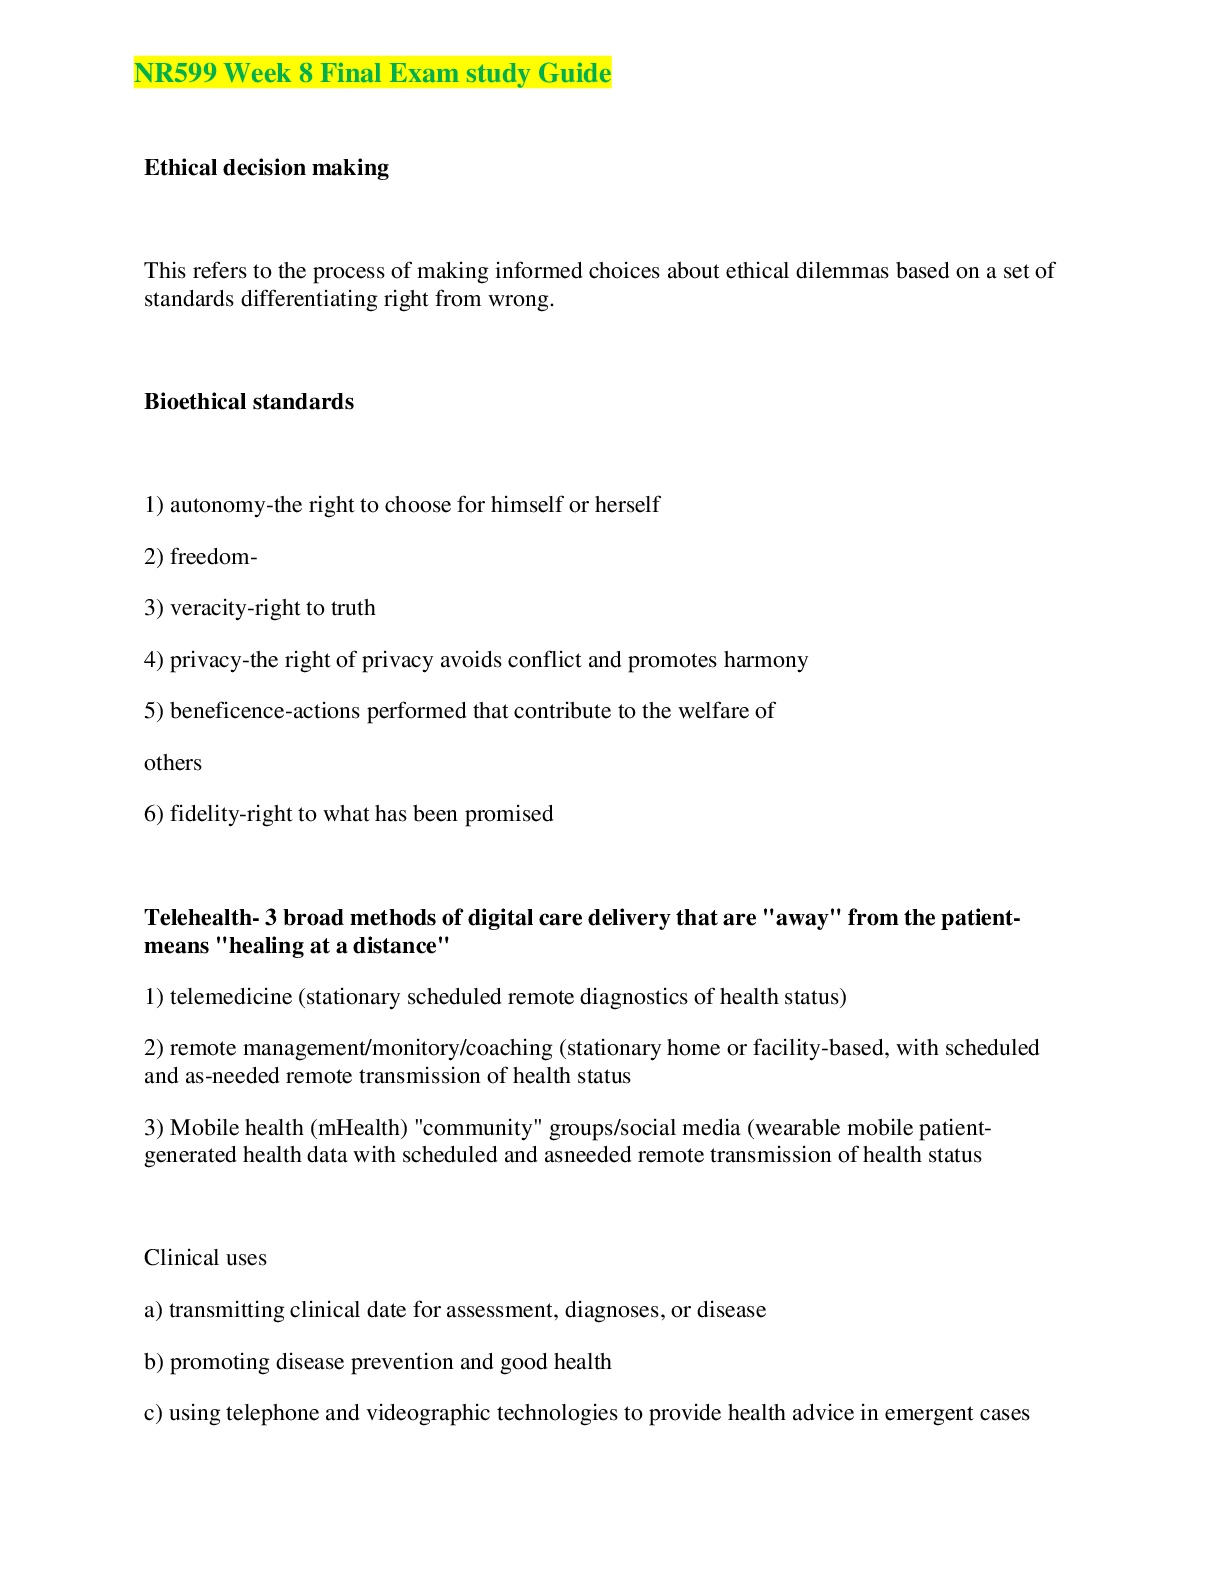
NR599 Week 8 Final Exam study Guide
By QUIZBANK , Uploaded: Feb 21, 2021
$8
*NURSING> EXAM > NR 599 Week 8 Final Exam Chamberlain College of Nursing _Already_Verified Answers. (All)
NR 599 Week 8 Final Exam Chamberlain College of Nursing _Already_Verified Answers.
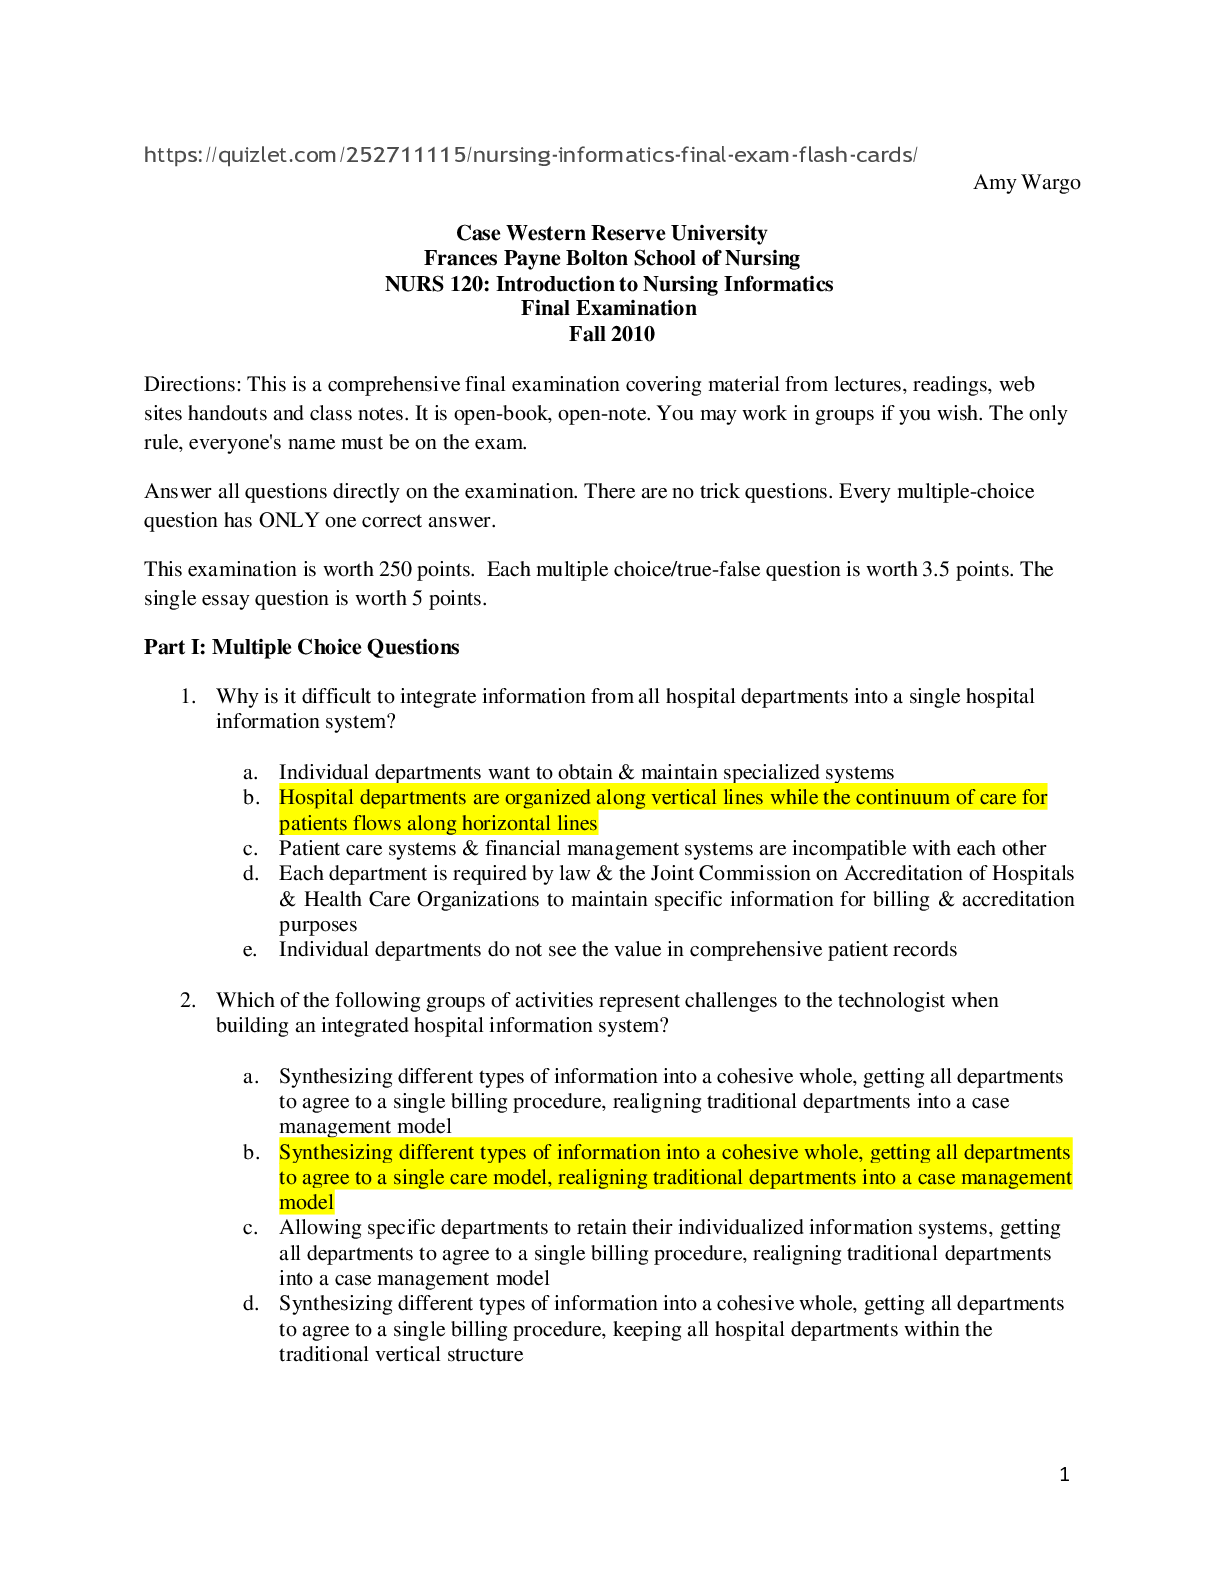
NR 599 Week 8 Final Exam (Summer 2020) Question: Why is it difficult to integrate information from all hospital departments into a single hospital information system? Question: Which of the followin...
By Bright Future , Uploaded: Oct 07, 2020
$10
*NURSING> EXAM > PSYC 300 Week 8 Final Exam 1 |LATEST VERSION (All)
PSYC 300 Week 8 Final Exam 1 |LATEST VERSION
PSYC 300 Week 8 Final Exam 1 PSYC 300 Final Exam Answers Polly Petunia is Chief Horticulturalist for the Southwest region, encompassing Arizona, New Mexico, 4.0/ 4.0 Points and Texas. She wants to s...
By Byde , Uploaded: Jan 29, 2021
$9.5
*NURSING> EXAM > NR 511 Week 8 Final Exam-Practice questions (All)
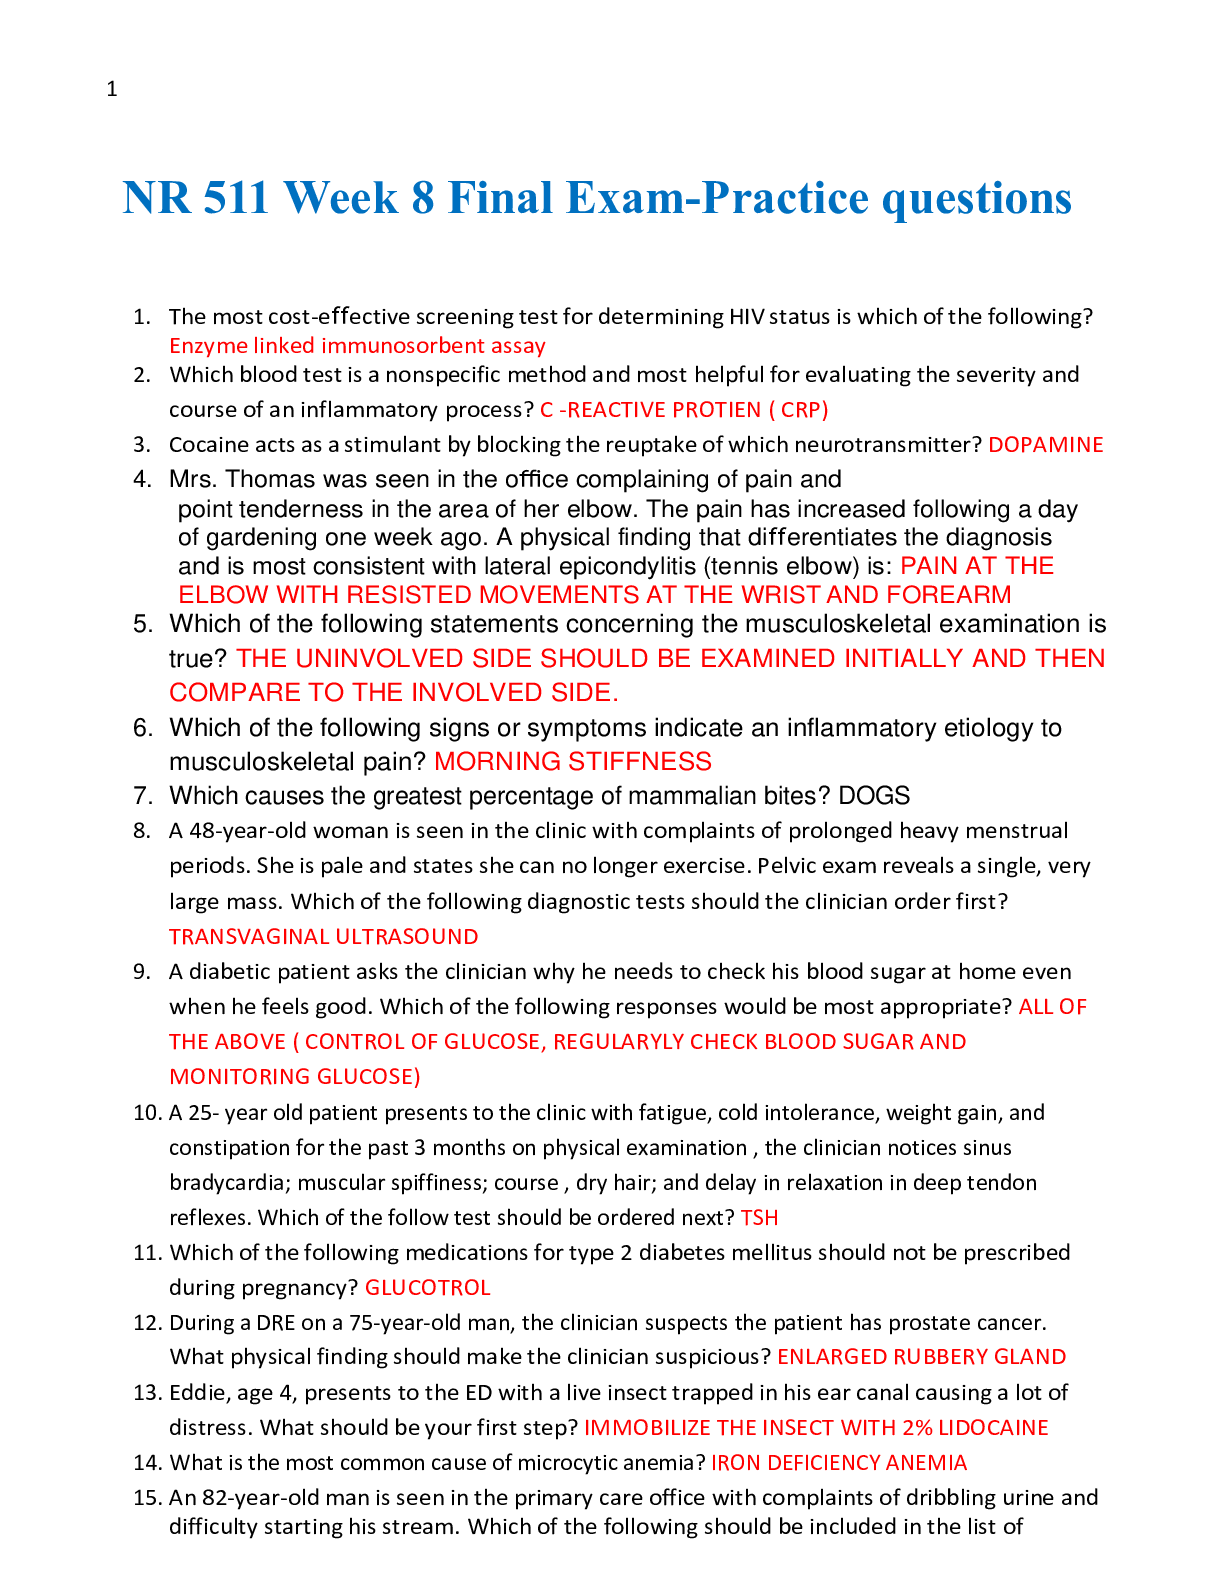
NR 511 Week 8 Final Exam-Practice questions
Question: The most cost-effective screening test for determining HIV status is which of the following? Question: Which blood test is a nonspecific method and most helpful for evaluating the seve...
By Studyrepository , Uploaded: Feb 02, 2022
$16
*NURSING> EXAM > NR 503 Week 8 Final Exam Study Guide; Chapter 2-4, 5-6, 7-8, 9-15, 16-20 (All)
NR 503 Week 8 Final Exam Study Guide; Chapter 2-4, 5-6, 7-8, 9-15, 16-20
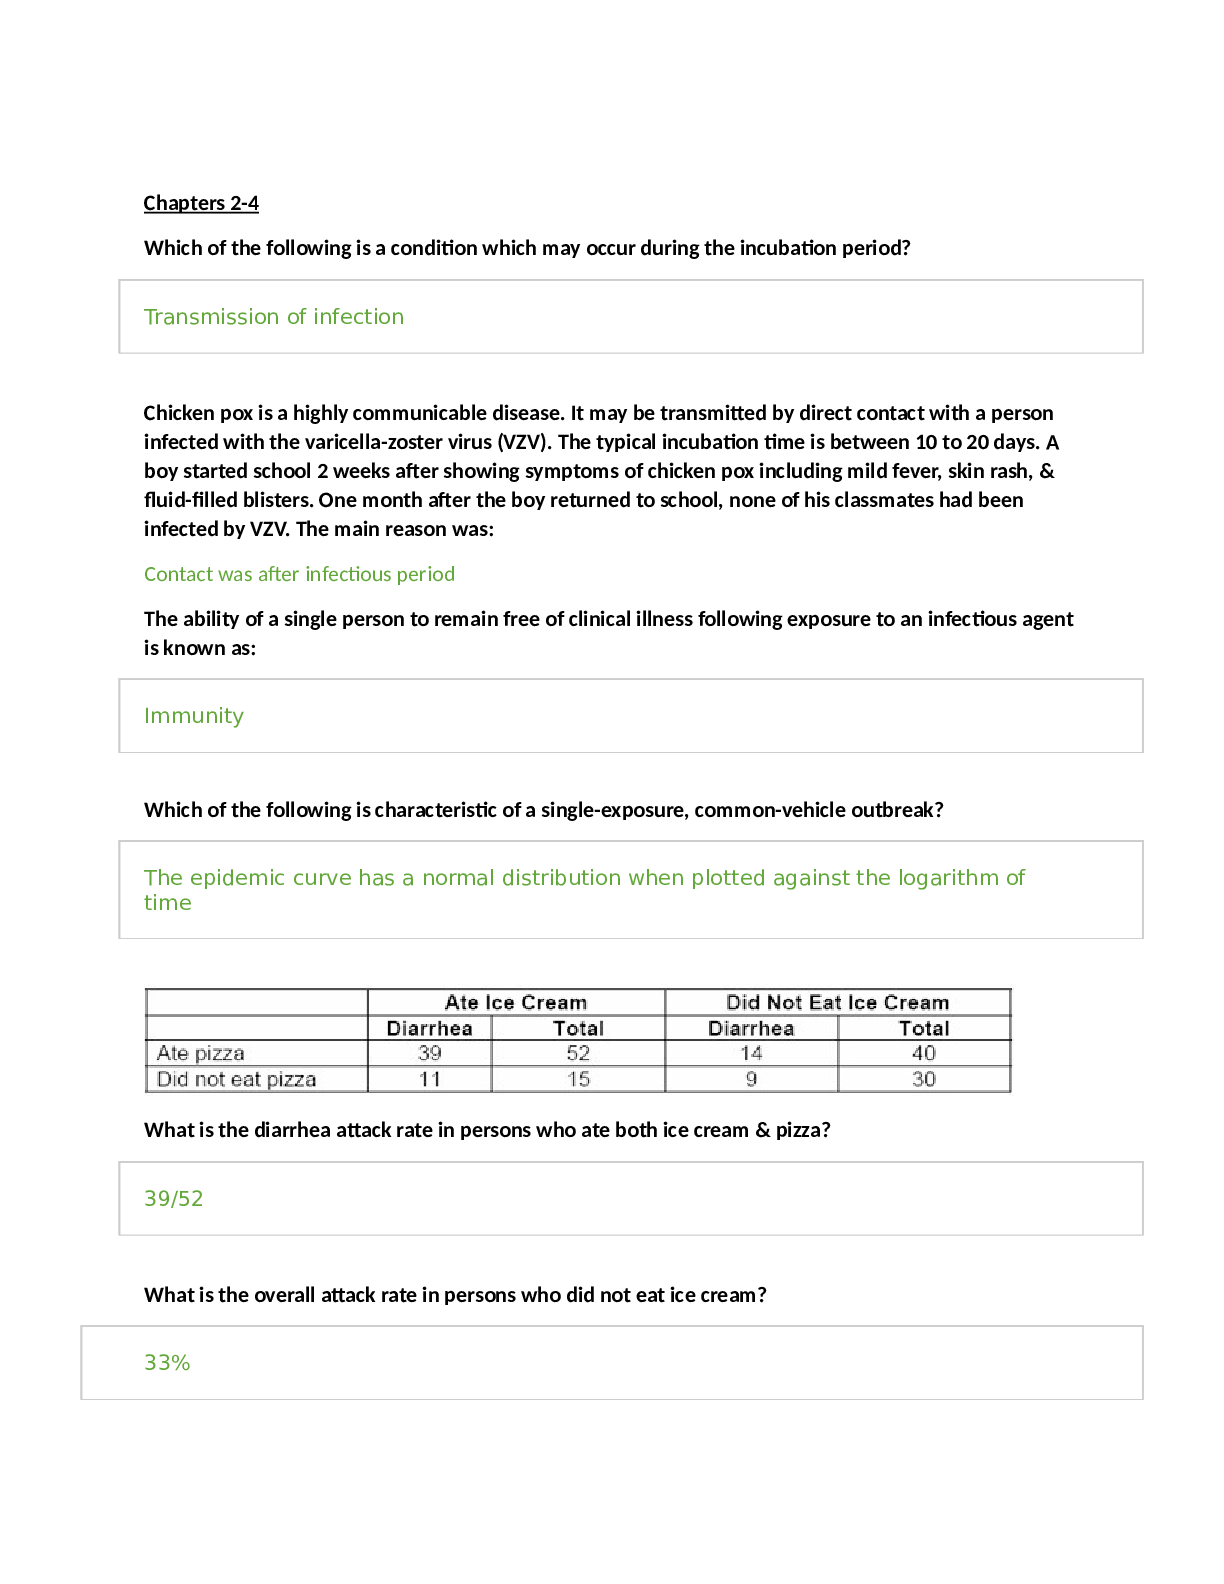
Chapters 2-4 Which of the following is a condition which may occur during the incubation period? Chicken pox is a highly communicable disease. It may be transmitted by direct contact with a person i...
By Studyrepository , Uploaded: Feb 01, 2022
$18
Chemistry> EXAM > CHEM 120 Week 8 Final Exam + Review+ Study Guide (All)
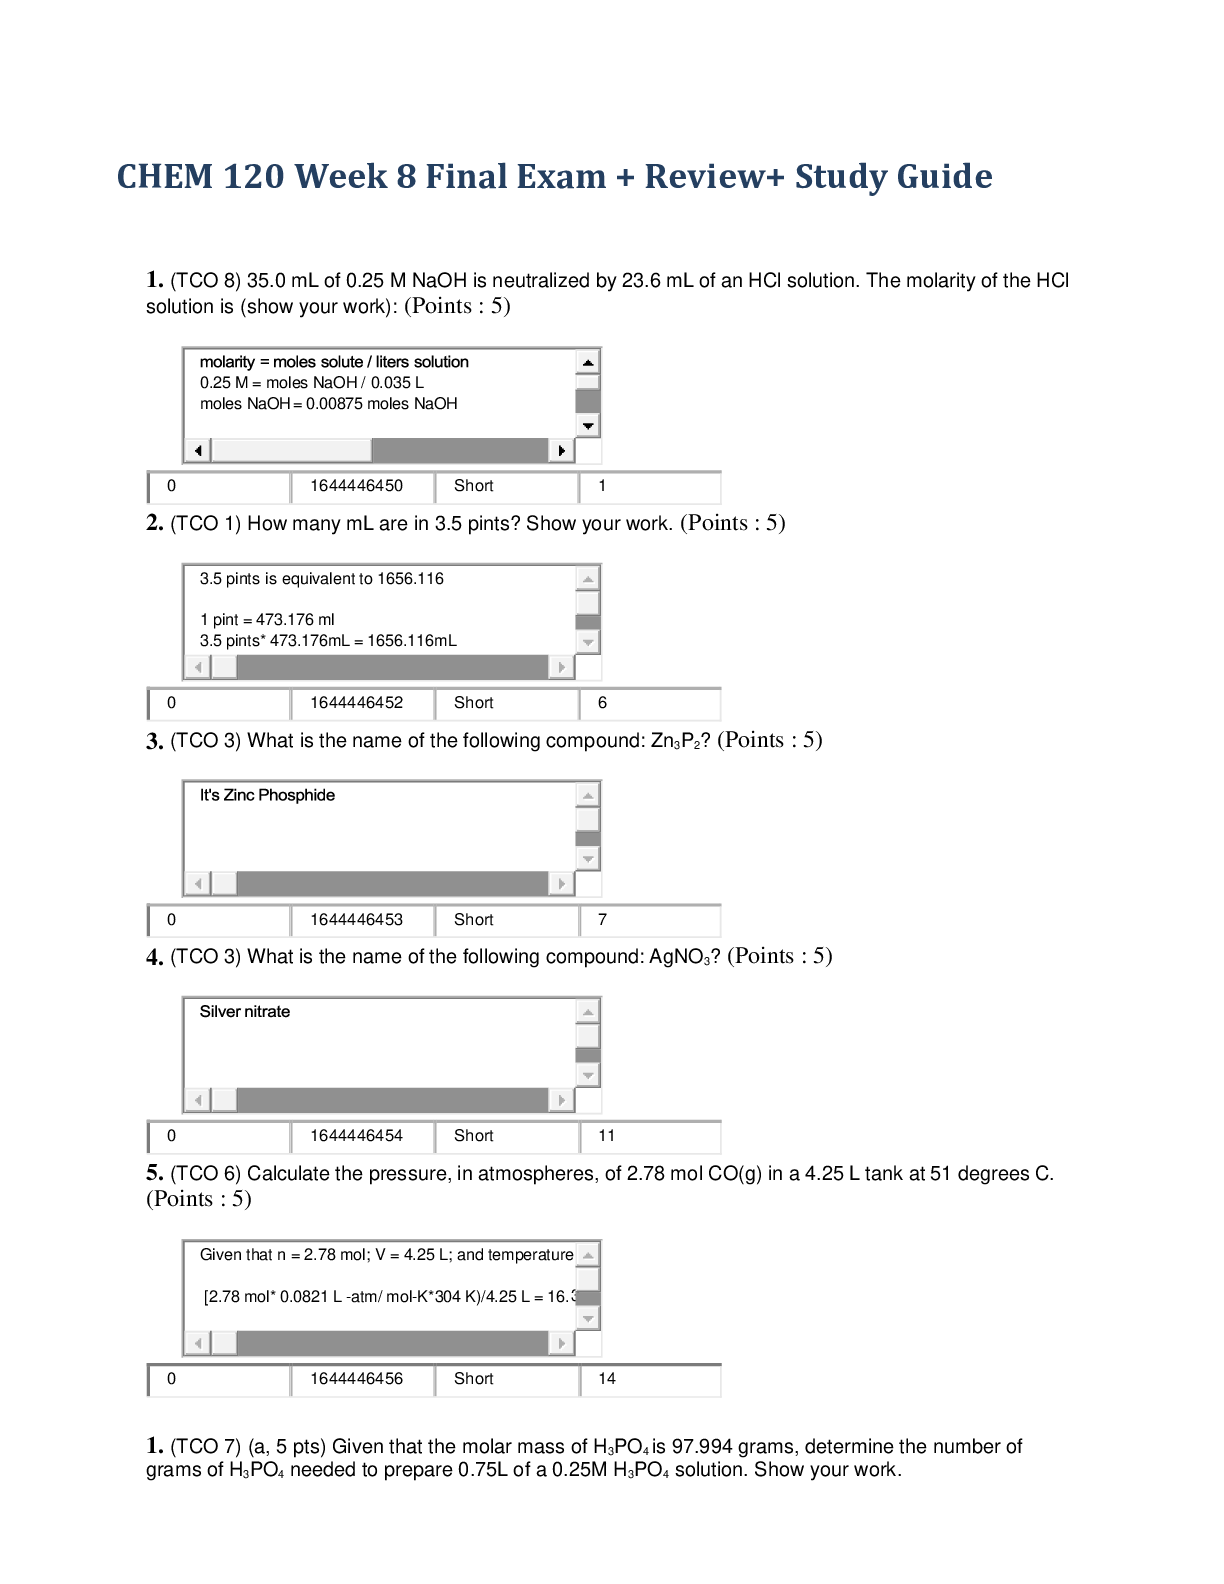
CHEM 120 Week 8 Final Exam + Review+ Study Guide
Page 1 (TCO 12) Transcription is the process by which DNA passes information to (TCO 12) The portion of an enzyme where the substrate “fits ” during the reaction is called the (TCO 12) Which of the...
By Studyrepository , Uploaded: Feb 01, 2022
$15
*NURSING> EXAM > NR 222 Week 8 Final Exam (including a StudyGuide) Chamberlain University (All)
NR 222 Week 8 Final Exam (including a StudyGuide) Chamberlain University
Question: The nurse is to instruct the client about the long- term consequences of non-compliance to prescribed medication. Which education strategy would be most appropriate for the nurse to use in o...
By Studyrepository , Uploaded: Feb 01, 2022
$16
Biology> EXAM > BIOS 242 Week 8 Final Exam Practice Question-Summer Term (All)

BIOS 242 Week 8 Final Exam Practice Question-Summer Term
Question: What is the study of diseases in people? Question: What is the study of the causes of disease? Question: What is the distinguishing fea ture of Eukaryotic Cells? Question: Do Gram + or gram...
By Studyrepository , Uploaded: Feb 01, 2022
$15
Biology> EXAM > BIOS 242 Week 8 Final Exam Practice Questions (All)
BIOS 242 Week 8 Final Exam Practice Questions
Question: Which of the following statements about pork tapeworm is false? Question: Normal microbiota of the digestive system would be found in the Question: The best definition of an antigen is Quest...
By Studyrepository , Uploaded: Feb 01, 2022
$15
Document information
Connected school, study & course
About the document
Uploaded On
Apr 26, 2020
Number of pages
25
Written in

Additional information
This document has been written for:
Uploaded
Apr 26, 2020
Downloads
4
Views
374