Engineering > EXAM > Introduction to Analytics Modeling. Final Quiz - Spring 2020 Final Quiz GT Students. Correct Answer (All)
Introduction to Analytics Modeling. Final Quiz - Spring 2020 Final Quiz GT Students. Correct Answers.
Document Content and Description Below
Introduction to Analytics Modeling Help khoi32 Course Final Quiz - Spring 2020 Final Quiz GT Students GT Students 180 Minute Time Limit Instructions Work alone. Do not collaborate... with or copy from anyone else. You may use any of the following resources: Two sheets (both sides) of handwritten (not photocopied or scanned) notes Blank scratch paper and pen/pencil If any question seems ambiguous, use the most reasonable interpretation (i.e. don't be like Calvin): Good Luck! This the beginning of the Final Quiz. Please make sure that you submit all your answers before the time runs out. Once you submit an answer to a question, you cannot change it. There is no overall Submit button. Information for Question 1 There are eight questions labeled "Question 1." Answer all eight questions. For each of the following eight questions, select the type of problem that the model is best suited for. For each question there may be more than one correct answer; you need only choose one. Each type of problem might be used zero, one, or more than one time in the eight questions. Question 1 0.5/0.5 points (graded) Select the type of problem that linear regression is best suited for. There may be more than one correct answer; you need only choose one. You have used 1 of 1 attempt Question 1 0.5/0.5 points (graded) Select the type of problem that k-means is best suited for. There may be more than one correct answer; you need only choose one. ClassiÕcation Clustering Experimental design Prediction from feature data Prediction from time-series data Variable selection ClassiÕcation Clustering Experimental design Prediction from feature data Prediction from time-series data Answers are displayed within the problem You have used 1 of 1 attempt Question 1 0.5/0.5 points (graded) Select the type of problem that k-nearest-neighbor is best suited for. There may be more than one correct answer; you need only choose one. You have used 1 of 1 attempt Question 1 0.5/0.5 points (graded) Select the type of problem that lasso regression is best suited for. There may be more than one correct answer; you need only choose one. You have used 1 of 1 attempt Question 1 0.5/0.5 points (graded) Select the type of problem that ARIMA is best suited for. There may be more than one correct answer; you need only choose one. You have used 1 of 1 attempt Question 1 0.5/0.5 points (graded) Variable selection ClassiÕcation Clustering Experimental design Prediction from feature data Prediction from time-series data Variable selection ClassiÕcation Clustering Experimental design Prediction from feature data Prediction from time-series data Variable selection ClassiÕcation Clustering Experimental design Prediction from feature data Prediction from time-series data Variable selection Answers are displayed within the problem Select the type of problem that factorial design is best suited for. There may be more than one correct answer; you need only choose one. You have used 1 of 1 attempt Question 1 0.5/0.5 points (graded) Select the type of problem that stepwise regression is best suited for. There may be more than one correct answer; you need only choose one. You have used 1 of 1 attempt Question 1 0.5/0.5 points (graded) Select the type of problem that exponential smoothing is best suited for. There may be more than one correct answer; you need only choose one. You have used 1 of 1 attempt Information for Question 2 There are eight questions labeled "Question 2." Answer all eight questions. For each of the following eight questions, select the type of analysis that the model is best suited for. For each question there may be more than one correct answer; you need only choose one. Each type of analysis might be used zero, one, or more than one time in the eight questions. Question 2 0.625/0.625 points (graded) Select the type of analysis that a random support vector machine forest is best suited for. There may be more than one correct answer; you need only choose one. ClassiÕcation Clustering Experimental design Prediction from feature data Prediction from time-series data Variable selection ClassiÕcation Clustering Experimental design Prediction from feature data Prediction from time-series data Variable selection ClassiÕcation Clustering Experimental design Prediction from feature data Prediction from time-series data Variable selection Answers are displayed within the problem You have used 1 of 1 attempt Question 2 0.625/0.625 points (graded) Select the type of analysis that ARIMA is best suited for. There may be more than one correct answer; you need only choose one. You have used 1 of 1 attempt Question 2 0.625/0.625 points (graded) Select the type of analysis that exponential smoothing is best suited for. There may be more than one correct answer; you need only choose one. You have used 1 of 1 attempt Question 2 0.0/0.625 points (graded) Select the type of analysis that k-nearest-neighbor classiÕcation is best suited for. There may be more than one correct answer; you need only choose one. You have used 1 of 1 attempt Question 2 0.625/0.625 points (graded) Select the type of analysis that a support vector machine is best suited for. There may be more than one correct answer; you need only choose one. Using feature data to predict the probability of something happening two time periods in the future Using feature data to predict the whether or not something will happen two time periods in the future Using time-series data to predict the amount of something two time periods in the future Using time-series data to predict the variance of something two time periods in the future Using feature data to predict the amount of something two time periods in the future Using feature data to predict the probability of something happening two time periods in the future Using feature data to predict the whether or not something will happen two time periods in the future Using time-series data to predict the amount of something two time periods in the future Using time-series data to predict the variance of something two time periods in the future Using feature data to predict the amount of something two time periods in the future Using feature data to predict the probability of something happening two time periods in the future Using feature data to predict the whether or not something will happen two time periods in the future Using time-series data to predict the amount of something two time periods in the future Using time-series data to predict the variance of something two time periods in the future Using feature data to predict the amount of something two time periods in the future Using feature data to predict the probability of something happening two time periods in the future Using feature data to predict the whether or not something will happen two time periods in the future Using time-series data to predict the amount of something two time periods in the future Using time-series data to predict the variance of something two time periods in the future Answers are displayed within the problem You have used 1 of 1 attempt Question 2 0.0/0.625 points (graded) Select the type of analysis that a k-nearest-neighbor classiÕcation tree is best suited for. There may be more than one correct answer; you need only choose one. You have used 1 of 1 attempt Question 2 0.625/0.625 points (graded) Select the type of analysis that a linear regression tree is best suited for. There may be more than one correct answer; you need only choose one. You have used 1 of 1 attempt Question 2 0.625/0.625 points (graded) Select the type of analysis that GARCH is best suited for. There may be more than one correct answer; you need only choose one. You have used 1 of 1 attempt Question 3 Using feature data to predict the amount of something two time periods in the future Using feature data to predict the probability of something happening two time periods in the future Using feature data to predict the whether or not something will happen two time periods in the future Using time-series data to predict the amount of something two time periods in the future Using time-series data to predict the variance of something two time periods in the future Using feature data to predict the amount of something two time periods in the future Using feature data to predict the probability of something happening two time periods in the future Using feature data to predict the whether or not something will happen two time periods in the future Using time-series data to predict the amount of something two time periods in the future Using time-series data to predict the variance of something two time periods in the future Using feature data to predict the amount of something two time periods in the future Using feature data to predict the probability of something happening two time periods in the future Using feature data to predict the whether or not something will happen two time periods in the future Using time-series data to predict the amount of something two time periods in the future Using time-series data to predict the variance of something two time periods in the future Using feature data to predict the amount of something two time periods in the future Using feature data to predict the probability of something happening two time periods in the future Using feature data to predict the whether or not something will happen two time periods in the future Using time-series data to predict the amount of something two time periods in the future Using time-series data to predict the variance of something two time periods in the future Answers are displayed within the problem 4.0/4.0 points (graded) Select all of the following that are examples of time-series data. You have used 1 of 1 attempt Question 4 3.0/4.0 points (graded) Select all of the following reasons that data should not be scaled until point outliers are removed. You have used 1 of 1 attempt Question 5 4.0/4.0 points (graded) Select all of the following situations in which using a variable selection approach like lasso or stepwise regression would be important. You have used 1 of 1 attempt Information for Question 6 There are four questions labeled "Question 6." Answer all four questions. For each of the following four questions, select the type of model that the software package is best suited for analyzing. Each type of model might be used zero, one, or more than one time in the four questions. Question 6 1.0/1.0 point (graded) Which type of model is ARENA best suited for? Discrete-event simulation You have used 1 of 1 attempt Question 6 1.0/1.0 point (graded) Which type of model is R best suited for? Linear regression You have used 1 of 1 attempt Question 6 1.0/1.0 point (graded) Which type of model is SimPy best suited for? Estimated value of a house each week for the last 5 years. Features of a house (square feet, number of bathrooms, etc.) that might aàect its value. Number of clicks on a house web site each day the house is on the market. Number of days each house was on the market before being sold. Valid data would appear to be outliers if data is scaled Õrst. Point outliers would appear to be valid data if not removed before scaling. If data is scaled Õrst, the range of data after outliers are removed will be wider than intended. If data is scaled Õrst, the range of data after outliers are removed will be narrower than intended. It is too costly to create a model with a large number of variables. There are fewer data points than variables. There are too few data points to avoid overÕtting if all variables are included. Time-series data is being used. Discrete-event simulation You have used 1 of 1 attempt Question 6 1.0/1.0 point (graded) Which type of model is PuLP best suited for? Linear programming (optimization) You have used 1 of 1 attempt Question 8 2.0100000000000002/3.0 points (graded) The following process was followed to predict sales of a product each month for the next three years: 1. Split past sales data randomly into three sets: training, validation, and test. 2. Build 20 diàerent models using the training data. 3. Evaluate all 20 models on the validation data. 4. Select the model that performed best on the validation data. 5. Evaluate the selected model on the test data. 6. Use the selected model to predict monthly sales for the next three years based on real-time data, and observe its true performance. Select all of the following that are true. Question 7 6/7 points (graded) Keyboard Help For each of the analytics tasks listed below, drag to it the R function(s) that do it. If there is a function that does not do any of the tasks below, then don't drag it anywhere; all other functions should be used. FEEDBACK Correctly placed 11 items. Misplaced 1 item. Did not place 1 required item. Good work! You have completed this drag and drop problem. Final attempt was used, highest score is 6.0 Every model's expected performance on training data will be the same as its expected performance on the validation data, because both the training data and the validation data are taken from the same population. The selected model's expected performance on test data will be worse than its expected performance on the validation data, because there is a selection bias: the selected model is more likely to have inÖated performance due to randomness. Answers are displayed within the problem You have used 1 of 1 attempt Question 9 4.0/4.0 points (graded) A positive correlation has been observed between hours of sleep and self-reported happiness (people who sleep more are happier, and happier people sleep more). Based on that observed correlation, select all of the following statements about the direction of causality between sleep and happiness that are true. You have used 1 of 1 attempt Question 10 4.0/4.0 points (graded) Select all of the following situations where imputing missing data is probably better than including a "data missing" binary variable. You have used 1 of 1 attempt Information for Question 11 There are four questions labeled "Question 11." Answer all four questions. For each of the following four questions, select the model that is more directly appropriate. Assume you have a relevant set of predictor data to use. Each type of model might be used zero, one, or more than one time in the four questions. Question 11 1.0/1.0 point (graded) Which model is more directly appropriate to estimate the likelihood that the lower-ranked team will win a soccer (football) match? Logistic regression You have used 1 of 1 attempt Question 11 1.0/1.0 point (graded) Which model is more directly appropriate to estimate the probability that a speciÕc online auction will have a winning bid above $86? Logistic regression You have used 1 of 1 attempt Question 11 1.0/1.0 point (graded) Which model is more directly appropriate to predict the price of a house a year from now? Linear regression You have used 1 of 1 attempt It is unclear how the selected model's expected performance on test data compares to its observed performance on real-time data, because the training data and test data were taken from the same population, but the real-time data might be diàerent. Lack of sleep makes people unhappy: The less people sleep, the less happy they feel. Unhappiness causes lack of sleep: When people feel unhappy, they have trouble sleeping. Both less sleep and more unhappiness are positively correlated with another factor, which causes both. Can't tell without more analysis. 2% of the data points have missing values, and you cannot build a good predictive model for the missing data. 2% of the data points have missing values, and you can build a good predictive model for the missing data. 50% of the data points have missing values for this variable, and you cannot build a good predictive model for the missing data. 50% of the data points have missing values for this variable, and you believe that points with missing data have a diàerent distribution of values from points where data is present. Answers are displayed within the problem Question 11 1.0/1.0 point (graded) Which model is more directly appropriate to forecast the number of hot dogs that will be sold at a baseball game? Linear regression You have used 1 of 1 attempt Question 12 3.0/3.0 points (graded) Select all of the following situations where a supervised learning model (like classiÕcation) is more directly appropriate than an unsupervised learning model (like clustering). You have used 1 of 1 attempt Question 13 2.68/4.0 points (graded) An insurance company has data on past customers' attributes and how much each of their car insurance policies paid out. Now, the company wants to analyze the possibility of selling car insurance policies to new customers. Select all of the following questions where a classiÕcation model is more directly appropriate than a linear regression model. You have used 1 of 1 attempt Information for Question 14 There are four questions labeled "Question 14." Answer all four questions. For each of the following four questions, select the model that is more directly appropriate. Assume you have a relevant set of predictor data to use. Each type of model might be used zero, one, or more than one time in the four questions. Question 14 1.0/1.0 point (graded) Given observed distributions of arrival times at an airport security area, and observed distributions of times to go through each step (boarding pass check, loading items onto x-ray belt, walking through detector, x-ray of items, retreiving items from belt, etc.), Õnd the best number of boarding-pass checkers, x-ray belts, and detectors to have working at the security area. Which model is more directly appropriate? Simulation You have used 1 of 1 attempt Question 14 1.0/1.0 point (graded) Given the number of passengers who need to board an airplane, distributions of the amount of time passengers take to put bags into bins and sit down, and the location of seats and aisles on the plane, Õnd the minimum amount of time the airline should allow for boarding so that the Öight is 90% likely to be ready to leave on time. Which model is more directly appropriate? Simulation You have used 1 of 1 attempt For each data point, the response is not known and there is no expert estimate. For each data point, the response is not known but an expert has provided an estimate of the response. For each data point, the response is known. The insurance company wants to determine whether or not a speciÕc customer would switch to this company's coverage. The insurance company wants to estimate the amount that a speciÕc customer would be willing to pay for coverage. The insurance company wants to estimate the number of car accidents a speciÕc customer will get into in the next Õve years. Question 14 1.0/1.0 point (graded) Given the distributions of manufacturing time at each of 100 steps of a manufacturing process, and the probability of requiring rework at each of the steps, estimate the distribution of the time it will take to produce 10,000 unites of a product. Which model is more directly appropriate? Simulation You have used 1 of 1 attempt Question 14 1.0/1.0 point (graded) Given the weights and volumes of thousands of proposed scientiÕc experiments that could be sent into space on the next private rocket launch, the amount of money each lab has oàered to pay for its experiment to be included, and the capacity of the rocket, Õnd the set of experiments that will maximize the income of the company launching the rocket. Which model is more directly appropriate? Optimization You have used 1 of 1 attempt Questions 15a-f 14.399999999999999/18.0 points (graded) A baseball team's pricing department would like to determine the price to sell each ticket to each game. This description is simpliÕed from its real complexity; if you're an expert in the ticket pricing industry, please do not rely on your expertise to Õll in all the extra complexity (you'll end up making the quetsions below more diÞcult than I intended). Currently, there is a single price for each section's tickets -- for example, tickets to sit in Section 110 cost the same amount ($75) at every one of the team's 81 home games. The VP of Pricing believes this leads to two kinds of bad outcomes. For some games (for example, a weekday afternoon game against a bad opponent), the seat never gets sold because nobody wants to pay that much, and for other games (for example, a Saturday night game against a very good opponent) all the seats in the section are sold for $75 but could've been sold for more. The VP of Pricing has decided to try a new approach: use analytics to determine the price for a ticket in each section at each game, based on the game's characteristics (day, time, opponent, etc.) and the ticket price. At Õrst, there is very little data, because each section's tickets have been sold at a single price for all 81 games. a. Select all of the models/approaches the pricing department could use to estimate demand for a section's tickets at a speciÕc price until enough data is collected. After data has been collected over Õve years (more than 400 games with a wide range of prices), the VP of Pricing would like to have a tool built to help with pricing decisions. b. Select all of the models/approaches the pricing department could use to estimate the number of tickets in a section that can be sold at a speciÕc price, based on characteristics of the game (day, time, opponent, etc.). Over the past Õve years, the team has won more games each year than the previous year. The VP of Pricing believes that this has increased the demand for tickets. c. Select all of the models/approaches the pricing department could use to determine whether demand really has changed over time. A/B testing, with two diàerent prices being set for similar games Bayesian analysis, with an initial baseline distribution for each section/price provided by the VP of Pricing and updated as each game's ticket sales provide a new data point Linear regression based on past sales data, even though the prices being set are outside the range of the prices in the data Markov chain, with each state being the price of a ticket Support vector machine based on past sales data, even though the prices being set are outside the range of the prices in the data ARIMA Discrete-event simulation k-nearest-neighbor regression Linear regression Logistic regression CUSUM on the number of tickets sold in similar games at similar prices over the last Õve years CUSUM on the total number of tickets sold each year over the last Õve years Answers are displayed within the problem A small number of the team's games will be on national television. For those games, the executives want to sell more tickets, so the national audience will see a stadium full of fans. The pricing department also needs to ensure that the prices satisfy certain restrictions -- for example, that better seats are priced higher than worse seats. d. Select all of the following models/approaches that the pricing department could use to Õnd prices that will maximize ticket revenue while yielding at least a 75% chance that all tickets will be sold. In each of the Õve years after the pricing change was implemented, the total ticket revenue (total price of all tickets sold) was higher than it was in each of the ten years before the change. e. Select all of the models/approaches the pricing department could possibly use to determine whether the increase is due to the change in pricing policy. If the increase in total ticket revenue described in part e. is indeed due to the change in pricing policy, the VP of Pricing would like to estimate how much additional revenue was created by the change (vs. how much might have been created by the team winning more games). f. Select all of the models/approaches the pricing department could use to estimate the amount of additional ticket revenue that is due to the policy change. You have used 1 of 1 attempt Information for Questions 16a,b Figure 2. Confusion matrix (Sensitivity 96.7%, SpeciÕcity 84.5%) Exponential smoothing, to see whether there is an increasing trend in tickets sold in similar games at similiar prices over the last Õve years Linear regression, including two new variables: fraction of games won last year, and fraction of games won so far this year Louvain algorithm, to create clusters of games with similar characteristics k-means Markov chain Queuing Stochastic optimization Support vector machine CUSUM, using each year's total ticket revenue Game-theoretic analysis, between the two teams playing in each game Linear regression, including a binary "after the policy change" variable Non-parametric test, using yearly total ticket revenue data Queuing, using yearly total ticket revenue data CUSUM GARCH k-means Linear regression Support vector machine A support vector machine model has been created to predict whether a person is right-handed or left-handed, based on the person's genetic proÕle. The Õgure above shows a confusion matrix of the model's performance on a test data set that it was not trained on. More Information for Question 16a There are four questions labeled "Question 16a." Answer all four questions. For each of the following four questions, select the calculation that is most appropriate to support or refute the statement. Each calculation might be used zero, one, or more than one time in the four questions. Question 16a 1.0/1.0 point (graded) Which calculation is most appropriate to support or refute the statement "If the model predicts someone to be right-handed, then the person is very likely to be right-handed"? 5412/(5412+32) = 99.4% You have used 1 of 1 attempt Question 16a 1.0/1.0 point (graded) Which calculation is most appropriate to support or refute the statement "If the model predicts someone to be left-handed, then the person is very likely to be left-handed"? 948/(948+991) = 48.9% You have used 1 of 1 attempt Question 16a 1.0/1.0 point (graded) Which calculation is most appropriate to support or refute the statement "If someone is left-handed, then the model is very likely to predict the person to be left-handed"? 948/(948+32) = 96.7% You have used 1 of 1 attempt Question 16a 1.0/1.0 point (graded) Which calculation is most appropriate to support or refute the statement "If someone is right-handed, then the model is very likely to predict the person to be right-handed"? 5412/(5412+991) = 84.5% You have used 1 of 1 attempt Question 16b 2.0/2.0 points (graded) Select all of the following ways that it is reasonable to use this model. You have used 1 of 1 attempt Questions 17abcde 10.008/12.0 points (graded) Every morning at 9:30am, the manager of a fast-food restaurant determines how many hamburgers to pre-make so they are ready to be immediately given to customers at lunchtime. If not enough are pre-made, customers will have to wait a long time in line, and might go to the competing fast-food restaurant next door instead. If too many are pre-made, some will spoil before they can be used. a. The manager has come up with the following incorrect idea: GIVEN the past fraction of days that hamburgers were ordered at lunch, the past overall distributions of (a) arrival rates of customers, (b) the time it takes to give a customer a pre-made hamburger, (c) the time it takes to make and give the customer a newly-made hamburger, (d) customers leaving because of lines, and (e) hamburger spoilage, USE a simulation model TO Õnd the best tradeoà between the expected number of customers served each day and the cost of spoiled hamburgers. Select all of the statements below that show a reason why the manager's idea is wrong. Use the model's classiÕcation when it predicts right-handedness, but remain undecided when it predicts left-handedness Use the model's classiÕcation when it predicts left-handedness, but remain undecided when it predicts right-handedness Answers are displayed within the problem b. The manager has come up with another incorrect idea: GIVEN past data on the probability TO Õnd the steady-state probabilities that hamburgers will be ordered at lunch today if were ordered yesterday, USE a Markov chain model that there are hamburgers ordered at lunch in a day. Then, GIVEN those probabilities and the relative costs of losing customers or having hamburgers spoil, USE an optimization model TO determine the most cost-eàective number of hamburgers to order each day. Select all of the statements below that show a reason why the manager's idea is wrong. c. Select all of the possible paths below that could reasonably lead to a good solution. d. Select a set of models from the list below, to create a solution that the manager can put together to determine how many hamburgers to premake each day. e. Select all of the following complexities that are not accounted for in any of the models in part d. You have used 1 of 1 attempt Questions 18a-d The simulation model doesn't account for random variation. The simulation model doesn't account for seasonality. ??? ? ? ?? ? The Markov chain model can't link one day to the next. The Markov chain model doesn't account for seasonality. The Markov chain model doesn't account for attributes of days (holidays, etc.). The number of hamburgers sold day to day isn't memoryless. Predict the lunchtime demand for each day. Estimate the wait time for each customer. Then Õnd the best tradeoà between decreased wait time and the time it takes to pre-make some food. Predict the lunchtime demand for each day. Estimate the probability of customers leaving because the line is too long, based on demand and service rates. Then Õnd the best tradeoà between opportunity cost of lost customers and cost of spoiled food. Predict the lunchtime demand for each day. Find the best tradeoà between the cost of lost customers and the cost of spoiled food, as a function of the probability customers will leave for diàerent line lengths. Then, based on an expert estimate of the probability customers will leave for diàerent line lengths, determine the best number of hamburgers to pre-make. GIVEN daily data on sales, weather, holidays, day of week, and number of people who left because the line was too long, USE a clustering model TO estimate demand. GIVEN daily data on sales, weather, holidays, day of week, and number of people who left because the line was too long, USE a random forest model TO estimate demand. GIVEN past data on customers who leave based on time of day and line length, USE logistic regression TO estimate the probability of a customer leaving because the line is too long. GIVEN past data on customers who leave based on time of day and line length, USE an optimization model TO estimate the probability of a customer leaving because the line is too long. GIVEN an estimate of demand, the probability of a customer leaving because the line is too long, past arrival and service rates, cost of spoiled food, and estimated cost of lost customers, USE a support vector machine model TO Õnd the number of hamburgers to pre-make that minimizes overall costs. GIVEN the estimated demand, estimated probability of leaving because the line is too long, cost of spoiled food, and estimated cost of lost customers, USE optimization TO Õnd the number of hamburgers to pre-make that minimizes overall costs. The number of hamburgers sold on holidays might be diàerent from the number sold on regular days. Pre-made hamburgers do not taste as good as freshly-made ones, so selling more pre-made hamburgers one day might decrease demand on future days. When the company runs a national hamburger sale, demand will be higher. Answers are displayed within the problem In the United States in 2015, the overall population of 19-24-year-olds (about 27 million people) was approximately 49% women and 51% men. In the US college population of 19-24-year-olds (about 12 million people), 57% of college students were women and 43% were men. a. To test whether this discrepancy is signiÕcant, an analyst wants to use a binomial distribution. What would be an appropriate test? b. Select all of the approaches below that might help determine whether there has been a signÕciant change in the fraction of college students who are men and who are women over the past 50 years. One suggested explanation for the discrepancy is that there is a diàerence between girls' and boys' high school grades, partly due to boys' higher frequency of misbehavior. c. What nonparametric test could be used to check whether girls' and boys' median high school grades are signiÕcantly diàerent? A logistic regression model shows that high school GPA is a signiÕcant predictor of whether a person will go to college. d. Select all of the statements below that could be a causal relationship between high school GPA and college attendance. Base your answer only on the information above and the timing involved. [For the purpose of this question, do not think about whether the statements are true; assume they are true (even if you don't believe them) and determine whether, if true, the statement shows a causal relationship.] Data for this question was taken from http://nces.ed.gov/fastfacts/display.asp?id=372, This discrepancy is getting more and more attention in education (and in education analytics); if you have any thoughts about it, please let me know! You have used 1 of 1 attempt Question 19 0 points possible (ungraded) Do you think that you or any of your fellow students in this course would be good TAs for the course in the future? If so, please enter name(s) or username(s) below. Find the probability of 49% or more "yes" answers from a binomial distribution with n=27,000,000 and p=0.57. Find the probability of 57% or more "yes" answers from a binomial distribution with n=27,000,000 and p=0.57. Find the probability of 49% or more "yes" answers from a binomial distribution with n=12,000,000 and p=0.49. Find the probability of 57% or more "yes" answers from a binomial distribution with n=12,000,000 and p=0.49. ClassiÕcation with each year as a data point, using fraction of college students who are women as the response and the year as the predictor CUSUM on the fraction of college students who are men, with each year as a data point Exponential smoothing on the fraction of college students who are women, with each year as a data point Logistic regression with each year as a data point, using fraction of college students who are men as the response and the year as the predictor Paired-sample signed rank test McNemar's test Two-sample unpaired rank test (Mann-Whitney) One-sample signed rank test Many colleges are less likely to admit students with a lower high school GPA. Most community colleges will admit any high school graduate. The same factors that cause boys to have lower high school GPAs might also make them less likely to want to attend college. High school students who get higher GPAs do so because they are more serious about school, and therefore are more likely to want to attend college. Colleges believe that a higher high school GPA is a sign that a student is taking school seriously, and colleges prefer to admit serious students. Question 20 -- no answer required 0 points possible (ungraded) Thanks for a great semester -- I really enjoyed teaching you all, and I hope you got a lot out of it too! You have used 1 of 1 attempt This the end of the Final Quiz. Please make sure that you submit all your answers before the time runs out. There is no overall Submit button. [Show More]
Last updated: 1 year ago
Preview 1 out of 15 pages

Reviews( 0 )
Recommended For You
*NURSING> EXAM > ENPC Test Questions & Answers (All)

ENPC Test Questions & Answers
ENPC Test Questions & Answers-An unresponsive 2-year-old child was found by his mother with a bottle labeled "Elavil 50 mg" by his side. Which piece of information is important to obtain from his moth...
By PROF , Uploaded: Apr 25, 2024
$9.5
Religious Studies> EXAM > CWV TOPIC 2 QUIZ. QUESTIONS AND ANSWERS LATEST UPDATED. (Score 100%) (All)
CWV TOPIC 2 QUIZ. QUESTIONS AND ANSWERS LATEST UPDATED. (Score 100%)
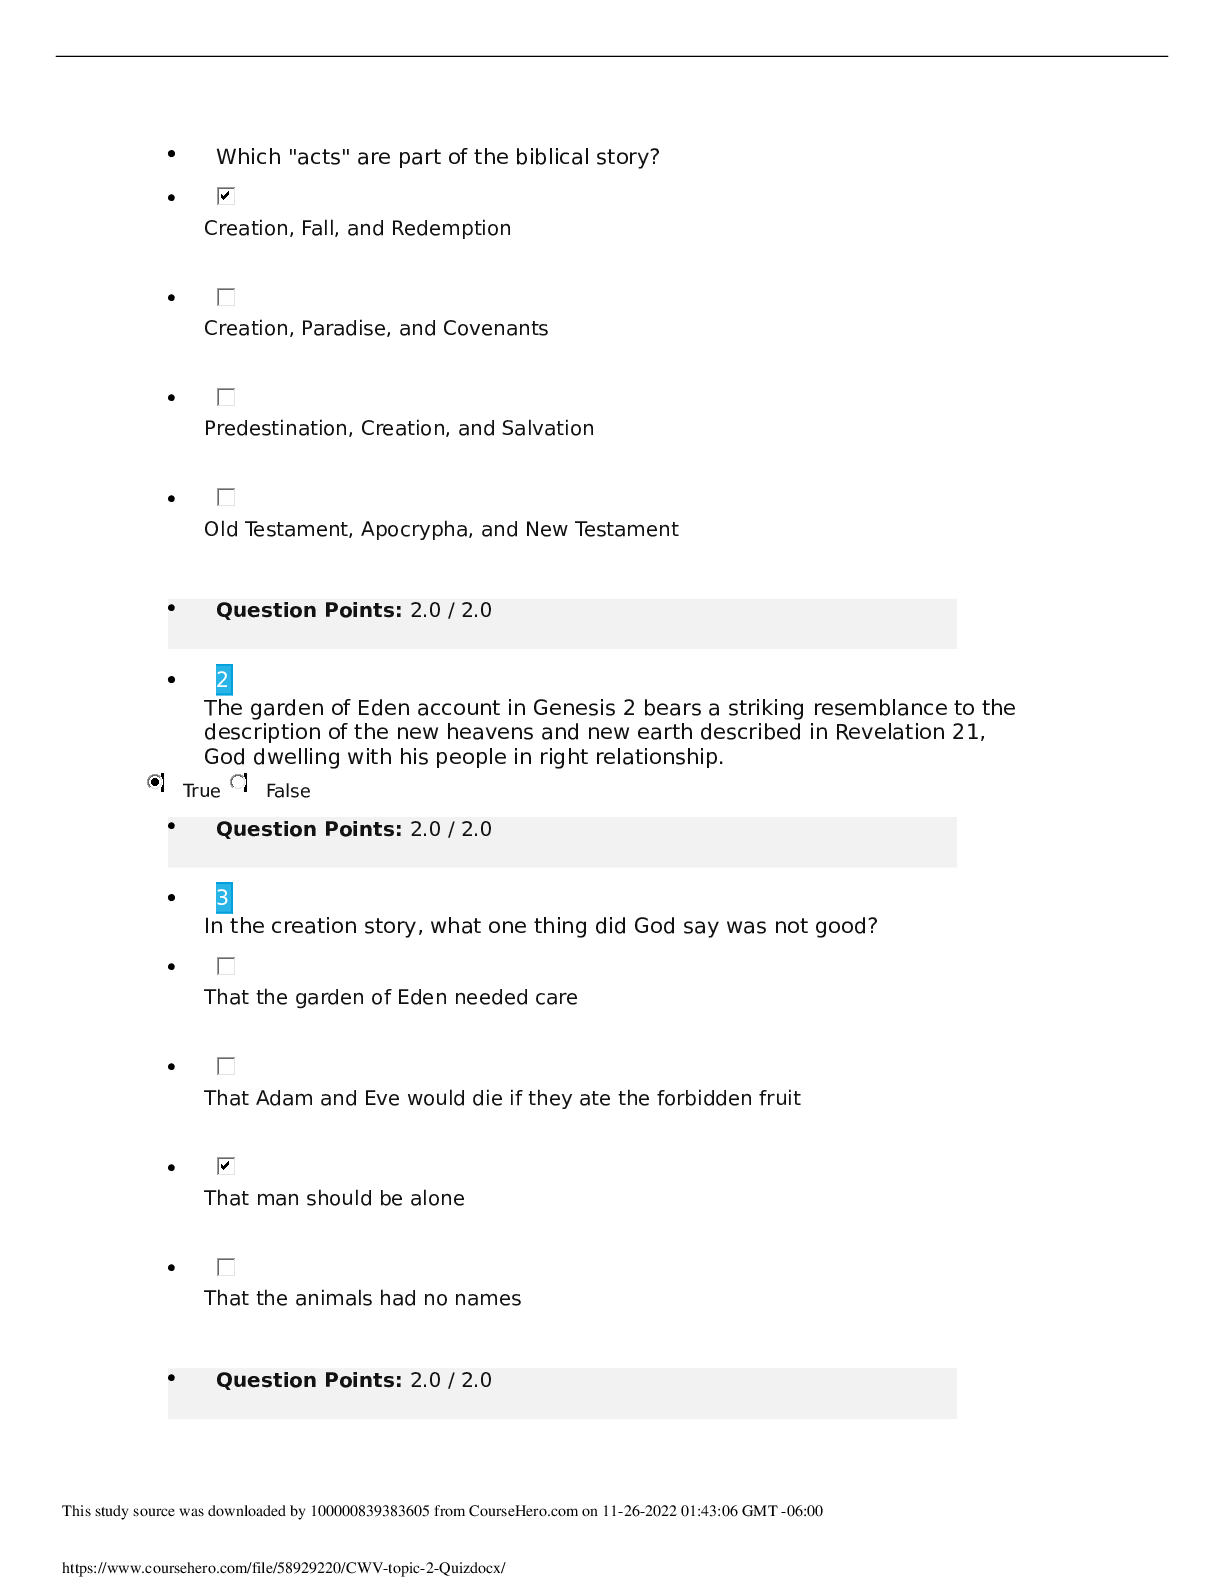
CWV TOPIC 2 QUIZ QUESTIONS AND ANSWERS LATEST UPDATED
By ELIANA , Uploaded: Aug 01, 2022
$9
ATI MED SURG PROCTORED> EXAM > Med Surg ATI Proctored Exam Test Bank 2023/2024 With NGN (All)
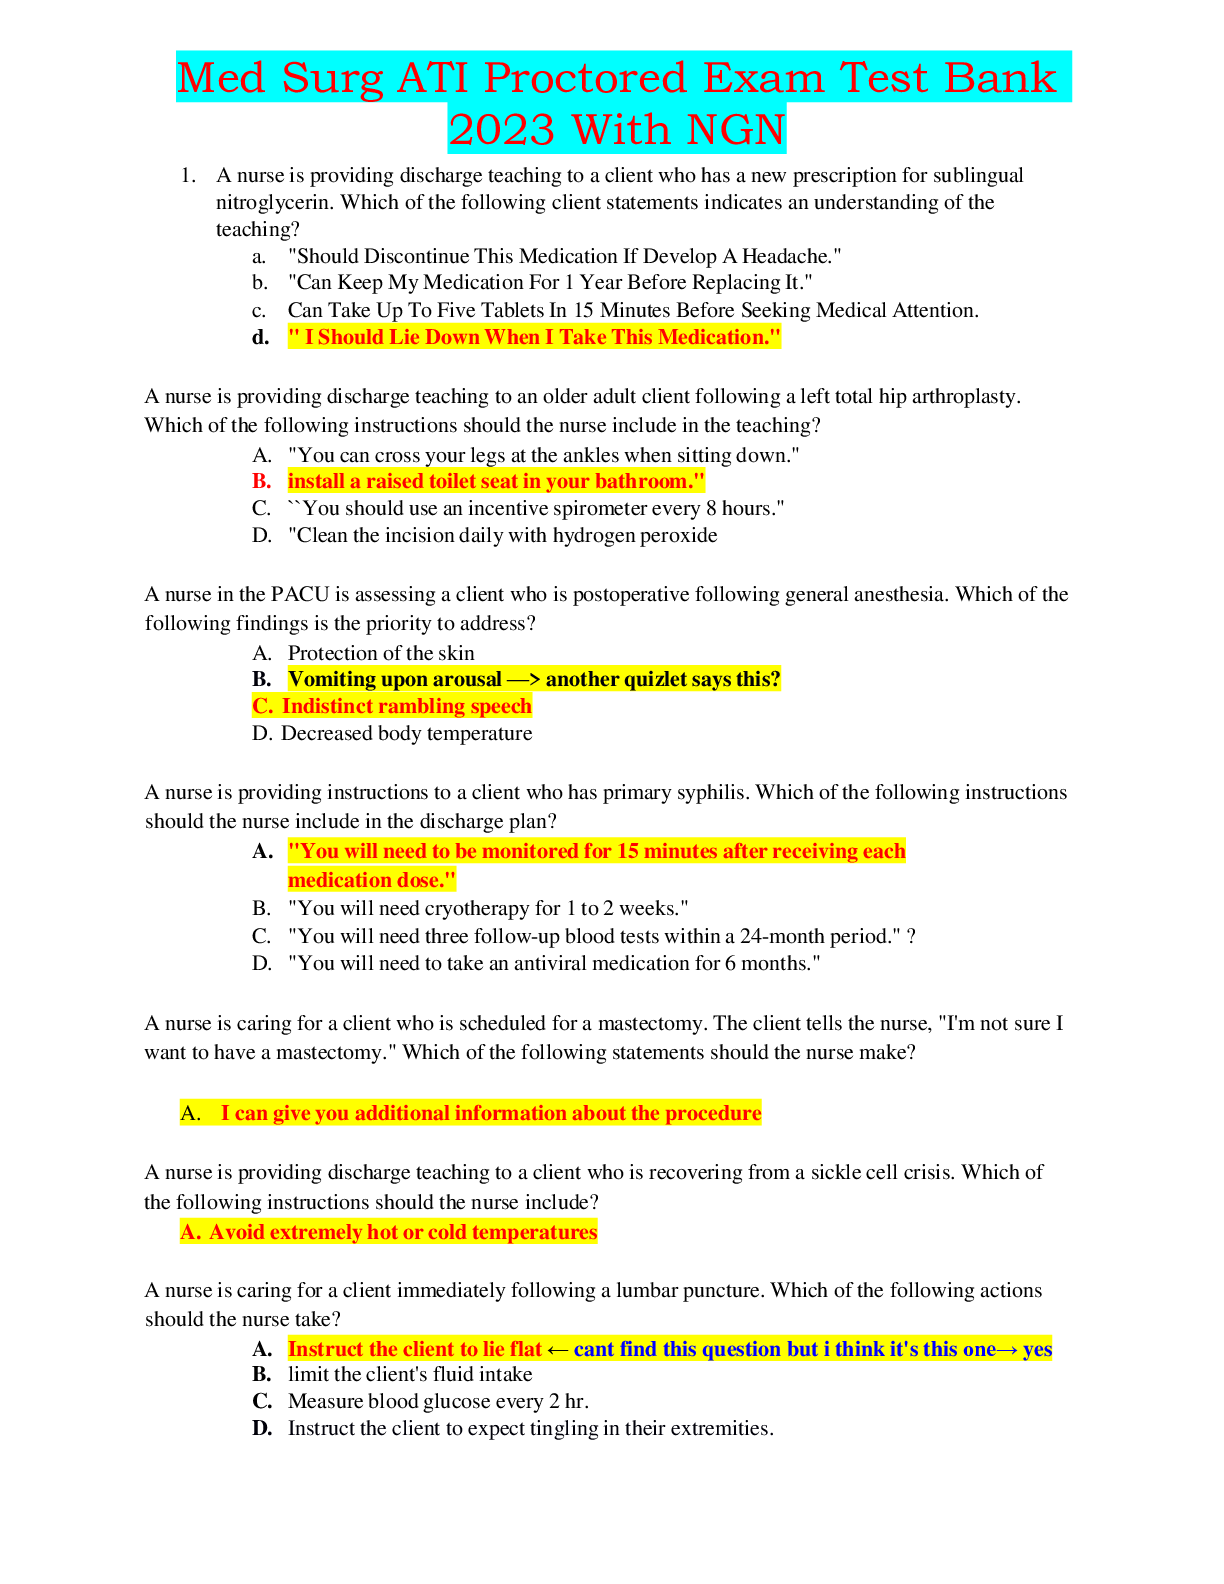
Med Surg ATI Proctored Exam Test Bank 2023/2024 With NGN
Med Surg ATI Proctored Exam Test Bank 2023/2024 With NGN Med Surg ATI Proctored Exam Test Bank 2023/2024 With NGN Med Surg ATI Proctored Exam Test Bank 2023/2024 With NGN Med Surg ATI Proctored E...
By EXAMHUB SOLUTIONS , Uploaded: Apr 15, 2024
$30.5
NURSING.> EXAM > ATI RN CUSTOM; MENTAL HEALTH NEXT GEN (All)
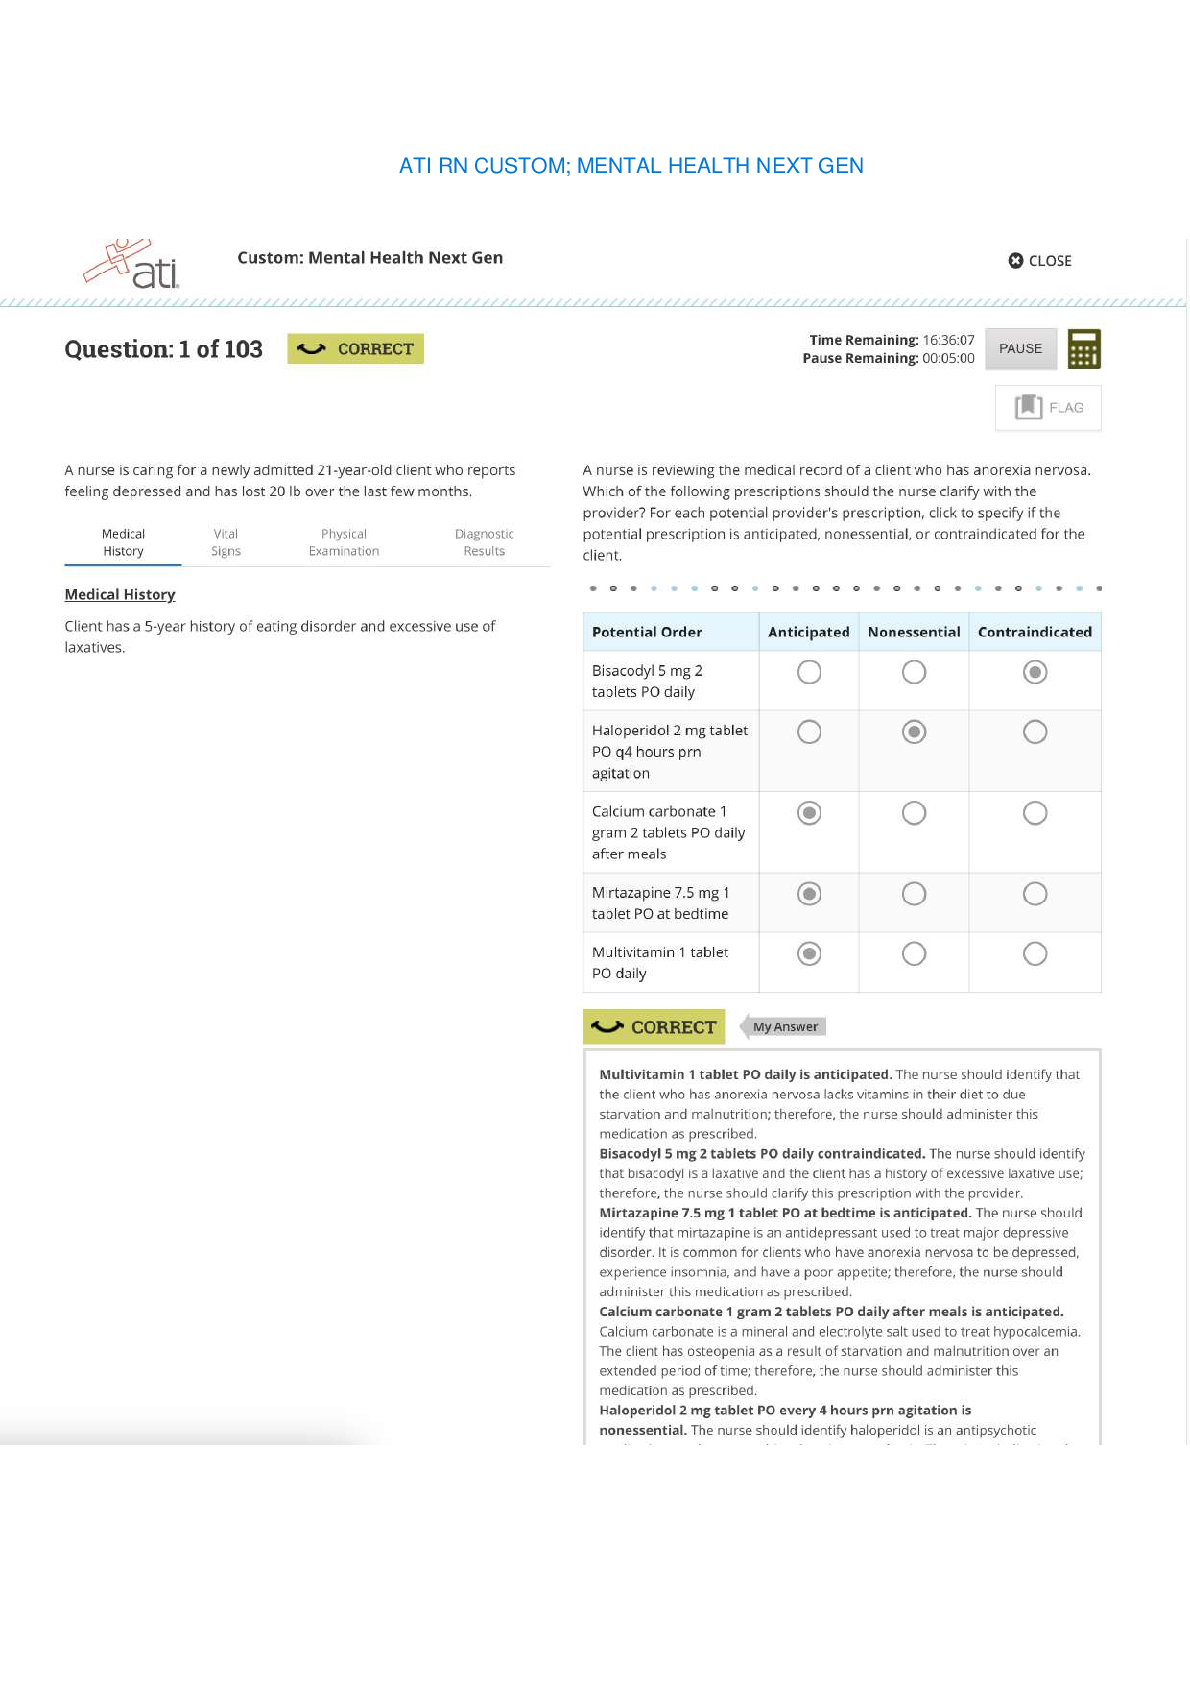
ATI RN CUSTOM; MENTAL HEALTH NEXT GEN
ATI RN CUSTOM; MENTAL HEALTH NEXT GEN ATI RN CUSTOM; MENTAL HEALTH NEXT GEN ATI RN CUSTOM; MENTAL HEALTH NEXT GEN ATI RN CUSTOM; MENTAL HEALTH NEXT GEN ATI RN CUSTOM; MENTAL HEALTH NEXT GE...
By EXAMHUB SOLUTIONS , Uploaded: Apr 05, 2024
$45.5
ATI Med Surg> EXAM > RN ATI MED SURG ALTERATIONS IN KIDNEY FUNCTION AND ELIMINATION ASSESSMENT. (All)

RN ATI MED SURG ALTERATIONS IN KIDNEY FUNCTION AND ELIMINATION ASSESSMENT.
RN ATI MED SURG ALTERATIONS IN KIDNEY FUNCTION AND ELIMINATION ASSESSMENT. RN ATI MED SURG ALTERATIONS IN KIDNEY FUNCTION AND ELIMINATION ASSESSMENT. RN ATI MED SURG ALTERATIONS IN KIDNEY FUNCTI...
By EXAMHUB SOLUTIONS , Uploaded: Apr 10, 2024
$28.5
Nutrition> EXAM > Nutrition Through the Life Cycle EXAM 2. 50 Questions & Answers. (Score 100%) (All)

Nutrition Through the Life Cycle EXAM 2. 50 Questions & Answers. (Score 100%)
Nutrition Through the Life Cycle EXAM 2 Latest
By Academic mines , Uploaded: Apr 27, 2023
$10
*NURSING> EXAM > NGR 6172 Pharm Midterm Exam- Questions and Answers. Score 98% (All)
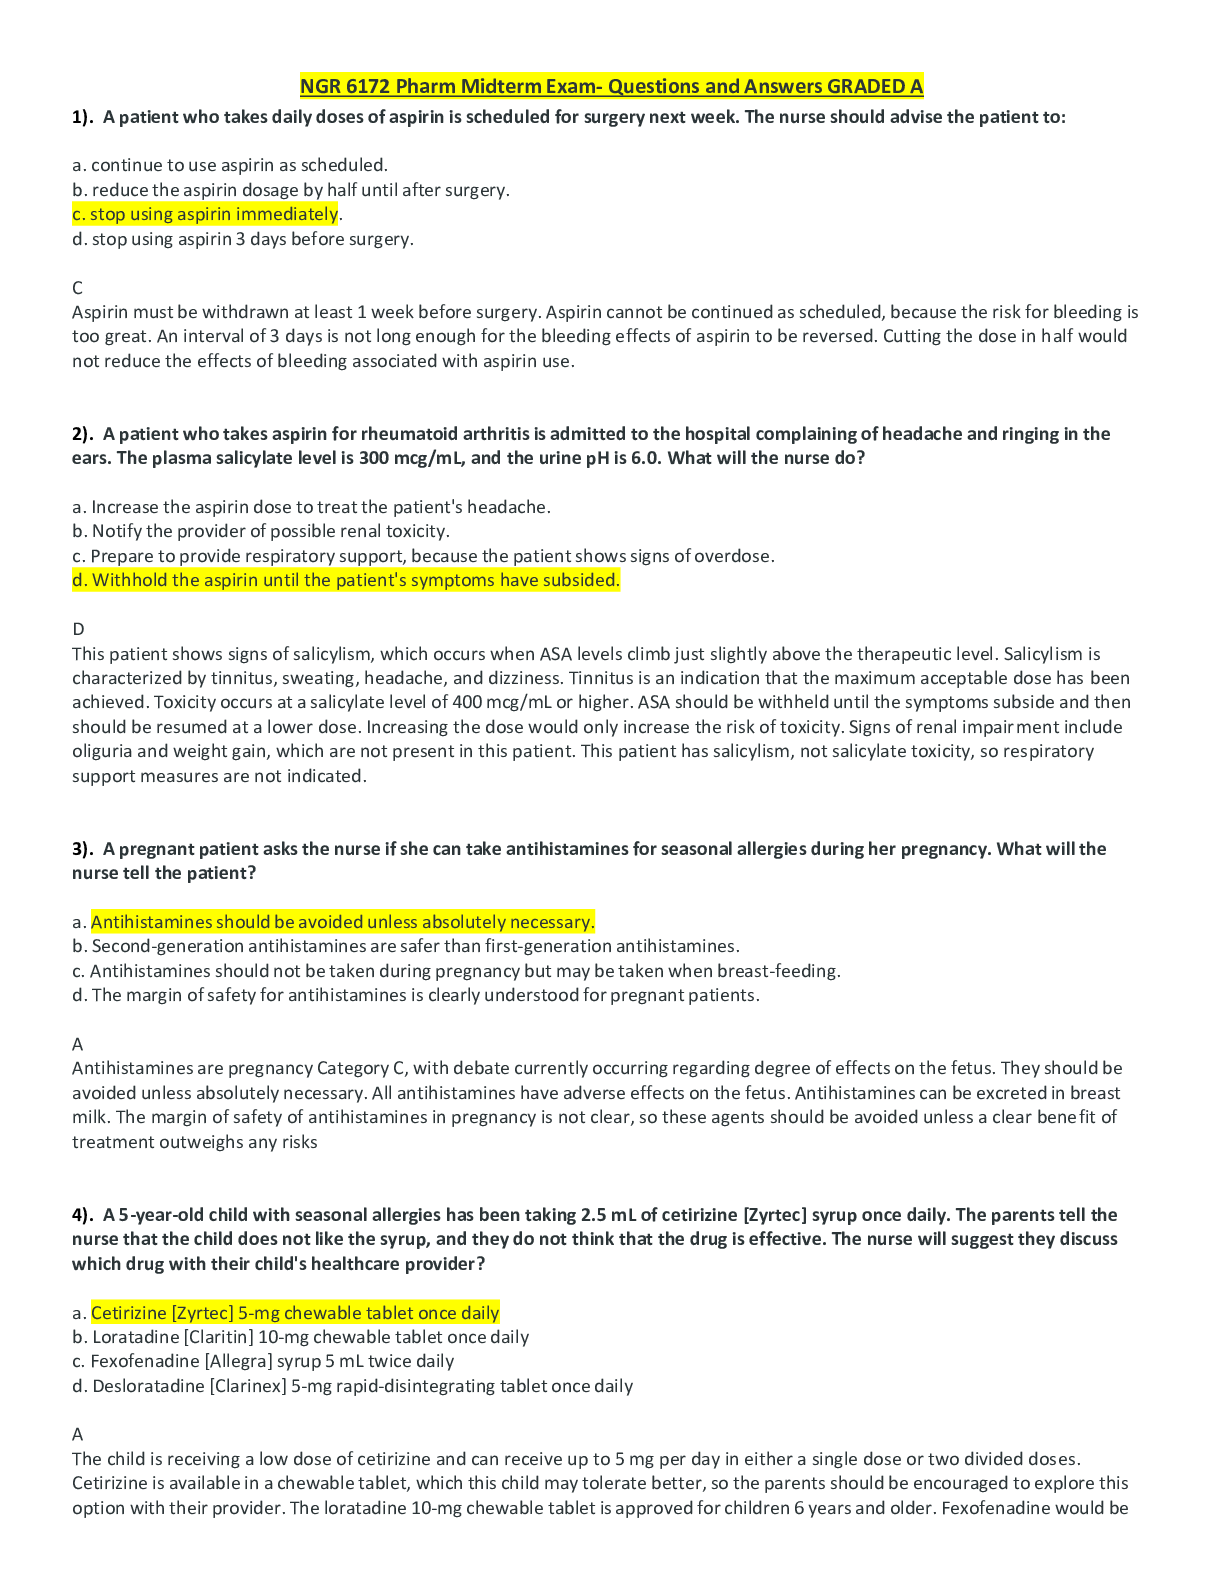
NGR 6172 Pharm Midterm Exam- Questions and Answers. Score 98%
NGR 6172 Pharm Midterm Exam- Questions and Answers GRADED A-1). A patient who takes daily doses of aspirin is scheduled for surgery next week. The nurse should advise the patient to: a. continue to...
By PROF , Uploaded: Feb 01, 2022
$11
Philosophy> EXAM > PHL 200 Intro to Ethics Unit 3 - Score 100% (All)

PHL 200 Intro to Ethics Unit 3 - Score 100%
PHL 200 Intro to Ethics Unit 3 For a utilitarian, which consideration is most important? Why is utilitarianism an objectivist or relativist theory? Which of the following considerations is important f...
By Ajay25 , Uploaded: Jan 04, 2022
$8
Philosophy> EXAM > PHL 200 Intro to Ethics Unit 2 -Score 100% (All)
PHL 200 Intro to Ethics Unit 2 -Score 100%
PHL 200 Intro to Ethics Unit 2 Which of the following statements about divine command theory is true? Norman learns from his pastor that God commands people to love one another. Thus according to divi...
By Ajay25 , Uploaded: Jan 04, 2022
$8
Philosophy> EXAM > PHL 200 Intro to Ethics Unit Final. Score 100% (All)

PHL 200 Intro to Ethics Unit Final. Score 100%
PHL 200 Intro to Ethics Unit Final Which of the following statements supports egoism? "Abortion is acceptable if the woman doesn't want to be a mother." To which theory of ethics is the person who mad...
By Ajay25 , Uploaded: Jan 04, 2022
$8
Document information
Connected school, study & course
About the document
Uploaded On
Mar 03, 2021
Number of pages
15
Written in

Additional information
This document has been written for:
Uploaded
Mar 03, 2021
Downloads
0
Views
208