Economics > STUDY GUIDE > ECO 578 - ALL QUIZZES TEST BANK : 100% A+ work, Latest guide: Texas A&M University. (All)
ECO 578 - ALL QUIZZES TEST BANK : 100% A+ work, Latest guide: Texas A&M University.
Document Content and Description Below
ECO 578 - ALL QUIZZES TEST BANK 1. Question : Ten experts rated a newly developed chocolate chip cookie on a scale of 1 to 50. Their ratings were: 34, 35, 41, 28, 26, 29, 32, 36, 38 and 40. What i... s the mean deviation? 8.00 4.12 12.67 0.75 2. Question : For which measure of central location will the sum of the deviations of each value from the data's average will always be zero? Mode Mean Median Geometric Mean None of the above 3. Question : A sample of the monthly amounts spent for food by families of four receiving food stamps approximates a symmetrical distribution. The sample mean is $150 and the standard deviation is $20. Using the Empirical Rule, about 95 percent of the monthly food expenditures are between what two amounts? $100 and $200 $85 and $105 $205 and $220 $110 and $190 4. Question : What is the relationship between the variance and the standard deviation? Variance is the square root of the standard deviation Variance is the square of the standard deviation Variance is twice the standard deviation No constant relationship between the variance and the standard deviation 5. Question : Which measures of central location are not affected by extremely small or extremely large values Mean and median Mean and mode Mode and median Geometric mean and median None of the above 6. Question : What is the median of 26, 30, 24, 32, 32, 31, 27 and 29? 32 29 30 29.5 7. Question : The number of students at a local university increased from 2,500 students to 5000 students in 10 years. Based on a geometric mean, the university grew at an average percentage rate of 2,500 students per year 1,071 percent per year 7.1 percent per year 250 students per year 8. Question : Fifteen accounting majors had an average grade of 90 on a finance exam. Seven marketing majors averaged 85, while ten finance majors averaged 93 on the same exam. What is the weighted mean for the 32 students taking the exam? 89.84 89.33 89.48 Impossible to determine without more information 9. Question : Which of the following measures of dispersion are based on deviations from the mean? Variance Standard deviation Mean deviation All of the above 10. Question : For an ungrouped data set with an odd number of observations that have been sorted or arrayed from smallest to largest values, where is the median located? n n/2 (n+1)/2 n+1/2 11. Question : The Investment Company Institute reported in its Mutual Fund Fact Book that the number of mutual funds increased from 5725 in 1995 to 7977 in 2005. What is the geometric mean annual percent increase in the number of funds? 1.034 3.37 39.34 71.77 633.5 12. Question : The weights (in grams) of the contents of several small bottles are 4, 2, 5, 4, 5, 2 and 6. What is the sample variance? 6.92 4.80 1.96 2.33 13. Question : What is the relationship among the mean, median and mode in a symmetric distribution They are all equal The mean is always the smallest value The mean is always the largest value The mode is always the largest value 14. Question : The U.S. Federal Aviation Administration reported that passenger revenues on international flights increased from $528 million in 1983 to $5,100 million in 2006. What is the geometric mean annual percent increase in international passenger revenues? 10.4 27.9 103.6 9.96 2814 15. Question : What disadvantage(s) are there of the mean deviation? Based only on two observations Based on deviations from the mean Uses absolute values, which are difficult to manipulate All of the above 16. Question : If the sample variance for a frequency distribution consisting of hourly wages was computed to be 10, what is the sample standard deviation? $1.96 $4.67 $3.16 $10.00 17. Question : For a set of grouped or ungrouped data, which measures of central location always have only one value? Mode and median Mode and mean Mode and geometric mean Mean and median 18. Question : A population consists of all the weights of all defensive tackles on Sociable University's football team. They are: Johnson, 204 pounds; Patrick, 215 pounds; Junior, 207 pounds; Kendron, 212 pounds; Nicko, 214 pounds; and Cochran, 208 pounds. What is the population standard deviation (in pounds)? About 4 About 16 About 100 About 40 19. Question : The net incomes (in $ millions) of a sample of steel fabricators are: $86, $67, $86 and $85. What is the modal net income? $67 $85 $85.5 $86 20. Question : Based on the Empirical Rule, what percent of the observations will lie above the mean plus two standard deviations? 95% 5% 68% 2.5% * Times are displayed in (GMT-06:00) Central Time (US & Canada) Grading Summary These are the automatically computed results of your exam. Grades for essay questions, and comments from your instructor, are in the "Details" section below. Date Taken: 9/4/2012 Time Spent: 16 min , 24 secs Points Received: 19 / 20 (95%) Question Type: # Of Questions: # Correct: True/False 20 19 Grade Details - All Questions 1. Question : Quartiles divide a distribution into four equal parts. True False 2. Question : A percentile divides a distribution into one hundred equal parts. True False 3. Question : Quartiles are another way to describe the central location of a distribution. True False 4. Question : Quartiles are another way to describe the dispersion of a distribution. True False 5. Question : The 50th percentile of a distribution is the same as the distribution mean. True False 6. Question : The interquartile range is the difference between the values of the first and third quartile, indicating the range of the middle fifty percent of the observations. True False 7. Question : The "box" in a box plot shows the interquartile range. True False 8. Question : An outlier is a data point that occurs in the first quartile. True False 9. Question : A box plot shows the relative symmetry of a distribution. True False 10. Question : A box plot shows a distribution's mean and mode. True False 11. Question : In a box plot, if a value is more than 1.5 times the interquartile range from the first or third quartile, the value is an outlier. True False 12. Question : The Pearson's coefficient of skewness is a measure of distribution's symmetry. True False 13. Question : Negatively skewed indicates that a distribution is not symmetrical. The long tail is to the left or in the negative direction. True False 14. Question : In a negatively skewed distribution, the mean is smaller than the median or mode and the mode occurs at the peak of the curve. True False 15. Question : If Pearson's coefficient of skewness is equal to 0, then the mean and median are equal. True False 16. Question : If Pearson's coefficient of skewness is negative, then the mean is greater than the median. True False 17. Question : If Pearson's coefficient of skewness is negative, then the distribution is skewed to the left. True False 18. Question : A relationship between gender and preference for Coke or Pepsi can be best represented by a contingency table. True False 19. Question : If Pearson's coefficient of skewness is negative, then the distribution is skewed to the right. True False 20. Question : An outlier is a value in a data set that is inconsistent with the rest of the data. True False * Times are displayed in (GMT-06:00) Central Time (US & Canada) Grading Summary These are the automatically computed results of your exam. Grades for essay questions, and comments from your instructor, are in the "Details" section below. Date Taken: 9/4/2012 Time Spent: 11 min , 44 secs Points Received: 20 / 20 (100%) Question Type: # Of Questions: # Correct: Multiple Choice 10 10 Grade Details - All Questions 1. Question : The test scores for a class of 147 students are computed. What is the location of the test score associated with the third quartile? 111 37 74 75% 2. Question : What statistics are needed to draw a box plot? Minimum, maximum, median, first and third quartiles Median, mean and standard deviation A median and an interquartile range A mean and a standard deviation. 3. Question : A box plot shows The mean and variance The relative symmetry of a distribution for a set of data The percentiles of a distribution The deciles of a distribution 4. Question : What does the interquartile range describe? The lower 50% of the observations The middle 50% of the observations The upper 50% of the observations The lower 25% and the upper 25% of the observations None of the above 5. Question : A large oil company is studying the number of gallons of gasoline purchased per customer at self-service pumps. The mean number of gallons is 10.0 with a standard deviation of 3.0 gallons. The median is 10.75 gallons. What is the Pearson's coefficient of skewness? -1.00 -0.75 +0.75 +1.00 6. Question : What is the value of the Pearson coefficient of skewness for a distribution with a mean of 17, median of 12 and standard deviation of 6? +2.5 -2.5 +0.83 -0.83 7. Question : A study of the net sales of a sample of small corporations revealed that the mean net sales is $2.1 million, the median $2.4 million, the modal sales $2.6 million and the standard deviation of the distribution is $500,000. What is the Pearson's coefficient of skewness? -9.1 +6.3 -3.9 +2.4 None of the above 8. Question : In a scatter diagram, we describe the relationship between two variables measured at the ordinal level two variables, one measured as an ordinal variable and the other as a ratio variable two variables measured at the interval or ratio level a variable measure on the interval or ratio level and time 9. Question : In a contingency table, we describe the relationship between two variables measured at the ordinal or nominal level two variables, one measured as an ordinal variable and the other as a ratio variable two variables measured at the interval or ratio level a variable measure on the interval or ratio level and time 10. Question : A sample of experienced typists revealed that their mean typing speed is 87 words per minute and the median is 73. The standard deviation is 16.9 words per minute. What is the Pearson's coefficient of skewness? -2.5 -4.2 +4.2 +2.5 * Times are displayed in (GMT-06:00) Central Time (US & Canada) Grading Summary These are the automatically computed results of your exam. Grades for essay questions, and comments from your instructor, are in the "Details" section below. Date Taken: 9/7/2012 Time Spent: 11 secs Points Received: 20 / 20 (100%) Question Type: # Of Questions: # Correct: True/False 20 20 Grade Details - All Questions 1. Question : Based on a classical approach, the probability of an event is defined as the number of favorable outcomes divided by the total number of possible outcomes. True False 2. Question : If only one of several events can occur at a time, we refer to these events as being mutually exclusive events. True False 3. Question : The probability of rolling a 3 or 2 on a single die is an example of conditional probability. True False 4. Question : The probability of rolling a 3 or 2 on a single die is an example of mutually exclusive events. True False 5. Question : The closer a probability is to 0, the more likely that an event will happen. The closer the probability is to 1.00, the more likely an event will not happen. True False 6. Question : An experiment is an activity that is either observed or measured. True False 7. Question : If two events are mutually exclusive, then P(A or B) = P(A) P(B). True False 8. Question : The complement rule states that the probability of an event not occurring is equal to one minus the probability of its occurrence. True False 9. Question : Two coins are tossed. The tossing of the coins is called an experiment, and one possible event is two heads. True False 10. Question : A combination is an arrangement of a set of objects in which there is an order from the first through the last. True False 11. Question : A permutation is an arrangement of a set of objects in which there is an order from the first through the last. True False 12. Question : If there are 'm' ways of doing one thing and 'n' ways of doing another thing, the multiplication formula states that there are (m) times (n) ways of doing both. True False 13. Question : A tree diagram is very useful for portraying conditional and joint probabilities. True False 14. Question : The general rule of multiplication is used to find the joint probability that two events will occur. Symbolically, the general rule of multiplication is P(A and B) = P(A) P(B|A). True False 15. Question : If there are two independent events A and B, the probability that A andB will occur is found by multiplying the two probabilities. Thus for two events A and B, the special rule of multiplication shown symbolically is: P(A and B) = P(A) P(B). True False 16. Question : A joint probability is a probability that measures the likelihood that two or more events will happen concurrently. True False 17. Question : To apply the special rule of addition, the events must be independent. True False 18. Question : To apply the special rule of addition, the events must be mutually exclusive. True False 19. Question : If an experiment, such as a die-tossing experiment, has a set of events that includes every possible outcome, the set of events is called collectively exhaustive. True False 20. Question : The probability of rolling a 3 or 2 on a single die is an example of joint probability. True False * Times are displayed in (GMT-06:00) Central Time (US & Canada) Grading Summary These are the automatically computed results of your exam. Grades for essay questions, and comments from your instructor, are in the "Details" section below. Date Taken: 9/7/2012 Time Spent: 10 secs Points Received: 20 / 20 (100%) Question Type: # Of Questions: # Correct: Multiple Choice 10 10 Grade Details - All Questions 1. Question : A student received an "A" on the first test of the semester. The student wants to calculate the probability of scoring an "A" on the second test. Historically, the instructor knows that the joint probability of scoring "A"'s on the first two tests is 0.5. Also, historically, the probability that a student scores and "A" on the second test given that a student scored an "A" on the first test is 0.9. What is the probability that a student will score an "A" on the second test? 0.50 0.95 0.55 0.90 2. Question : The first card selected from a standard 52-card deck was a king. If it is NOT returned to the deck, what is the probability that a king will be drawn on the second selection? 1/3 or 0.33 1/51, or 0.0196 3/51, or 0.0588 1/13 or 0.077 3. Question : The first card selected from a standard 52-card deck was a king. If it is returned to the deck, what is the probability that a king will be drawn on the second selection? 1/4 or 0.25 1/3 or 0.33 1/13, or 0.077 12/13, or 0.923 4. Question : A rug manufacturer has decided to use 7 compatible colors in her rugs. However, in weaving a rug, only 5 spindles can be used. In advertising, the rug manufacturer wants to indicate the number of different color groupings for sale. How many color groupings using the seven colors taken five at a time are there? (This assumes that 5 different colors will go into each rug, i.e., there are no repetitions of color.) 120 2,520 6,740 36 5. Question : Six basic colors are to be used in decorating a new condominium. They are to be applied to a unit in groups of four colors. One unit might have gold as the principal color, blue as a complementary color, red as the accent color and touches of white. Another unit might have blue as the principal color, white as the complimentary color, gold as the accent color and touches of red. If repetitions are permitted, how many different units can be decorated? 7,825 25 125 1,296 6. Question : There are two letters C and D. If repetitions such as CC are permitted, how many permutations are possible 1 0 4 8 7. Question : Three defective electric toothbrushes were accidentally shipped to a drugstore by the manufacturer along with 17 non-defective ones. What is the probability that the first two electric toothbrushes sold will be returned to the drugstore because they are defective? 3/20 or 0.15 3/17 or 0.176 1/4 or 0.25 3/190 or 0.01579 8. Question : In a management trainee program, 80 percent of the trainees are female, 20 percent male. Ninety percent of the females attended college, 78 percent of the males attended college. A management trainee is selected at random. What is the probability that the person selected is a female who did NOT attend college? 0.20 0.08 0.25 0.80 9. Question : A study by the National Park Service revealed that 50% of the vacationers going to the Rocky Mountain region visit Yellowstone Park, 40% visit the Grand Tetons and 35% visit both. What is the probability that a vacationer will visit at least one of these magnificent attractions? 0.95 0.35 0.55 0.05 10. Question : A study of 200 computer service firms revealed these incomes after taxes: Income After Taxes (number of firms) Under $1 million (102) $1 million up to $20 million (61) $20 million and more (37) What is the probability that a particular firm selected has $1 million or more in income after taxes? 0.00 0.25 0.49 0.51 * Times are displayed in (GMT-06:00) Central Time (US & Canada) Grading Summary These are the automatically computed results of your exam. Grades for essay questions, and comments from your instructor, are in the "Details" section below. Date Taken: 9/11/2012 Time Spent: 3 h , 20 min , 11 secs Points Received: 20 / 20 (100%) Question Type: # Of Questions: # Correct: True/False 20 20 Grade Details - All Questions 1. Question : The Poisson probability distribution is always negatively skewed. True False 2. Question : The probability of a particular outcome, designated X, must always be between 0 and 100 inclusive. True False 3. Question : If we toss two coins and count the number of heads, there could be 0, 1 or 2 heads. Since the exact number of heads resulting from this experiment is due to chance, the number of heads appearing is a random variable. True False 4. Question : The binomial probability distribution is always negatively skewed. True False 5. Question : The variance of a binomial distribution is found by n Pi (1 - Pi ). True False 6. Question : The mean of a binomial distribution is the product of n and Pi . True False 7. Question : The mean of a probability distribution is called its expected value. True False 8. Question : If the probability of success ( Pi ) remains the same, but n increases, the shape of the binomial distribution becomes more symmetrical. True False 9. Question : To construct a binomial distribution, it is necessary to know the total number of trials and the probability of success on each trial. True False 10. Question : A binomial distribution is a continuous probability distribution. True False 11. Question : The mean of a binomial probability distribution can be determined by multiplying the probability of a failure by the number of trials. True False 12. Question : A random variable may be either discrete or continuous. True False 13. Question : A Poisson distribution is a discrete probability distribution. It has the same four characteristics as the binomial, but in addition, the probability of a success is small and the number of trials is relatively large. True False 14. Question : For a binomial distribution, the data collected are the result of counts. True False 15. Question : For a binomial distribution, the probability of a success stays the same for each trial, but the probability of a failure varies from trial to trial. True False 16. Question : For a binomial distribution, outcomes of an experiment are classified into one of two mutually exclusive categories (a success or a failure). True False 17. Question : A binomial distribution has a characteristic that the trials are independent, which means that the outcome of one trial does not affect the outcome of any other trial. True False 18. Question : To construct a binomial probability distribution, the number of trials and the probability of success must be known. True False 19. Question : A probability distribution is a mutually exclusive listing of experimental outcomes that can occur by chance and their corresponding probabilities. True False 20. Question : A discrete variable may assume fractional or decimal values, but they must have distance between them. True False * Times are displayed in (GMT-06:00) Central Time (US & Canada) Grading Summary These are the automatically computed results of your exam. Grades for essay questions, and comments from your instructor, are in the "Details" section below. Date Taken: 9/11/2012 Time Spent: 01 min , 22 secs Points Received: 20 / 20 (100%) Question Type: # Of Questions: # Correct: Multiple Choice 10 10 Grade Details - All Questions 1. Question : A statistics professor receives an average of five e-mail messages per day from students. Assume the number of messages approximates a Poisson distribution. What is the probability that on a randomly selected day she will have no messages? 0.0067 zero 0.0335 Impossible to have no messages 2. Question : A statistics professor receives an average of five e-mail messages per day from students. Assume the number of messages approximates a Poisson distribution. What is the probability that on a randomly selected day she will have five messages? 0.0067 0.875 0.175 1.0 3. Question : A statistics professor receives an average of five e-mail messages per day from students. Assume the number of messages approximates a Poisson distribution. What is the probability that on a randomly selected day she will have two messages? 0.0067 0.0014 0.420 0.084 4. Question : A machine shop has 100 drill presses and other machines in constant use. The probability that a machine will become inoperative during a given day is 0.002. During some days no machines are inoperative, but during some days, one, two, three or more are broken down. What is the probability that fewer than two machines will be inoperative during a particular day? 0.0200 0.1637 0.8187 0.9824 5. Question : A tennis match requires that a player win three of five sets to win the match. If a player wins the first two sets, what is the probability that the player wins the match, assuming that each player is equally likely to win each match? 0.5 1/8 or 0.125 7/8 or 0.875 Cannot be computed. 6. Question : A farmer who grows genetically engineered corn is experiencing trouble with corn borers. A random check of 5,000 ears revealed the following: many of the ears contained no borers. Some ears had one borer; a few had two borers; and so on. The distribution of the number of borers per ear approximated the Poisson distribution. The farmer counted 3,500 borers in the 5,000 ears. What is the probability that an ear of corn selected at random will contain no borers? 0.3476 0.4966 1.000 0.0631 7. Question : A true-false test consists of six questions. If you guess the answer to each question, what is the probability of getting all six questions correct? 0 0.016 0.062 0.250 8. Question : The production department has installed a new spray machine to paint automobile doors. As is common with most spray guns, unsightly blemishes often appear because of improper mixture or other problems. A worker counted the number of blemishes on each door. Most doors had no blemishes; a few had one; a very few had two, and so on. The average number was 0.5 per door. The distribution of blemishes followed the Poisson distribution. Out of 10,000 doors painted, about how many would have no blemishes? About 6,065 About 3,935 About 5,000 About 500 9. Question : The marketing department of a nationally known cereal maker plans to conduct a national survey to find out whether or not consumers of flake cereals can distinguish one of their favorite flake cereals. To test the questionnaire and procedure to be used, eight persons were asked to cooperate in an experiment. Five very small bowls of flake cereals were placed in front of a person. The bowls were labeled A, B, C, D and E. The person was informed that only one bowl contained his or her favorite flake cereal. Suppose that the eight persons in the experiment were unable to identify their favorite cereal and just guessed which bowl it was in. What is the probability that none of the eight guessed correctly? 0.168 0.009 0.788 0.125 10. Question : On a very hot summer day, 5 percent of the production employees at Midland States Steel are absent from work. The production employees are randomly selected for a special in- depth study on absenteeism. What is the probability of randomly selecting 10 production employees on a hot summer day and finding that none of them are absent? 0.002 0.344 0.599 0.100 * Times are displayed in (GMT-06:00) Central Time (US & Canada) Grading Summary These are the automatically computed results of your exam. Grades for essay questions, and comments from your instructor, are in the "Details" section below. Date Taken: 9/13/2012 Time Spent: 14 secs Points Received: 20 / 20 (100%) Question Type: # Of Questions: # Correct: True/False 20 20 Grade Details - All Questions 1. Question : Non-stop Airlines determined that the mean number of passengers per flight is 152 with a standard deviation of ten passengers. Practically all flights have between 142 and 162 passengers. True False 2. Question : The standard normal distribution is a special normal distribution with a mean of 0 and a standard deviation of 1. True False 3. Question : The area under the normal curve within plus and minus one standard deviation of the mean is about 68.26%. True False 4. Question : Some normal probability distributions are positively skewed. True False 5. Question : Some normal probability distributions have different arithmetic means and different standard deviations. True False 6. Question : Some normal probability distributions have equal arithmetic means, but their standard deviations may be different. True False 7. Question : The normal curve falls off smoothly in either direction from the central value. Since it is asymptotic, the curve gets closer and closer to the X-axis, but never actually touches it. True False 8. Question : The uniform probability distribution is symmetric about the mean and median. True False 9. Question : The uniform probability distribution is symmetric about the mode. True False 10. Question : For a uniform probability distribution, the probability of any event is equal to 1/(b-a). True False 11. Question : In a uniform probability distribution, P(x) is constant between the distribution's minimum and maximum values. True False 12. Question : For any uniform probability distribution, the mean and standard deviation can be computed by knowing the maximum and minimum values of the random variable. True False 13. Question : The uniform probability distribution's standard deviation is proportional to the distribution's range. True False 14. Question : For any discrete probability distribution, the probability, P(x), of any value of the random variable, X, can be computed. True False 15. Question : The total area within any continuous probability distribution is equal to 1.00 True False 16. Question : The Empirical Rule of probability can be applied to the uniform probability distribution. True False 17. Question : Areas within a continuous probability distribution represent probabilities. True False 18. Question : The total area within a continuous probability distribution is equal to 100. True False 19. Question : When referring to the normal probability distribution, there is not just one; there is a "family" of distributions. True False 20. Question : A computed z for X values to the right of the mean is negative. True False * Times are displayed in (GMT-06:00) Central Time (US & Canada) Grading Summary These are the automatically computed results of your exam. Grades for essay questions, and comments from your instructor, are in the "Details" section below. Date Taken: 9/13/2012 Time Spent: 18 secs Points Received: 20 / 20 (100%) Question Type: # Of Questions: # Correct: Multiple Choice 10 10 Grade Details - All Questions 1. Question : For the normal distribution, the mean plus and minus 1.96 standard deviations will include about what percent of the observations? 50% 99.7% 95% 68% 2. Question : For a standard normal distribution, what is the probability that z is greater than 1.75? 0.0401 0.0459 0.4599 0.9599 3. Question : What is the area under the normal curve between z = 0.0 and z = 1.79? 0.4633 0.0367 0.9599 0.0401 4. Question : What is the area under the normal curve between z = –1.0 and z = –2.0? 0.0228 0.3413 0.1359 0.4772 5. Question : What is the area under the normal curve between z = 0.0 and z = 2.0? 1.0000 0.7408 0.1359 0.4772 6. Question : The mean amount spent by a family of four on food per month is $500 with a standard deviation of $75. Assuming that the food costs are normally distributed, what is the probability that a family spends less than $410 per month? 0.2158 0.8750 0.0362 0.1151 7. Question : The mean score of a college entrance test is 500; the standard deviation is 75. The scores are normally distributed. What percent of the students scored below 320? About 50.82% About 34.13% About 7.86% About 0.82% 8. Question : A study of a company's practice regarding the payment of invoices revealed that an invoice was paid an average of 20 days after it was received. The standard deviation equaled five days. Assuming that the distribution is normal, what percent of the invoices were paid within 15 days of receipt? 15.87% 37.91% 34.13% 86.74% 9. Question : The distribution of the annual incomes of a group of middle management employees approximated a normal distribution with a mean of $37,200 and a standard deviation of $800. About 68 percent of the incomes lie between what two incomes? $30,000 and $40,000 $36,400 and $38,000 $34,800 and $39,600 $35,600 and $38,800 10. Question : Ball-Bearings, Inc. produces ball bearings automatically on a Kronar BBX machine. For one of the ball bearings, the mean diameter is set at 20.00 mm (millimeters). The standard deviation of the production over a long period of time was computed to be 0.150 mm. What percent of the ball bearings will have diameters 20.27 mm or more? 41.00% 12.62% 3.59% 85.00% * Times are displayed in (GMT-06:00) Central Time (US & Canada) Grading Summary These are the automatically computed results of your exam. Grades for essay questions, and comments from your instructor, are in the "Details" section below. Date Taken: 9/17/2012 Time Spent: 09 secs Points Received: 20 / 20 (100%) Question Type: # Of Questions: # Correct: True/False 20 20 Grade Details - All Questions 1. Question : To determine the value of the standard error of the mean, the total error is divided by the sample size. True False 2. Question : The standard error of the mean will vary according to the size of the sample. As the sample size n gets larger, the variability of the sample means gets smaller. True False 3. Question : If the sample size keeps getting larger and larger and finally equals the size of the population, there would be no error in predicting the population mean because the sample size and the size of the population would be the same. True False 4. Question : An estimate of the population mean based on a large sample is less reliable than an estimate made using a small sample. True False 5. Question : If 40 samples of size 21 were selected from a population of 22,493, we would expect the mean of the sample means and the population mean to be close but not exactly equal. True False 6. Question : Based on the sampling distribution of the means and the central limit theorem, the sample mean can be used as a good estimator of the population mean, assuming that the size of the sample is sufficiently large. True False 7. Question : The Central Limit Theorem states that if the sample size, n, is sufficiently large, the sampling distribution of the means will be approximately normal no matter whether the population is normally distributed, skewed, or uniform. True False 8. Question : If a population is not normally distributed, the sampling distribution of the sample means tends to approximate a normal distribution. True False 9. Question : The central limit theorem implies that samples of size one or two are adequate to estimate population parameters. True False 10. Question : The central limit theorem implies that sampling with an adequate sample size provides good estimates of population parameters. True False 11. Question : A sampling distribution of the means is a probability distribution consisting of a list of all possible sample means of a given sample size selected from a population and the probability of occurrence associated with each sample mean. True False 12. Question : We can expect some difference between sample statistics and the corresponding population parameters. This difference is called the sampling error. True False 13. Question : If the size of a sample equals the size of the population, we would not expect any error in estimating the population parameter. True False 14. Question : The items or individuals of the population are arranged in a file drawer alphabetically by date received. A random starting point is selected and then every kth member of the population is selected for the sample. This sampling method is called simple random sampling. True False 15. Question : If probability sampling is done, each item in the population has a chance of being chosen. True False 16. Question : When systematic random sampling is used, the central limit theorem cannot be applied. True False 17. Question : In stratified random sampling, a population is divided into subgroups called strata and a sample is randomly selected from each stratum. True False 18. Question : In cluster sampling, a population is divided into subgroups called clusters and a sample is randomly selected from each cluster. True False 19. Question : A simple random sample assumes that each item or person in the population has an equal chance of being included. True False 20. Question : In cluster sampling, a population is divided into clusters using naturally occurring geographic or other boundaries. Then clusters are randomly selected and a random sample is collected from each cluster. True False * Times are displayed in (GMT-06:00) Central Time (US & Canada) Grading Summary These are the automatically computed results of your exam. Grades for essay questions, and comments from your instructor, are in the "Details" section below. Date Taken: 9/17/2012 Time Spent: 56 secs Points Received: 20 / 20 (100%) Question Type: # Of Questions: # Correct: Multiple Choice 10 10 Grade Details - All Questions 1. Question : An accounting firm is planning for the next tax preparation season. From last year's returns, the firm collects a systematic random sample of 100 filings. The 100 filings showed an average preparation time of 90 minutes with a standard deviation of 140 minutes. What is the standard error of the mean? 14 minutes 140 minutes 1.4 minutes 90 minutes 2. Question : An accounting firm is planning for the next tax preparation season. From last year's returns, the firm collects a systematic random sample of 100 filings. The 100 filings showed an average preparation time of 90 minutes with a standard deviation of 140 minutes. What is the probability that the mean completion time will be more than 120 minutes? Approximately zero 0.0832 0.4168 0.0162 3. Question : An accounting firm is planning for the next tax preparation season. From last year's returns, the firm collects a systematic random sample of 100 filings. The 100 filings showed an average preparation time of 90 minutes with a standard deviation of 140 minutes. What is the probability that the mean completion time is between 1 and 2 hours, i.e., 60 and 120 minutes? Approximately 1. 0.1664 0.8336 0.9676 4. Question : A group of statistics students decided to conduct a survey at their university to find the average (mean) amount of time students spend studying per week. Based on a simple random sample, they surveyed 144 students. The statistics showed that students studied an average of 20 hours per week with a standard deviation of 10 hours. What is the standard error of the mean? 0.83 10 0.5 2 5. Question : A group of statistics students decided to conduct a survey at their university to find the average (mean) amount of time students spend studying per week. Based on a simple random sample, they surveyed 144 students. The statistics showed that students studied an average of 20 hours per week with a standard deviation of 10 hours. What is the probability that a sample mean would exceed 20 hours per week? 1.0 0.5 1.96 Cannot be calculated based on the given information. 6. Question : A group of statistics students decided to conduct a survey at their university to find the average (mean) amount of time students spend studying per week. Based on a simple random sample, they surveyed 144 students. The statistics showed that students studied an average of 20 hours per week with a standard deviation of 10 hours. What is the probability of finding a sample mean less than 18 hours? 0.4820 0.4920 0.0080 0.0180 7. Question : A group of statistics students decided to conduct a survey at their university to find the average (mean) amount of time students spend studying per week. Based on a simple random sample, they surveyed 144 students. The statistics showed that students studied an average of 20 hours per week with a standard deviation of 10 hours. What is the probability that average student study time is between 18 and 22 hours? 0.9640 0.0160 0.0360 0.9840 8. Question : The Intelligence Quotient (IQ) test scores are normally distributed with a mean of 100 and a standard deviation of 15. What is the probability that a person would score 130 or more on the test? 0.0228 0.9772 0.4772 0.9544 9. Question : The Intelligence Quotient (IQ) test scores are normally distributed with a mean of 100 and a standard deviation of 15. What is the probability that a person would score between 85 and 115? 0.3413 0.6826 1.00 very likely 10. Question : The Intelligence Quotient (IQ) test scores are normally distributed with a mean of 100 and a standard deviation of 15. You enrolled in a class of 25 students. What is the probability that the class' average IQ exceeds 130? 0.0228 0.9772 Approximately zero 0.9544 * Times are displayed in (GMT-06:00) Central Time (US & Canada) Grading Summary These are the automatically computed results of your exam. Grades for essay questions, and comments from your instructor, are in the "Details" section below. Date Taken: 9/18/2012 Time Spent: 10 secs Points Received: 20 / 20 (100%) Question Type: # Of Questions: # Correct: True/False 20 20 Grade Details - All Questions 1. Question : A point estimate is a range of values used to estimate a population parameter. True False 2. Question : An interval estimate is a single value used to estimate a population parameter. True False 3. Question : If the size of a sample equals the size of the population, we would not expect any error in estimating the population parameter. True False 4. Question : We can expect some difference between sample statistics and the corresponding population parameters. This difference is called the sampling error. True False 5. Question : The Central Limit Theorem proves that the sampling distribution of sample means tends to approximate a normal distribution when the sample size becomes larger. True False 6. Question : The 95 percent confidence interval states that 95 percent of the sample means of a specified sample size selected from a population will lie within plus and minus 1.96 standard deviations of the hypothesized population mean. True False 7. Question : One factor in determining the size of a sample is the maximum allowable error that you must decide on. It is the maximum error you will tolerate at a specified level of confidence. True False 8. Question : The variation in the population as measured by the standard deviation has little or no effect in determining the size of a sample selected from the population. True False 9. Question : The higher the degree of confidence, the larger the sample required to give a certain precision. True False 10. Question : To determine the value of the standard error of the mean, the total error is divided by the sample size. True False 11. Question : A distribution of sample means is normally distributed with a mean equal to the population mean and a standard deviation equal to the standard error of the mean. True False 12. Question : To determine the size of a sample, the standard deviation of the population must be estimated by either taking a pilot survey or by approximating it based on knowledge of the population. True False 13. Question : The t distribution is based on the assumption that the population of interest is normal or nearly normal. True False 14. Question : The t distribution is a continuous distribution. True False 15. Question : There is not one t distribution, but rather a "family" of t distributions. True False 16. Question : The t distribution is positively skewed. True False 17. Question : The t distribution is more spread out and flatter at the center than the standard normal distribution. However, as the sample size increases, the t distribution curve approaches the standard normal distribution. True False 18. Question : The Student t distribution has a greater spread than does the z distribution. As a result, the critical values of t for a given level of significance are larger in magnitude than the corresponding z critical values. True False 19. Question : The test statistic t has n – 1 degrees of freedom. True False 20. Question : The test statistic for a problem involving any sample size and an unknown population standard deviation is the Student's t distribution. True False * Times are displayed in (GMT-06:00) Central Time (US & Canada) Grading Summary These are the automatically computed results of your exam. Grades for essay questions, and comments from your instructor, are in the "Details" section below. Date Taken: 9/18/2012 Time Spent: 40 secs Points Received: 20 / 20 (100%) Question Type: # Of Questions: # Correct: Multiple Choice 10 10 Grade Details - All Questions 1. Question : The mean number of travel days per year for salespeople employed by hardware distributors needs to be estimated with a 0.90 degree of confidence. For a small pilot study the mean was 150 days and the standard deviation was 14 days. If the population mean is estimated within two days, how many salespeople should be sampled? 134 452 511 2100 2. Question : A random sample of 85 group leaders, supervisors, and similar personnel revealed that a person spent an average 6.5 years on the job before being promoted. The population standard deviation was 1.7 years. Using the 0.95 degree of confidence, what is the confidence interval for the population mean? 6.99 and 7.99 4.15 and 7.15 6.14 and 6.86 6.49 and 7.49 3. Question : The mean weight of trucks traveling on a particular section of I-475 is not known. A state highway inspector needs an estimate of the mean. He selects a random sample of 49 trucks passing the weighing station and finds the mean is 15.8 tons. The population standard deviation is 3.8 tons. What is the 95 percent interval for the population mean? 14.7 and 16.9 13.2 and 17.6 10.0 and 20.0 16.1 and 18.1 4. Question : For a given confidence interval, what is the interpretation of a 96% confidence level? 96% chance that the given interval includes the true value of the population parameter Approximately 96 out of 100 such intervals would include the true value of the population parameter 4% chance that the given interval does not include the true value of the population parameter Both "a" and "c" are true 5. Question : Which statement(s) is/are correct about the t distribution? Mean = 0 Symmetric Based on degrees of freedom All of the above are correct None of the above is correct 6. Question : How is the t distribution similar to the standard z distribution? Both are continuous distribution Both are bell-shaped Both are families of distributions A and B A, B and C 7. Question : A sample of 20 is selected from the population. To determine the appropriate critical t- value what number of degrees of freedom should be used? 20 19 21 25 8. Question : The t distribution is similar to the z distribution in all BUT one of the following characteristics. Which one is it? Continuous Symmetrical Bell-shaped t distribution's mean = 0 and standard deviation = 1 9. Question : When using Student's t to compute an interval estimate, we assume that the samples are collected from normally distributed populations we estimate the population standard deviation based on the sample standard deviation use the z distribution A and B only 10. Question : A random sample of 42 college graduates who worked during their program revealed that a student spent an average 5.5 years on the job before being promoted. The sample standard deviation was 1.1 years. Using the 0.99 degree of confidence, what is the confidence interval for the population mean? 5.04 and 5.96 5.06 and 5.94 2.67 and 8.33 4.40 and 6.60 * Times are displayed in (GMT-06:00) Central Time (US & Canada) Grading Summary These are the automatically computed results of your exam. Grades for essay questions, and comments from your instructor, are in the "Details" section below. Date Taken: 9/24/2012 Time Spent: 11 secs Points Received: 20 / 20 (100%) Question Type: # Of Questions: # Correct: True/False 20 20 Grade Details - All Questions 1. Question : For a one-tailed test of hypothesis, the area of rejection is only in one tail of the curve. True False 2. Question : To prevent bias, the level of significance is selected before setting up the decision rule and sampling the population. True False 3. Question : If the null hypothesis is false and the researcher rejects it, then a Type II error has been committed. True False 4. Question : For a two-tailed null hypothesis and a test statistic, Z=1.96, the p-value is 0.05 True False 5. Question : For a one-tailed null hypothesis and a test statistic, Z= 1.96, the p-value is 0.025 True False 6. Question : When the p-value is 0.001 or less, there is extremely strong evidence that the null hypothesis is not true. True False 7. Question : When the p-value is 0.001 or less, there is extremely strong evidence that the null hypothesis is true. True False 8. Question : The null hypothesis is rejected when a p-value is greater than a stated significance level. True False 9. Question : The null hypothesis is rejected when a p-value is less than a stated significance level. True False 10. Question : When testing a hypothesis, a test statistic is required to compute a p-value. True False 11. Question : Assuming that the null hypothesis is true, a p-value is the probability of observing a sample value greater than and/or less than an observed sample observation. True False 12. Question : A p-value is the same as a stated significance level. True False 13. Question : If we do not reject the null hypothesis based on sample evidence, we have proven beyond doubt that the null hypothesis is true. True False 14. Question : When the null hypothesis is not rejected, the conclusion is that our sample data does not allow us to reject the null hypothesis. True False 15. Question : A Type I error is the probability of rejecting a true null hypothesis. True False 16. Question : A Type I error is the probability of accepting a true null hypothesis. True False 17. Question : If the null hypothesis is mu is > or = to 200 and the alternate hypothesis states that mu is less than 200, then, a two-tail test is being conducted. True False 18. Question : The probability of a Type I error is also referred to as alpha. True False 19. Question : The level of significance is the risk we assume of rejecting the null hypothesis when it is actually true. True False 20. Question : An alternate hypothesis is a statement about a population parameter that is accepted when the null hypothesis is rejected. True False * Times are displayed in (GMT-06:00) Central Time (US & Canada) Grading Summary These are the automatically computed results of your exam. Grades for essay questions, and comments from your instructor, are in the "Details" section below. Date Taken: 9/24/2012 Time Spent: 03 min , 18 secs Points Received: 20 / 20 (100%) Question Type: # Of Questions: # Correct: Multiple Choice 10 10 Grade Details - All Questions 1. Question : The mean length of a small counter balance bar is 43 millimeters. There is concern that the adjustments of the machine producing the bars have changed. Test the claim at the 0.02 level that there has been no change in the mean length. The alternate hypothesis is that there has been a change. Twelve bars (n = 12) were selected at random and their lengths recorded. The lengths are (in millimeters) 42, 39, 42, 45, 43, 40, 39, 41, 40, 42, 43 and 42. The mean of the sample is 41.5 and the standard deviation 1.784. Computed t = – 2.913. Has there been a statistically significant change in the mean length of the bars? Yes, because the computed t lies in the area beyond the critical. No, because the information given is not complete. No, because the computed t lies in the area to the right of –2.718. None of the above 2. Question : From past records it is known that the average life of a battery used in a digital clock is 305 days. The battery life is normally distributed. The battery was recently modified to last longer. A sample of 20 of the modified batteries was tested. It was discovered that the mean life was 311 days and the sample standard deviation was 12 days. We want to test at the 0.05 level of significance whether the modification increases the life of the battery. What is our decision rule? Do not reject the null hypothesis if computed t is 1.96 or greater Reject the null hypothesis if computed t is less than 1.96 Do not reject the null hypothesis if computed t is 1.729 or greater Reject the null hypothesis if computed t is 2.086 or greater None of the above 3. Question : A manufacturer wants to increase the shelf life of a line of cake mixes. Past records indicate that the average shelf life of the mix is 216 days. After a revised mix has been developed, a sample of nine boxes of cake mix gave these shelf lives (in days): 215, 217, 218, 219, 216, 217, 217, 218 and 218. At the 0.025 level, has the shelf life of the cake mix increased? Yes, because computed t is greater than the critical value. Yes, because computed t is less than the critical value. No, because computed t lies in the region of acceptance. No, because 217.24 is quite close to 216. 4. Question : A manufacturer wants to increase the absorption capacity of a sponge. Based on past data, the average sponge could absorb 3.5 ounces. After the redesign, the absorption amounts of a sample of sponges were (in ounces): 4.1, 3.7, 3.3, 3.5, 3.8, 3.9, 3.6, 3.8, 4.0, and 3.9. What is the decision rule at the 0.01 level of significance to test if the new design increased the absorption amount of the sponge? Do not reject null hypothesis if computed t is less than 2.580 Do not reject null hypothesis if computed t is less than 2.821 Reject null hypothesis if computed z is 1.96 or larger Reject null hypothesis if computed t is less than 2.764 5. Question : A random sample of size 15 is selected from a normal population. The population standard deviation is unknown. Assume that a two-tailed test at the 0.10 significance level is to be used. For what value of t will the null hypothesis not be rejected? To the left of –1.282 or to the right of 1.282 To the left of –1.345 or to the right of 1.345 To the left of –1.761 or to the right of 1.761 To the left of –1.645 or to the right of 1.645 6. Question : What is the critical value for a one-tailed hypothesis test in which a null hypothesis is tested at the 5% level of significance based on a sample size of 25? 1.708 1.711 2.060 2.064 7. Question : If the alternate hypothesis states that mu does not equal 4,000, what is the rejection region for the hypothesis test? Both tails Lower or left tail Upper or right tail Center 8. Question : What are the two rejection areas in using a two-tailed test and the 0.01 level of significance when n is large and the population standard deviation is known? Above 1.96 and below –1.96 Above 1.65 and below –1.65 Above 2.58 and below –2.58 Above 1.00 and below –1.00 9. Question : If the 1% level of significance is used and the computed value of z is +6.00, what is our decision? Do not reject H0 Reject H0 Reject H1 None of the above 10. Question : For a two-tailed test at the 0.05 significance level, what is the rejection region when n if large and the population standard deviation is known? Between + or - 1.96 Between + or - 1.65 Greater than +1.96 and less than – 1.96 Greater than +1.65 and less than –1.65 * Times are displayed in (GMT-06:00) Central Time (US & Canada) Grading Summary These are the automatically computed results of your exam. Grades for essay questions, and comments from your instructor, are in the "Details" section below. Date Taken: 9/27/2012 Time Spent: 0-59 secs Points Received: 20 / 20 (100%) Question Type: # Of Questions: # Correct: True/False 19 19 Grade Details - All Questions 1. Question : If the null hypothesis states that there is no difference between the mean income of males and the mean income of females, then the test is one-tailed. True False 2. Question : If the null hypothesis states that there is no difference between the mean net income retail stores in Chicago and New York City, then the test is two-tailed. True False 3. Question : If we are testing for the difference between two population means, it is assumed that the sample observations from one population are independent of the sample observations from the other population. True False 4. Question : If we are testing for the difference between two population proportions, it is assumed that the two populations are approximately normal and have equal variances. True False 5. Question : If we are testing for the difference between two population proportions, it is assumed that the two samples are large enough that the binomial distribution can be approximated by the normal distribution. True False 6. Question : When sample sizes are less than 30, a test for the differences between two population means has n–1 degrees of freedom. True False 7. Question : If we are testing for the difference between two population means and assume that the two populations have equal but unknown standard deviations, then the test has (n1 + n2 – 2) degrees of freedom. True False 8. Question : If we are testing for the difference between two population means and assume that the two populations have equal but unknown standard deviations, the variances are pooled to compute the best estimated variance. True False 9. Question : If we are testing for the difference between two population means and assume that the two populations have unequal and unknown standard deviations, the degrees of freedom for the test statistic must be computed or calculated. True False 10. Question : If we are testing for the difference between two population means and assume that the two populations have unequal and unknown standard deviations, the variances are pooled to compute the best estimated variance. True False 11. Question : If samples taken from two populations are not independent, then a test of paired differences is applied. True False 12. Question : The paired difference test has (n1 + n2 – 2) degrees of freedom. True False 13. Question : When testing for the difference between two dependent samples, n1 = n2. True False 14. Question : The pooled estimate of the proportion is found by dividing the total number of samples by the total number of successes. True False 15. Question : We use the pooled estimate of the proportion in testing the difference between two population proportions. True False 16. Question : The paired t test is especially appropriate when the sample sizes of two groups are the same. True False 17. Question : A committee studying employer-employee relations proposed that each employee would rate his or her immediate supervisor and in turn the supervisor would rate each employee. To find reactions regarding the proposal, 120 office personnel and 160 plant personnel were selected at random. Seventy-eight of the office personnel and 90 of the plant personnel were in favor of the proposal. Computed z = 1.48. At the 0.05 level, it was concluded that there is sufficient evidence to support the belief that the proportion of office personnel in favor of the proposal is greater than that of the plant personnel. True False 18. Question : A statistics professor wants to compare grades of two different groups of students taking the same course in two different sections. This is an example of a paired sample. True False 19. Question : In one class, a statistics professor wants to compare grades on the first and second exams. This is an example of paired or dependent observations. True False * Times are displayed in (GMT-06:00) Central Time (US & Canada) Grading Summary These are the automatically computed results of your exam. Grades for essay questions, and comments from your instructor, are in the "Details" section below. Date Taken: 9/27/2012 Time Spent: 10 secs Points Received: 20 / 20 (100%) Question Type: # Of Questions: # Correct: Multiple Choice 10 10 Grade Details - All Questions 1. Question : If the null hypothesis that two means are equal is true, where will 97% of the computed z- values lie between? +/-2.58 +/-2.53 +/-2.17 +/-2.07 2. Question : The net weights of a sample of bottles filled by a machine manufactured by Edne, and the net weights of a sample filled by a similar machine manufactured by Orno, Inc., are (in grams): Edne: 5, 8, 7, 6, 9 and 7 Orno: 8, 10, 7, 11, 9, 12, 14 and 9 Testing the claim at the 0.05 level that the mean weight of the bottles filled by the Orno machine is greater than the mean weight of the bottles filled by the Edne machine, what is the critical value? Assume equal standard deviations for both samples. 2.179 2.145 1.782 1.761 3. Question : A hypothesis will test that two population means are equal. A sample of 10 with a standard deviation of 3 is selected from the first population and a sample of 15 with a standard deviation of 8 from the second population. The sample standard deviations are not equal. Testing the claim at the 0.01 level, what is the critical value? . 2.845 2.787 2.807 2.977 4. Question : Using two independent samples, two population means are compared to determine if a difference exists. The population standard deviations are equal. The number in the first sample is fifteen and the number in the second sample is twelve. How many degrees of freedom are associated with the critical value? 24 25 26 27 5. Question : If two samples are used in a hypothesis test for which the combined degrees of freedom is 24, which one of the following is NOT true about the two sample sizes? Assume the population standard deviations are equal. Sample A = 11; sample B = 13 Sample A = 12; sample B = 14 Sample A = 13; sample B = 13 Sample A = 10; sample B = 16 Cannot determine from the above information 6. Question : A national manufacturer of ball bearings is experimenting with two different processes for producing precision ball bearings. It is important that the diameters be as close as possible to an industry standard. The output from each process is sampled and the average error from the industry standard is calculated. The results are presented below. Process A: Mean=0.002; Std. Dev.=0.0001; n=12 Process B: Mean=0.0026; Std. Dev.=0.00012; n=14 The researcher is interested in determining whether there is evidence that the two processes yield different average errors. Assume that the population standard deviations are equal. Assume calculated t to be +2.70, at the 0.01 level of significance what would be the decision? Reject the null hypothesis and conclude the means are different. Reject the null hypothesis and conclude the means are the same. Fail to reject the null hypothesis and conclude the means are the same. Fail to reject the null hypothesis and conclude the means are different. 7. Question : Accounting procedures allow a business to evaluate their inventory at LIFO (Last In First Out) or FIFO (First In First Out). A manufacturer evaluated its finished goods inventory (in $ thousands) for five products both ways. Based on the following results, is LIFO more effective in keeping the value of his inventory lower? Product FIFO (F) LIFO (L) 1 225 212 2 119 100 3 100 113 4 212 200 5 248 245 If you use the 5% level of significance, what is the critical t value? +2.132 2.776 +2.262 2.228 8. Question : Accounting procedures allow a business to evaluate their inventory at LIFO (Last In First Out) or FIFO (First In First Out). A manufacturer evaluated its finished goods inventory (in $ thousands) for five products both ways. Based on the following results, is LIFO more effective in keeping the value of his inventory lower? Product FIFO (F) LIFO (L) 1 225 221 2 119 100 3 100 113 4 212 200 5 248 245 What is the value of calculated t? +1.93 2.776 +0.047 -2.028 9. Question : Accounting procedures allow a business to evaluate their inventory at LIFO (Last In First Out) or FIFO (First In First Out). A manufacturer evaluated its finished goods inventory (in $ thousands) for five products both ways. Based on the following results, is LIFO more effective in keeping the value of his inventory lower? Product FIFO (F) LIFO (L) 1 225 221 2 119 100 3 100 113 4 212 200 5 248 245 What is the decision rule at the 5% level of significance? Fail to reject the null hypothesis and conclude LIFO is more effective. Reject the null hypothesis and conclude LIFO is more effective. Reject the alternate hypothesis and conclude LIFO is more effective. Fail to reject the null hypothesis and conclude LIFO is not more effective. 10. Question : Accounting procedures allow a business to evaluate their inventory at LIFO (Last In First Out) or FIFO (First In First Out). A manufacturer evaluated its finished goods inventory (in $ thousands) for five products both ways. Based on the following results, is LIFO more effective in keeping the value of his inventory lower? Product FIFO (F) LIFO (L) 1 225 212 2 119 100 3 100 113 4 212 200 5 248 245 This example is what type of test? One sample test of means Two sample test of means Paired t test Test of proportions * Times are displayed in (GMT-06:00) Central Time (US & Canada) Grading Summary These are the automatically computed results of your exam. Grades for essay questions, and comments from your instructor, are in the "Details" section below. Date Taken: 10/2/2012 Time Spent: 02 min , 21 secs Points Received: 20 / 20 (100%) Question Type: # Of Questions: # Correct: True/False 10 10 Grade Details - All Questions 1. Question : The test statistic used in ANOVA is Student's t. True False 2. Question : There is one, unique F distribution for a F-statistic with 29 degrees of freedom in the numerator and 28 degrees of freedom in the denominator. True False 3. Question : One characteristic of the F distribution is that F cannot be negative. True False 4. Question : The shape of the F distribution is determined by the degrees of freedom for the F-statistic, one for the numerator and one for the denominator. True False 5. Question : To employ ANOVA, the populations being studied must be approximately normally distributed. True False 6. Question : To employ ANOVA, the populations should have approximately equal standard deviations. True False 7. Question : The alternate hypothesis used in ANOVA is mu1=mu2=mu3=m4. True False 8. Question : The alternate hypothesis for ANOVA states that not all the means are equal. True False 9. Question : For an ANOVA test, rejection of the null hypothesis does not identify which treatment means differ significantly. True False 10. Question : A treatment is a specific source of variation in a set of data. True False * Times are displayed in (GMT-06:00) Central Time (US & Canada) Grading Summary These are the automatically computed results of your exam. Grades for essay questions, and comments from your instructor, are in the "Details" section below. Date Taken: 10/2/2012 Time Spent: 19 min , 08 secs Points Received: 20 / 20 (100%) Question Type: # Of Questions: # Correct: Multiple Choice 10 10 Grade Details - All Questions 1. Question : An F statistic is: a ratio of two means. a ratio of two variances. the difference between three means. a population parameter. 2. Question : What distribution does the F distribution approach as the sample size increases? Binomial Normal Poisson Exponential 3. Question : Analysis of variance is used to compare nominal data. compute a t test. compare population proportions. simultaneously compare several population means. 4. Question : A large department store examined a sample of the 18 credit card sales and recorded the amounts charged for each of three types of credit cards: MasterCard, Visa and Discover. Six MasterCard sales, seven Visa and five Discover sales were recorded. The store used ANOVA to test if the mean sales for each credit card were equal. What are the degrees of freedom for the F statistic? 18 in the numerator, 3 in the denominator 3 in the numerator, 18 in the denominator 2 in the numerator, 15 in the denominator 6 in the numerator, 15 in the denominator 5. Question : Suppose that an automobile manufacturer designed a radically new lightweight engine and wants to recommend the grade of gasoline that will have the best fuel economy. The four grades are: regular, below regular, premium, and super premium. The test car made three trial runs on the test track using each of the four grades and the miles per gallon recorded. At the 0.05 level, what is the critical value of F used to test the hypothesis that the miles per gallon for each fuel is the same. Kilometers per liter Regular Below Regular Premium Super Premium 39.31 36.69 38.99 40.04 38.87 40.00 40.02 39.89 39.87 41.01 39.99 39.93 196 4.07 2.33 12.00 6. Question : Three different fertilizers were applied to a field of celery. In computing F, how many degrees of freedom are there in the numerator? 0 1 2 3 7. Question : Suppose a package delivery company purchased 14 trucks at the same time. Five trucks were purchased from manufacturer A, four from B and five from manufacturer C. The cost of maintaining each truck was recorded. The company used ANOVA to test if the mean maintenance cost of the trucks from each manufacturer were equal. To apply the F test, how many degrees of freedom are in the denominator? 2 3 11 14 8. Question : An electronics company wants to compare the quality of their cell phones to the cell phones from three competitors. They sample 10 phones from each company and count the number of defects for each phone. If ANOVA were used to compare the average number of defects, the treatments would be defined as: the number of cell phones sampled. the average number of defects. the total number of phones. the four companies. 9. Question : Several employees have submitted different methods of assembling a subassembly. Sample data for each method are: Minutes required for assembly Sample Number Lind's Method Szabo's Method Carl's Method Manley's Method 1 16.6 22.4 31.4 18.4 2 17.0 21.5 33.4 19.6 3 16.9 22.6 30.1 17.6 How many treatments are there? 3 4 12 0 10. Question : If an ANOVA test is conducted and the null hypothesis is rejected, what does this indicate? Too many degrees of freedom No difference between the population means A difference between at least one pair ofpopulation means. None of the above * Times are displayed in (GMT-06:00) Central Time (US & Canada) Grading Summary These are the automatically computed results of your exam. Grades for essay questions, and comments from your instructor, are in the "Details" section below. Date Taken: 10/5/2012 Time Spent: 37 secs Points Received: 20 / 20 (100%) Question Type: # Of Questions: # Correct: True/False 20 20 Grade Details - All Questions 1. Question : An economist is interested in predicting the unemployment rate based on gross domestic product. Since the economist is interested in predicting unemployment, the independent variable is gross domestic product. True False 2. Question : Correlation analysis is a group of statistical techniques used to measure the strength of the relationship (correlation) between two variables. True False 3. Question : The coefficient of correlation, r, is often referred to as Spearman's rho. True False 4. Question : The strength of the correlation between two variables depends on the sign of the coefficient of correlation. True False 5. Question : Correlation coefficients of –0.91 and +0.91 represent relationships between two variables that have equal strength but different directions. True False 6. Question : A coefficient of correlation of –0.96 indicates a very weak negative correlation. True False 7. Question : The coefficient of determination is the proportion of the total variation in the dependent variable Y that is explained or accounted for by its relationship with the independent variable X. True False 8. Question : If the coefficient of correlation is –0.90, the coefficient of determination is –0.81. True False 9. Question : The coefficient of determination is the proportion of total variation in Y that is explained by X. True False 10. Question : Pearson's product-moment correlation coefficient, r, requires that the data be interval or ratio scaled, such as incomes and weights. True False 11. Question : The standard error of estimate measures the accuracy of our prediction. True False 12. Question : Pearson's coefficient of correlation can be used if the data is nominally scaled. True False 13. Question : A t test is used to test the significance of the coefficient of correlation. True False 14. Question : When testing the strength of the relationship between two variables, the null hypothesis is: Ho: rho = 0 True False 15. Question : . A regression equation may be determined using a mathematical method called the least squares principle. True False 16. Question : A regression equation found using the least squares principle is the best-fitting line because the sum of the squares of the vertical deviations between the actual and estimated values is minimized. True False 17. Question : The equation for a straight line going through the plots on a scatter diagram is called a regression equation. It is alternately called an estimating equation and a predicting equation. True False 18. Question : The standard error of estimate is used to construct confidence intervals when the sample size is large and the scatter about the regression line is somewhat normally distributed. True False 19. Question : The smaller the samples, the smaller the standard error of estimate. True False 20. Question : Explained variation equals total variation minus unexplained variation. True False * Times are displayed in (GMT-06:00) Central Time (US & Canada) Grading Summary These are the automatically computed results of your exam. Grades for essay questions, and comments from your instructor, are in the "Details" section below. Date Taken: 10/5/2012 Time Spent: 11 secs Points Received: 20 / 20 (100%) Question Type: # Of Questions: # Correct: Multiple Choice 10 10 Grade Details - All Questions 1. Question : If r = 0.65, what does the coefficient of determination equal? 0.194 0.423 0.577 0.806 2. Question : Which value of r indicates a stronger correlation than 0.40? -0.30 -.50 +0.38 0 3. Question : A hypothesis test is conducted at the .05 level of significance to test whether or not the population correlation is zero. If the sample consists of 25 observations and the correlation coefficient is 0.60, then what is the computed value of the test statistic? 1.96 2.07 2.94 3.60 4. Question : . Suppose the least squares regression equation is y^ = 1202 + 1,133X. When X = 3, what does y^ equal? 5,734 8,000 4,601 4,050 5. Question : In the least squares equation, y^ = 10 + 20X the value of 20 indicates the Y intercept. for each unit increase in X, Y increases by 20. for each unit increase in Y, X increases by 20. none of the above. 6. Question : Given the following five points: (–2,0), (–1,0), (0,1), (1,1), and (2,3). What is the slope of the line? 0.0 0.5 0.6 0.7 7. Question : Given the following five points: (–2,0), (–1,0), (0,1), (1,1), and (2,3). What is the Y intercept? 0.0 0.7 1.0 1.5 8. Question : Given the following five points: (–2,0), (–1,0), (0,1), (1,1), and (2,3). What is the standard error of the estimate? 0 0.135 0.367 0.606 9. Question : Given the following five points: (–2,0), (–1,0), (0,1), (1,1), and (2,3). What is the critical value necessary to determine a confidence interval for a 95% level of confidence? 2.132 2.353 2.776 3.182 10. Question : Given the following five points: (–2,0), (–1,0), (0,1), (1,1), and (2,3). What is the critical value necessary to determine a confidence interval for a 90% level of confidence? 1.533 1.638 2.132 2.353 * Times are displayed in (GMT-06:00) Central Time (US & Canada) Grading Summary These are the automatically computed results of your exam. Grades for essay questions, and comments from your instructor, are in the "Details" section below. Date Taken: 10/9/2012 Time Spent: 15 secs Points Received: 20 / 20 (100%) Question Type: # Of Questions: # Correct: True/False 10 10 Grade Details - All Questions 1. Question : The multiple coefficient of determination, R-squared, reports the proportion of the variation in Y that is not explained by the variation in the set of independent variables. True False 2. Question : Multiple regression analysis is used when two or more independent variables are used to predict a value of a single dependent variable. True False 3. Question : The values of b1, b2 and b3 in a multiple regression equation are called the net regression coefficients. True False 4. Question : Multiple regression analysis examines the relationship of several dependent variables on the independent variable. True False 5. Question : A coefficient of multiple determination could be equal to –0.76. True False 6. Question : The coefficient of multiple determination reports the strength of the association between a dependent variable and a set of independent variables. True False 7. Question : In a multiple regression analysis with two independent variables, the multiple standard error of estimate measures the variation of the dependent variable about a regression plane. True False 8. Question : In multiple regression analysis, a and b1 are sample statistics that estimate the population parameters, alpha and beta. True False 9. Question : A multiple regression equation defines the relationship between a dependent variable and a set of independent variables in the form of an equation. True False 10. Question : Multiple regression analysis is used when one independent variable is used to predict values of two or more dependent variables. True False * Times are displayed in (GMT-06:00) Central Time (US & Canada) Grading Summary These are the automatically computed results of your exam. Grades for essay questions, and comments from your instructor, are in the "Details" section below. Date Taken: 10/9/2012 Time Spent: 10 secs Points Received: 20 / 20 (100%) Question Type: # Of Questions: # Correct: Multiple Choice 10 10 Grade Details - All Questions 1. Question : How is the degree of association between a set of independent variables and a dependent variable measured? Confidence intervals Autocorrelation Coefficient of multiple determination Standard error of estimate 2. Question : Multiple regression analysis is applied when analyzing the relationship between An independent variable and several dependent variables A dependent variable and several independent variables Several dependent variables and several independent variables Several regression equations and a single sample 3. Question : What can we conclude if the global test of regression rejects the null hypothesis? Strong correlations exist among the variables No relationship exists between the dependent variable and any of the independent variables At least one of the net regression coefficients is not equal to zero. Good predictions are not possible 4. Question : In multiple regression analysis, testing the global null hypothesis that the multiple regression coefficients are all zero is based on a z statistic a t statistic a F statistic binomial distribution 5. Question : If the correlation between the two independent variables of a regression analysis is 0.11 and each independent variable is highly correlated to the dependent variable, what does this indicate? Only one of the independent variables should be used in the regression equation. The independent variables are strongly related. Two separate regression equations are required. Both independent variables should be used to predict the dependent variable. 6. Question : What can we conclude if the global test of regression does not reject the null hypothesis? A strong relationship exists among the variables No relationship exists between the dependent variable and any of the independent variables The independent variables are good predictors Good forecasts are possible 7. Question : If there are four independent variables in a multiple regression equation, there are also four Y-intercepts. regression coefficients. dependent variables. constant terms. 8. Question : What does the correlation matrix for a multiple regression analysis contain? Multiple correlation coefficients Simple correlation coefficients Multiple coefficients of determination Multiple standard errors of estimate 9. Question : In multiple regression, a dummy variable can be included in a multiple regression model as An additional quantitative variable A nominal variable with three or more values A nominal variable with only two values A new regression coefficient 10. Question : What is the range of values for multiple R? –100% to –100% inclusive –100% to 0% inclusive 0% to +100% inclusive Unlimited range * Times are displayed in (GMT-06:00) Central Time (US & Canada) Grading Summary These are the automatically computed results of your exam. Grades for essay questions, and comments from your instructor, are in the "Details" section below. Date Taken: 10/10/2012 Time Spent: 14 secs Points Received: 20 / 20 (100%) Question Type: # Of Questions: # Correct: True/False 10 10 Grade Details - All Questions 1. Question : In a goodness-of-fit test, the sum of the expected frequencies need not equal the sum of the observed frequencies. True False 2. Question : Nonparametric tests require no assumptions about the shape of the population distribution. True False 3. Question : In a goodness-of-fit test, the sum of the expected frequencies must equal the sum of the observed frequencies. True False 4. Question : Tests of hypotheses for nominal or ordinal levels of measurement are called nonparametric or distribution-free tests. True False 5. Question : The chi-square distribution is positively skewed. True False 6. Question : The chi-square test statistic used in a goodness-of-fit test has k–1 degrees of freedom. True False 7. Question : The chi-square goodness-of-fit test can be applied if there are equal or unequal expected frequencies. True False 8. Question : The shape of the chi-square distribution depends on the size of the sample. True False 9. Question : The chi-square goodness-of-fit test is appropriate for nominal and ordinal levels of data True False 10. Question : There is not one, but a family of chi-square distributions. There is a chi-square distribution for 1 degree of freedom, another for 2 degrees of freedom, another for 3 degrees of freedom, and so on. True False * Times are displayed in (GMT-06:00) Central Time (US & Canada) Grading Summary These are the automatically computed results of your exam. Grades for essay questions, and comments from your instructor, are in the "Details" section below. Date Taken: 10/10/2012 Time Spent: 08 min , 44 secs Points Received: 20 / 20 (100%) Question Type: # Of Questions: # Correct: Multiple Choice 10 10 Grade Details - All Questions 1. Question : What is the critical value at the 0.05 level of significance for a goodness-of-fit test if there are six categories? 3.841 5.991 7.815 11.070 2. Question : Which of the following are correct statements regarding the goodness-of-fit test? Data may be of nominal scale Population must be normal All the expected frequencies must be equal All of the above are true None of the above are true 3. Question : For any chi-square goodness-of-fit problem, the number of degrees of freedom is found by n – k – 1. k – 1. n + 1. n + k. 4. Question : The chi-square distribution is positively skewed. negatively skewed. normally distributed. negatively or positively skewed. 5. Question : Which of the following are correct statements regarding the chi-square distribution? Distribution is negatively skewed Chi-square is based on two sets of degrees of freedom, one for the numerator and one for the denominator Its shape is based on the degrees of freedom All of the above are true None of the above are true 6. Question : A question has these possible choices—excellent, very good, good, fair and unsatisfactory. How many degrees of freedom are there using the goodness-of-fit test to the sample results? 0 2 4 5 7. Question : What is our decision regarding the differences between the observed and expected frequencies if the critical value of chi-square is 9.488 and the computed value is 6.079? The difference is probably due to sampling error; do not reject the null hypothesis Not due to chance; reject the null hypothesis Not due to chance; do not reject the alternate hypothesis Too close; reserve judgment 8. Question : The chi-square distribution can assume only positive values. only negative values. negative and positive values or zero. only zero. 9. Question : Which of the following assumptions is necessary to apply a nonparametric test of hypothesis using the chi-square distribution? Normal population is required Interval scale of measurement is required Population variance must be known Both "a" and "c" None of the above 10. Question : The chi-square distribution becomes more symmetrical as number of variables increase. the chi-square value increases. degrees of freedom decrease. degrees of freedom increase. * Times are displayed in (GMT-06:00) Central Time (US & Canada) [Show More]
Last updated: 1 year ago
Preview 1 out of 91 pages
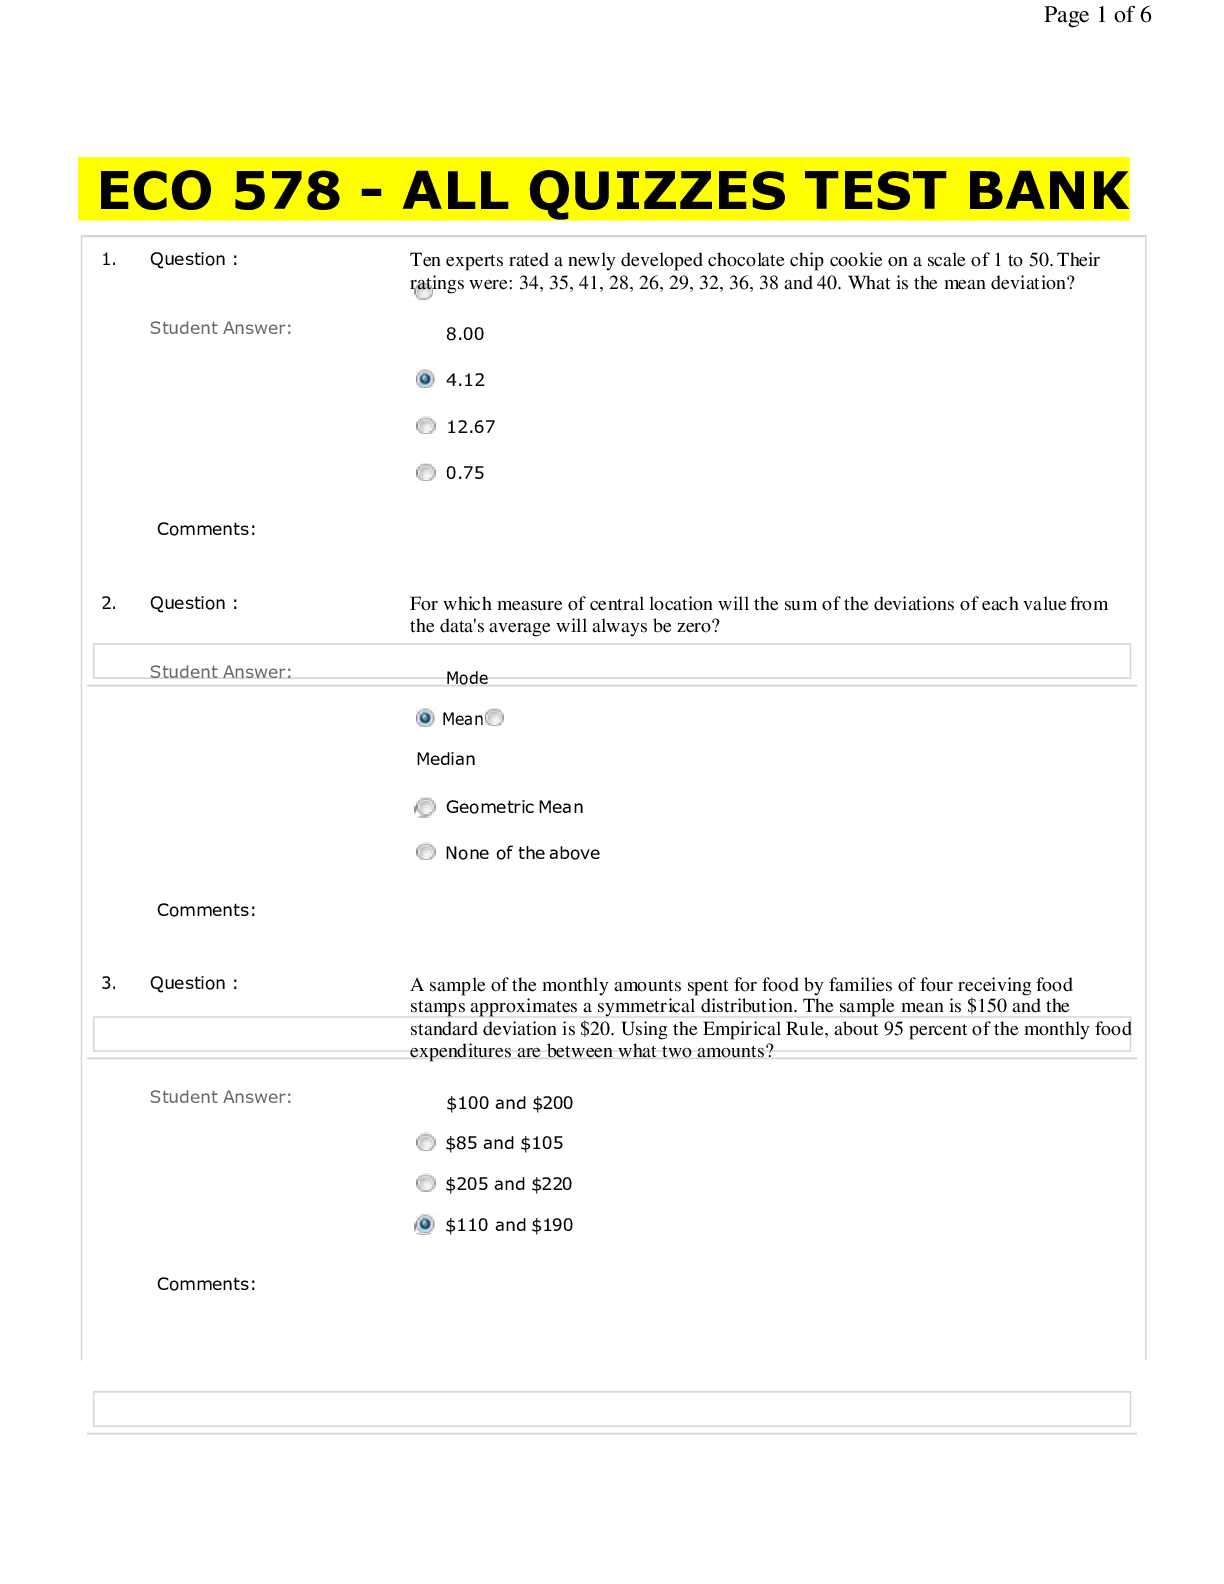
Reviews( 0 )
Recommended For You
*NURSING> STUDY GUIDE > NUR 590B / NUR 102 - Medical Surgical Nursing 7th > Test Bank : Chapter 1 to Chapter 67 - All Chapters Multiple Choice Exams Guides (2019/20) -University of Phoenix (All)
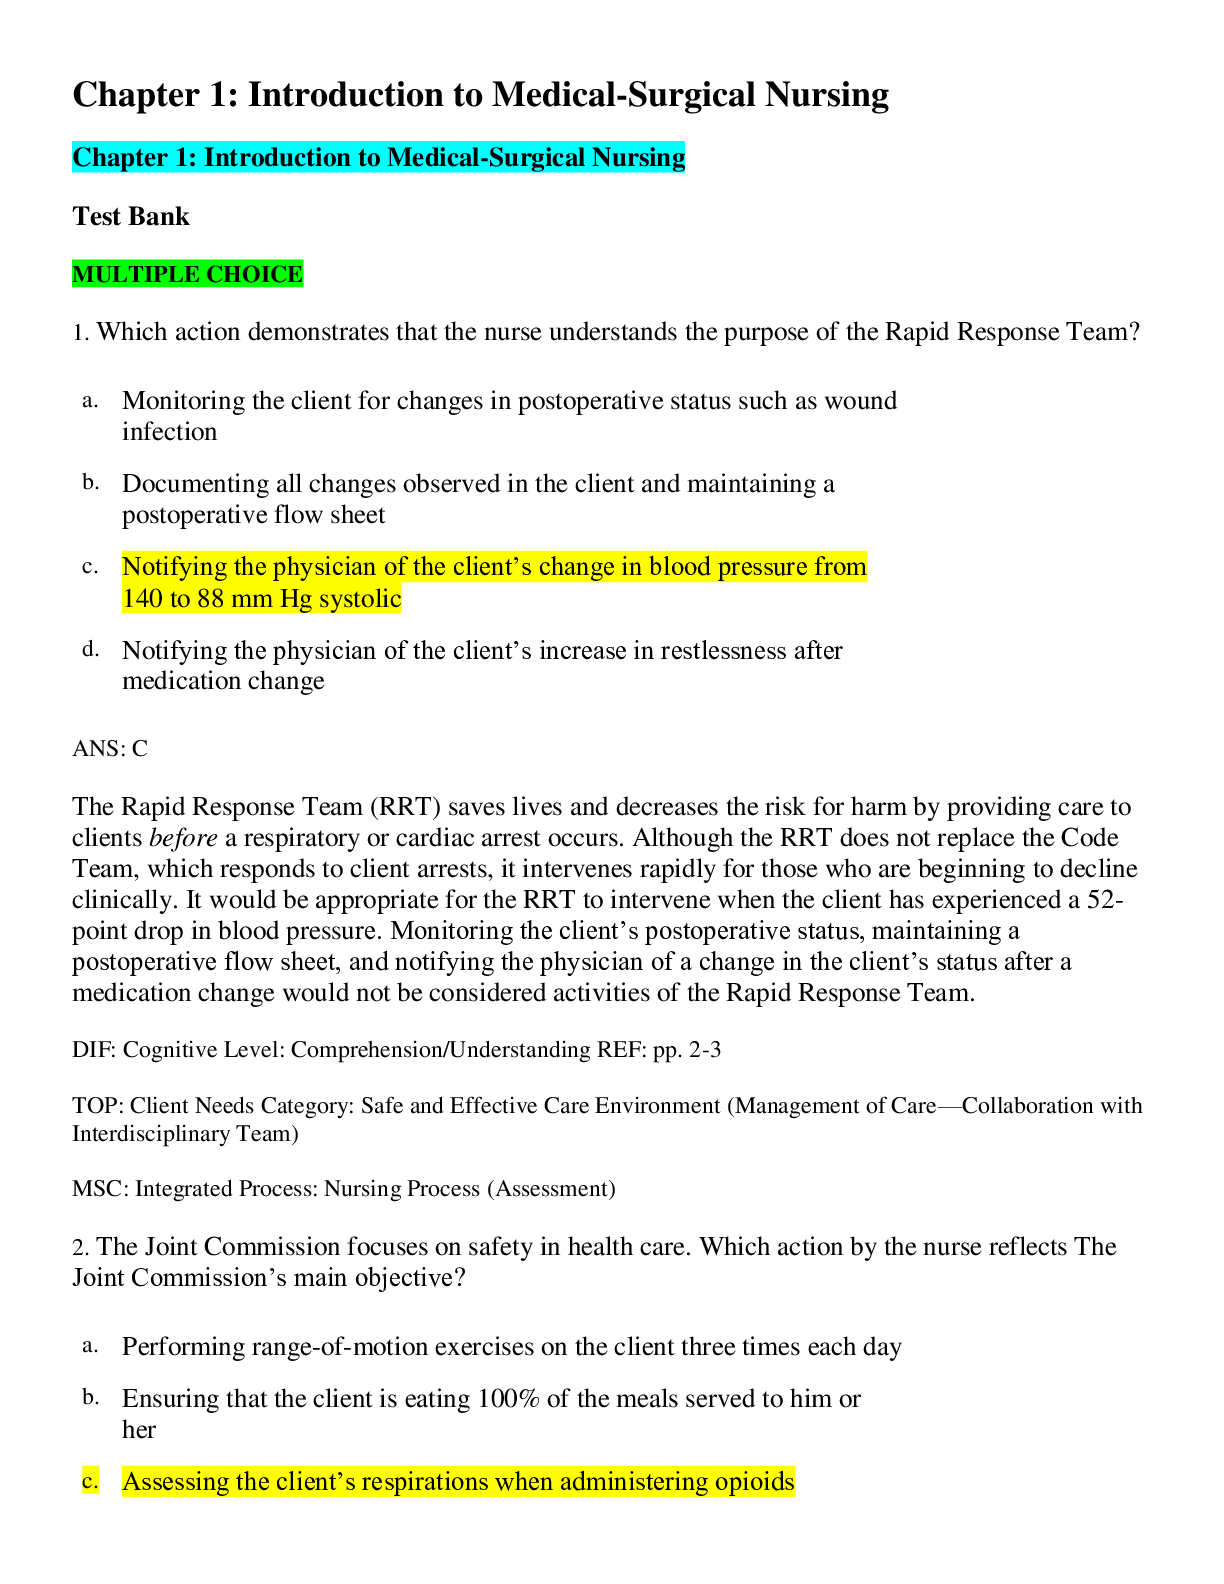
NUR 590B / NUR 102 - Medical Surgical Nursing 7th > Test Bank : Chapter 1 to Chapter 67 - All Chapters Multiple Choice Exams Guides (2019/20) -University of Phoenix
University of Phoenix - NURSING NUR/590B Medical surgical nursing 7th NUR 102 / NR 601 / NUR255 TEST BANK Chapter 1: Introduction to Medical-Surgical Nursing - TO -Chapter 67: Care of Patients with Di...
By Expert#1 , Uploaded: Nov 08, 2019
$24
*NURSING> STUDY GUIDE > ATI Med-Surg Proctored Exam already Graded A. (All)
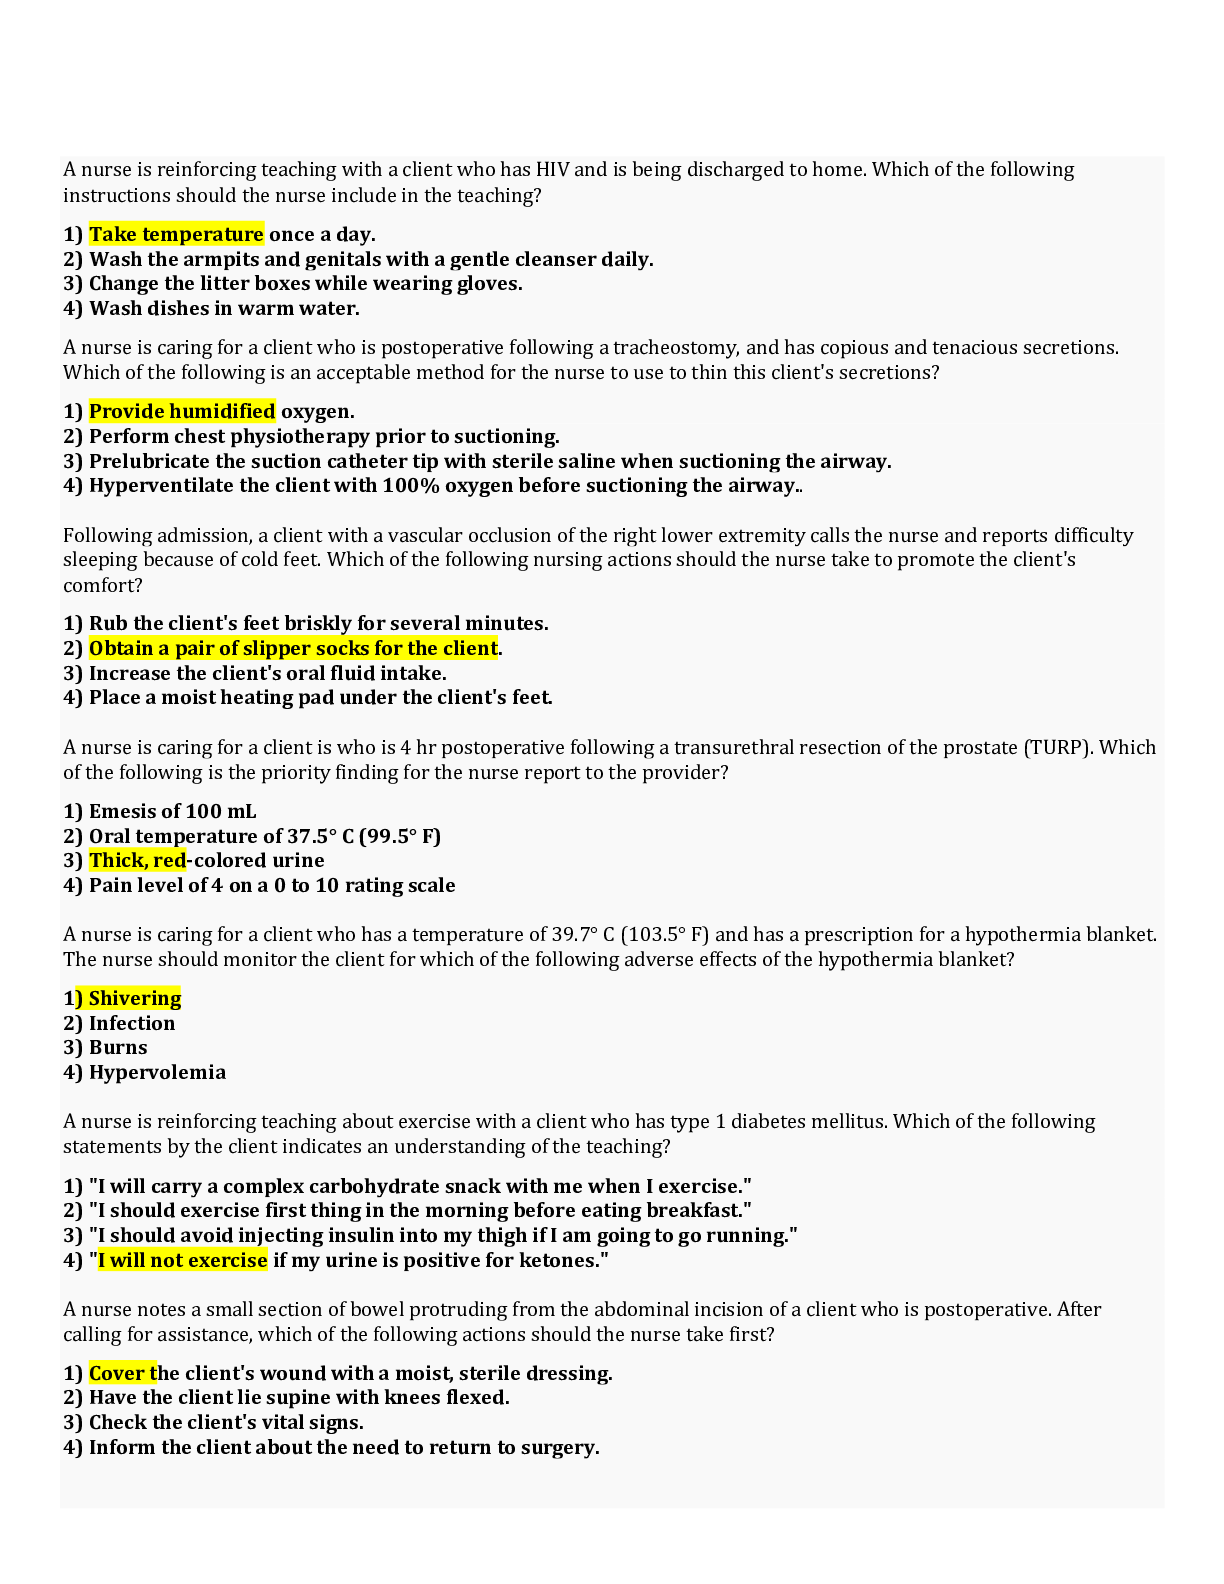
ATI Med-Surg Proctored Exam already Graded A.
A nurse is reinforcing teaching with a client who has HIV and is being discharged to home. Which of the following instructions should the nurse include in the teaching? 1) Take temperature once a da...
By Academia1434 , Uploaded: Jan 15, 2021
$13
*NURSING> STUDY GUIDE > NUR 254 Exam 2 Study Guide (100% Accurate ). (All)
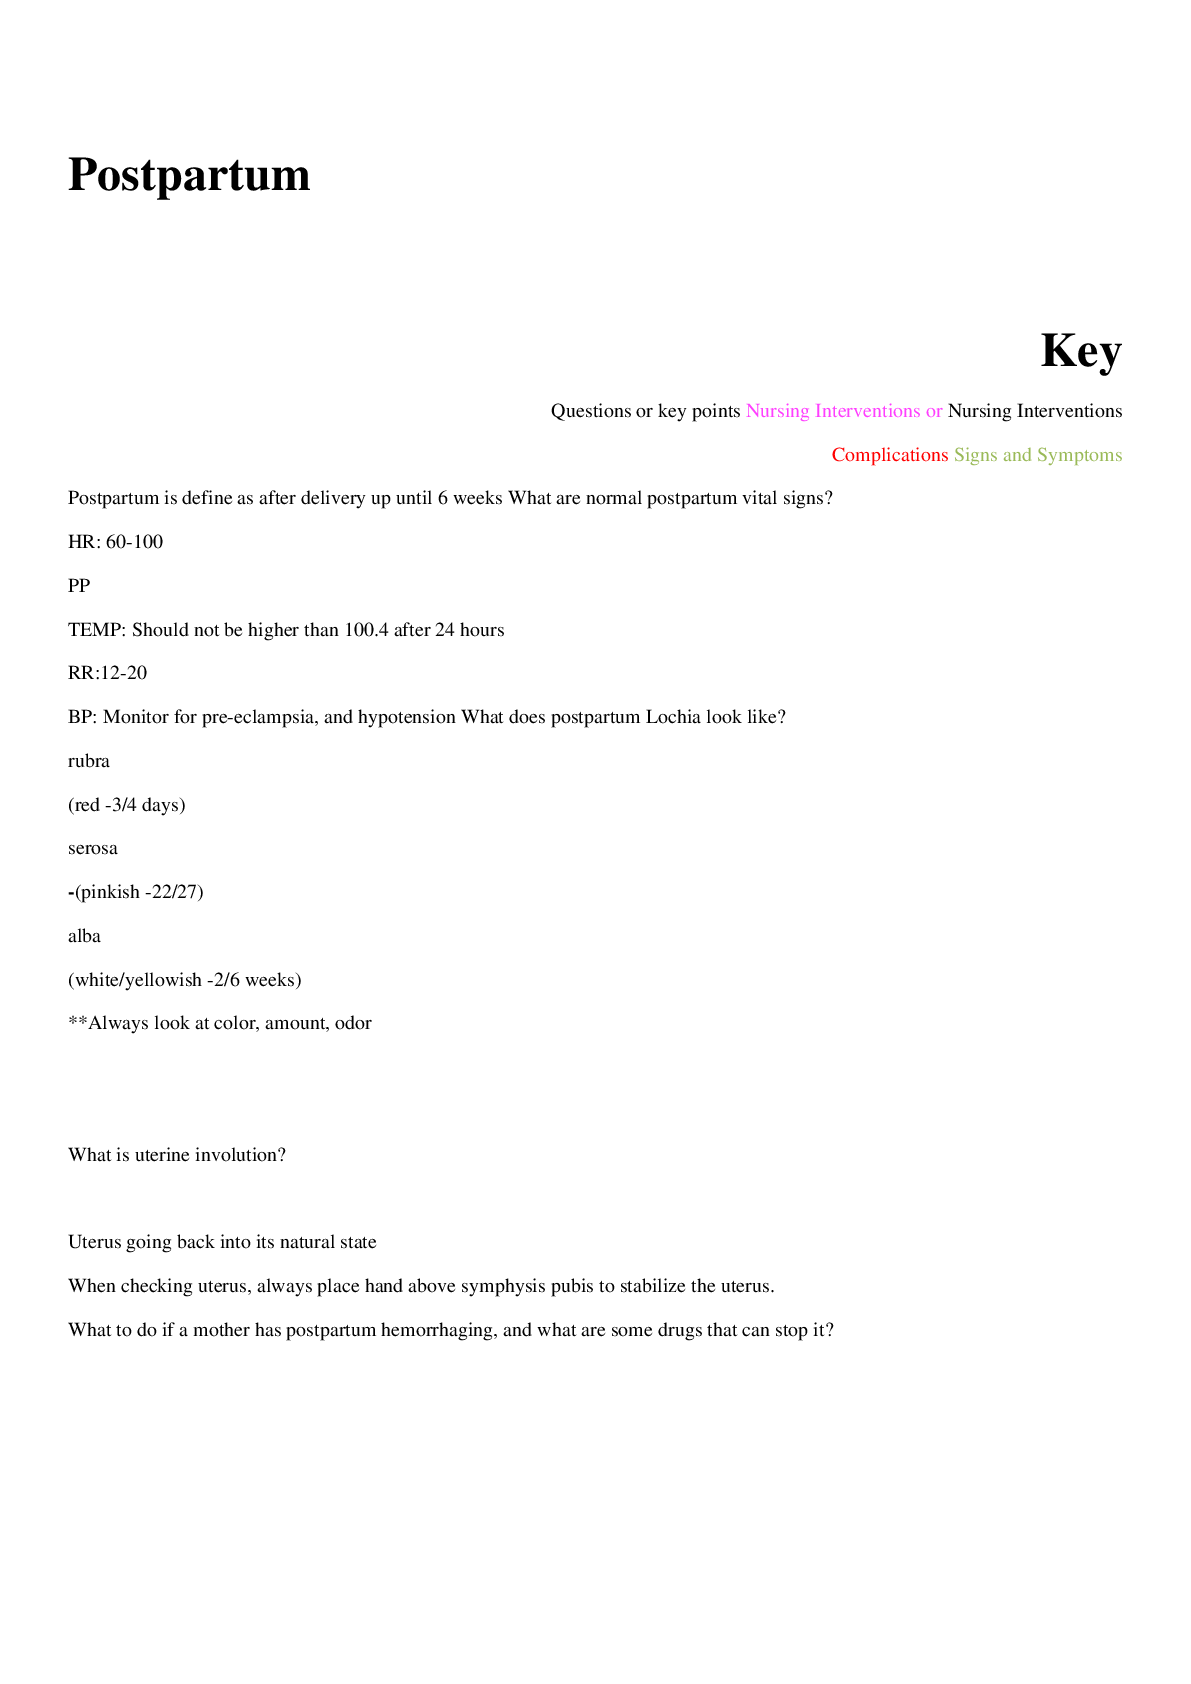
NUR 254 Exam 2 Study Guide (100% Accurate ).
NUR 254 (NUR254 EXAM2 STUDY GUIDE)/NUR 254 - Exam 2 Study Guide (100% Accurate ).
By Solution101 , Uploaded: Mar 11, 2021
$12
*NURSING> STUDY GUIDE > NR 533 Financial Management In Healthcare Organizations, Week 5 Assignment Break-Even Analysis (All)
NR 533 Financial Management In Healthcare Organizations, Week 5 Assignment Break-Even Analysis
NR 533 Financial Management In Healthcare Organizations, NR 533 Week 5 Assignment Break-Even Analysis
By TopScholar , Uploaded: Mar 15, 2021
$8
*NURSING> STUDY GUIDE > NR 511Midterm Exam Study Guide Chamberlain College of Nursing - (All)
NR 511Midterm Exam Study Guide Chamberlain College of Nursing -
NR511 Midterm Exam Study Guide Week 1 1. Define diagnostic reasoning: type of critical thinking Critical thinking involves the process of questioning one’s thinking to determine if all possible...
By Muchiri , Uploaded: Mar 12, 2021
$11
Finance> STUDY GUIDE > FINANCE 238 Oxford College of Commerce, Lahore - rev test. (All)
FINANCE 238 Oxford College of Commerce, Lahore - rev test.
I recently visited Kennedy's Orbiter Processing Facility to find out how a highly skilled team of shuttle technicians spent the past few months preparing Endeavour for STS-126. (upbeat music) I'm...
By Muchiri , Uploaded: Mar 17, 2021
$7
*NURSING> STUDY GUIDE > NR 222 / NR222 Health and Wellness Exam 1 Review Study Guide Chamberlain College (All)
NR 222 / NR222 Health and Wellness Exam 1 Review Study Guide Chamberlain College
1. Nursing - the protection, promotion, and optimization of health and abilities; - prevention of illness and injury; - alleviation of suffering through the diagnosis and treatment of human resp...
By nurse_steph , Uploaded: Nov 14, 2020
$13
*NURSING> STUDY GUIDE > NUR 2488 - Exam 3 Key Concept Guide (All)
NUR 2488 - Exam 3 Key Concept Guide
Exam 3 Key Concept Guide (Modules 7, 8, & 9) Chapter 12 – Somatoform Disorders • Somatoform Disorders – highest priority nursing intervention (Table 12-2, 12-3 & 12-4) & secondary gains Treatme...
By Ajay25 , Uploaded: Jan 25, 2021
$10
*NURSING> STUDY GUIDE > NR 533 Financial Management In Healthcare Organizations Week 4 Staffing Budgets FTEs Variance Analysis Assignment Guidelines with Scoring Rubric2 (All)
NR 533 Financial Management In Healthcare Organizations Week 4 Staffing Budgets FTEs Variance Analysis Assignment Guidelines with Scoring Rubric2
NR 533 Financial Management In Healthcare Organizations Week 4 Staffing Budgets FTEs Variance Analysis Assignment Guidelines with Scoring Rubric2
By TopScholar , Uploaded: Mar 15, 2021
$11
*NURSING> STUDY GUIDE > NSG 5002 Week 1 Quiz / NSG5002 Week 1 Quiz (All)
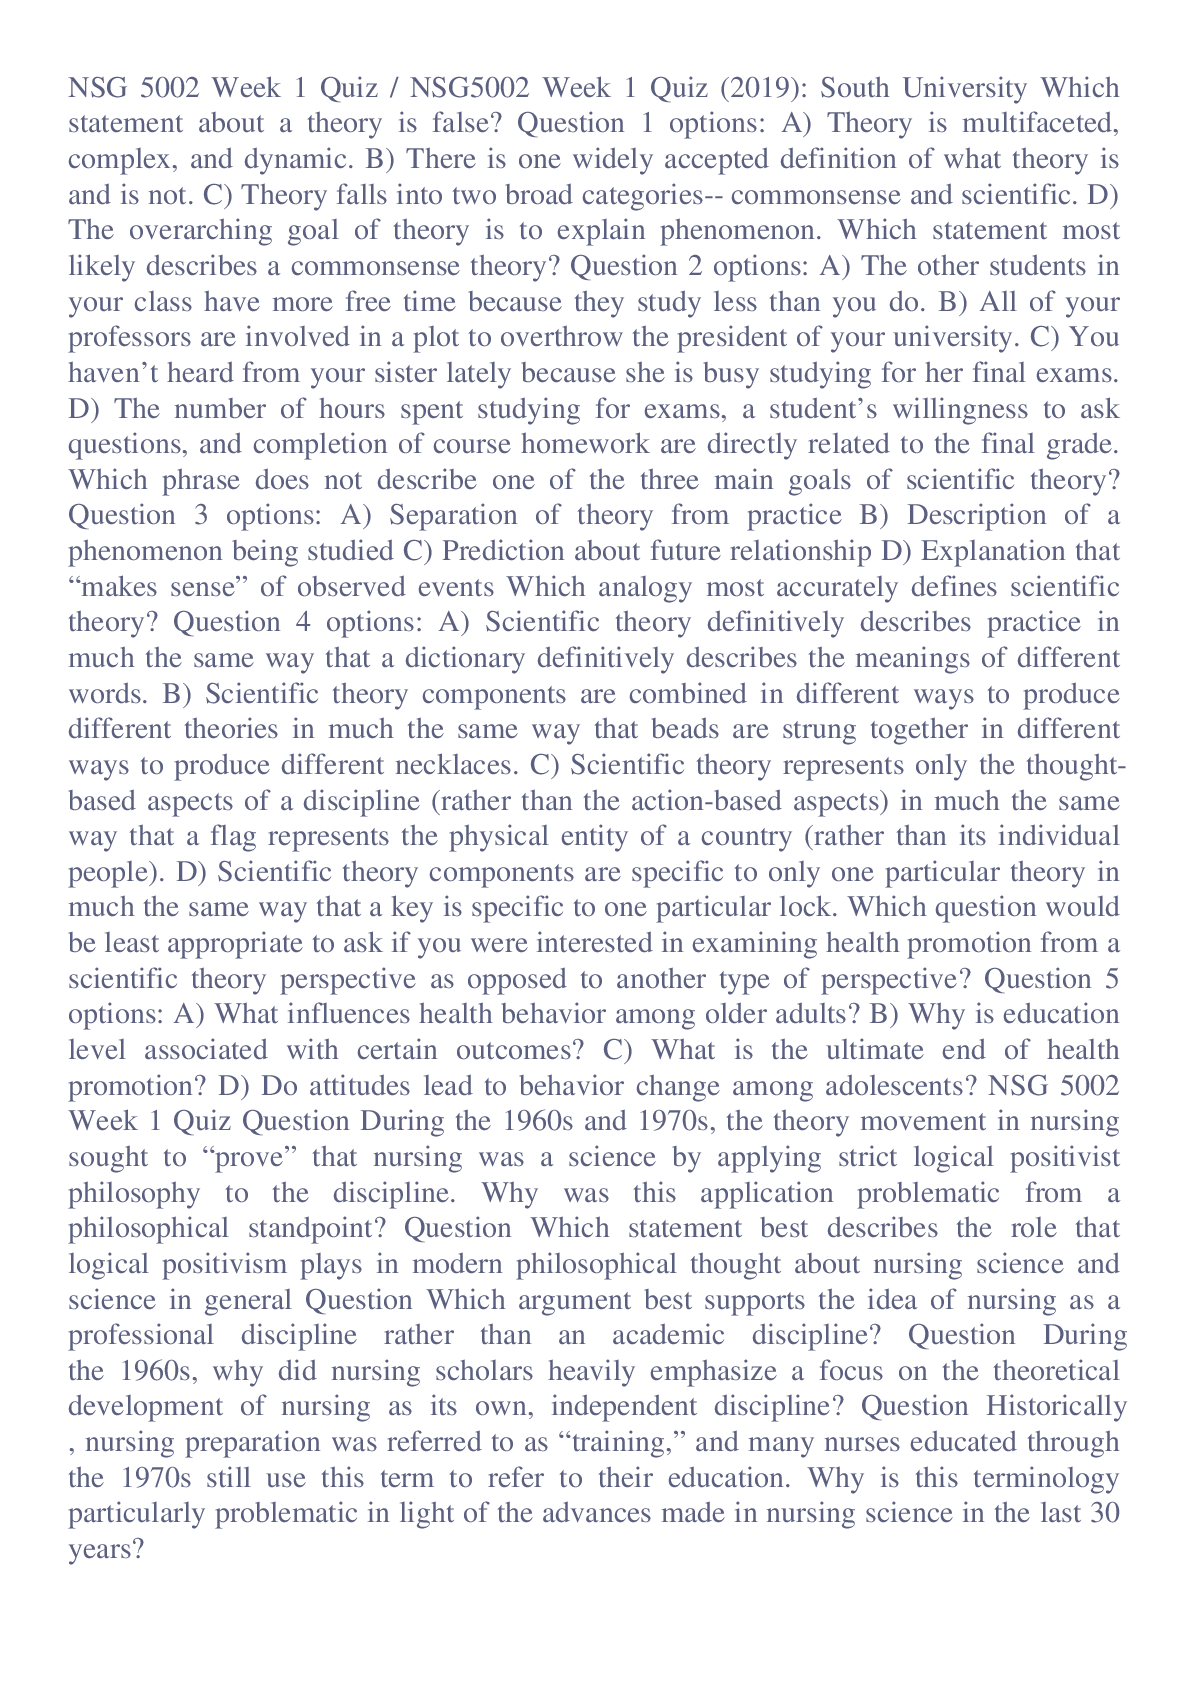
NSG 5002 Week 1 Quiz / NSG5002 Week 1 Quiz
Which statement about a theory is false? Question 1 options: A) Theory is multifaceted, complex, and dynamic. B) There is one widely accepted definition of what theory is and is not. C) Theory falls i...
By Academia1434 , Uploaded: May 30, 2020
$9
Document information
Connected school, study & course
About the document
Uploaded On
Mar 04, 2020
Number of pages
91
Written in

Additional information
This document has been written for:
Uploaded
Mar 04, 2020
Downloads
0
Views
145