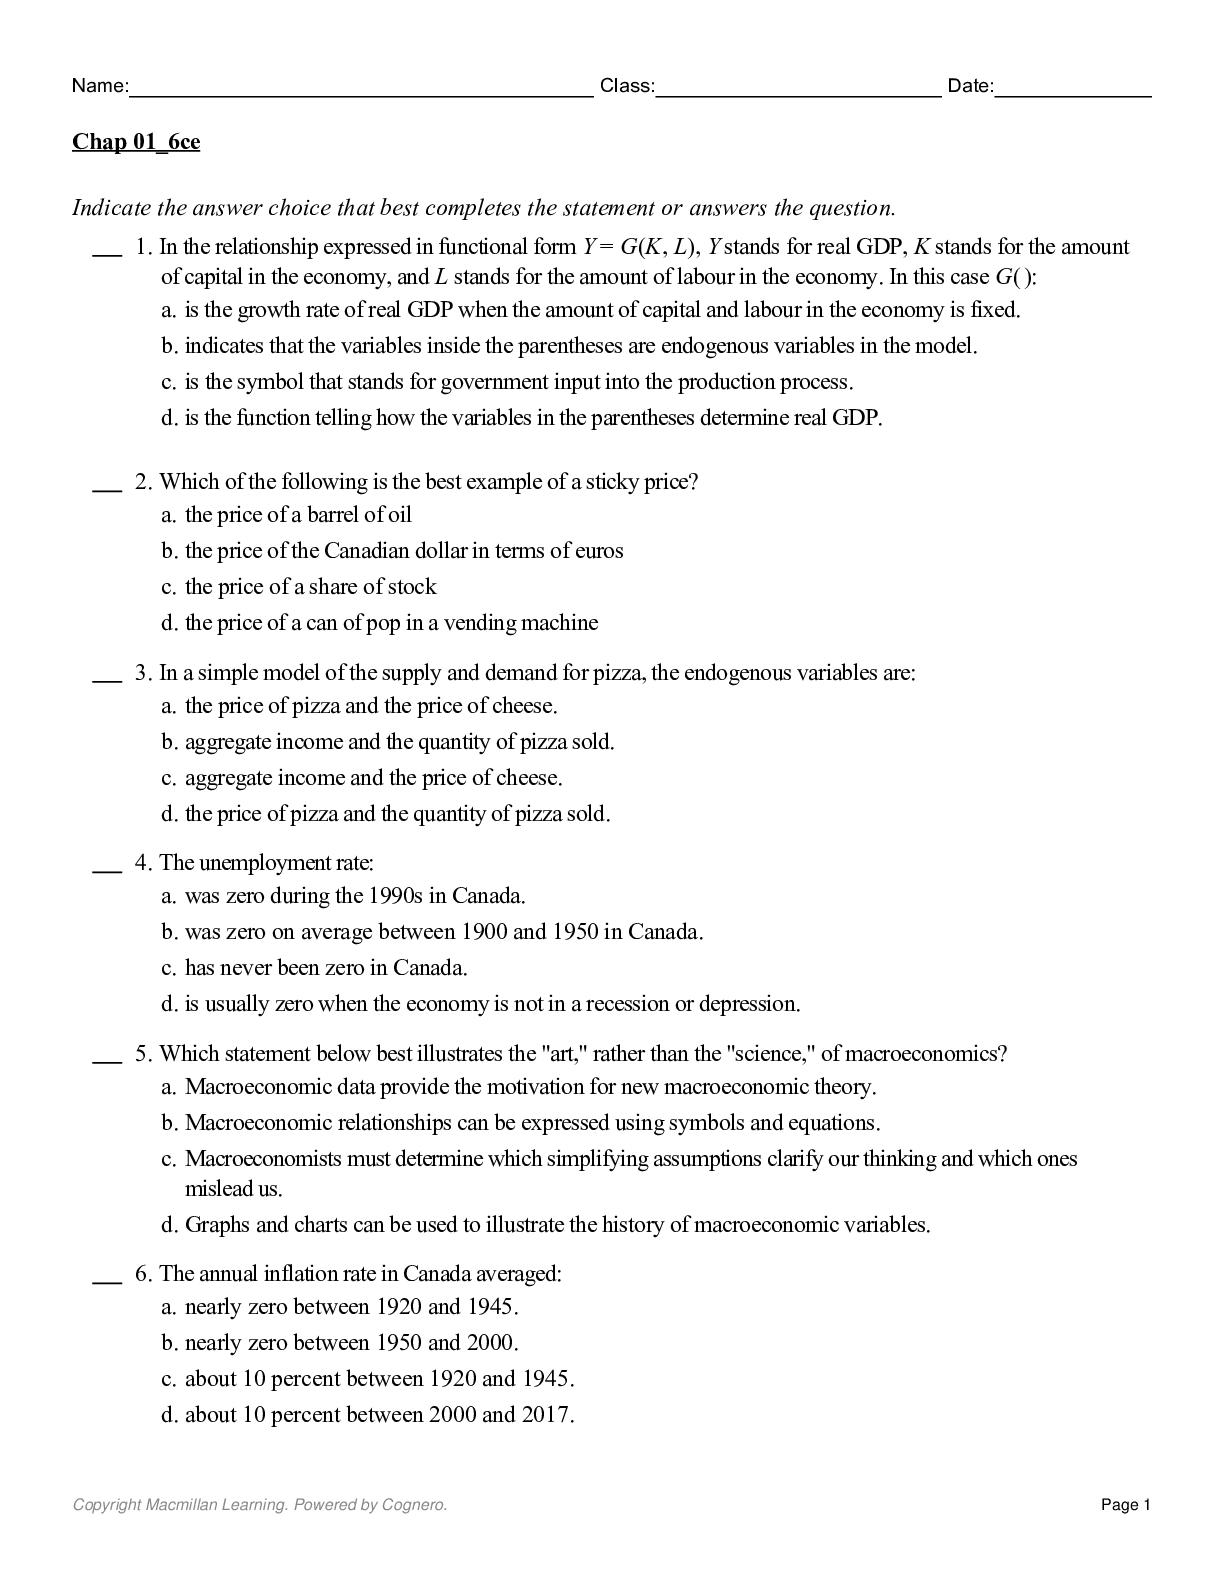
Database Management > TEST BANK > New Perspectives Microsoft® Office 365® & Excel® 2019 Comprehensive , 1st Edition by Carey TEST B (All)
New Perspectives Microsoft® Office 365® & Excel® 2019 Comprehensive , 1st Edition by Carey TEST BANK
Document Content and Description Below
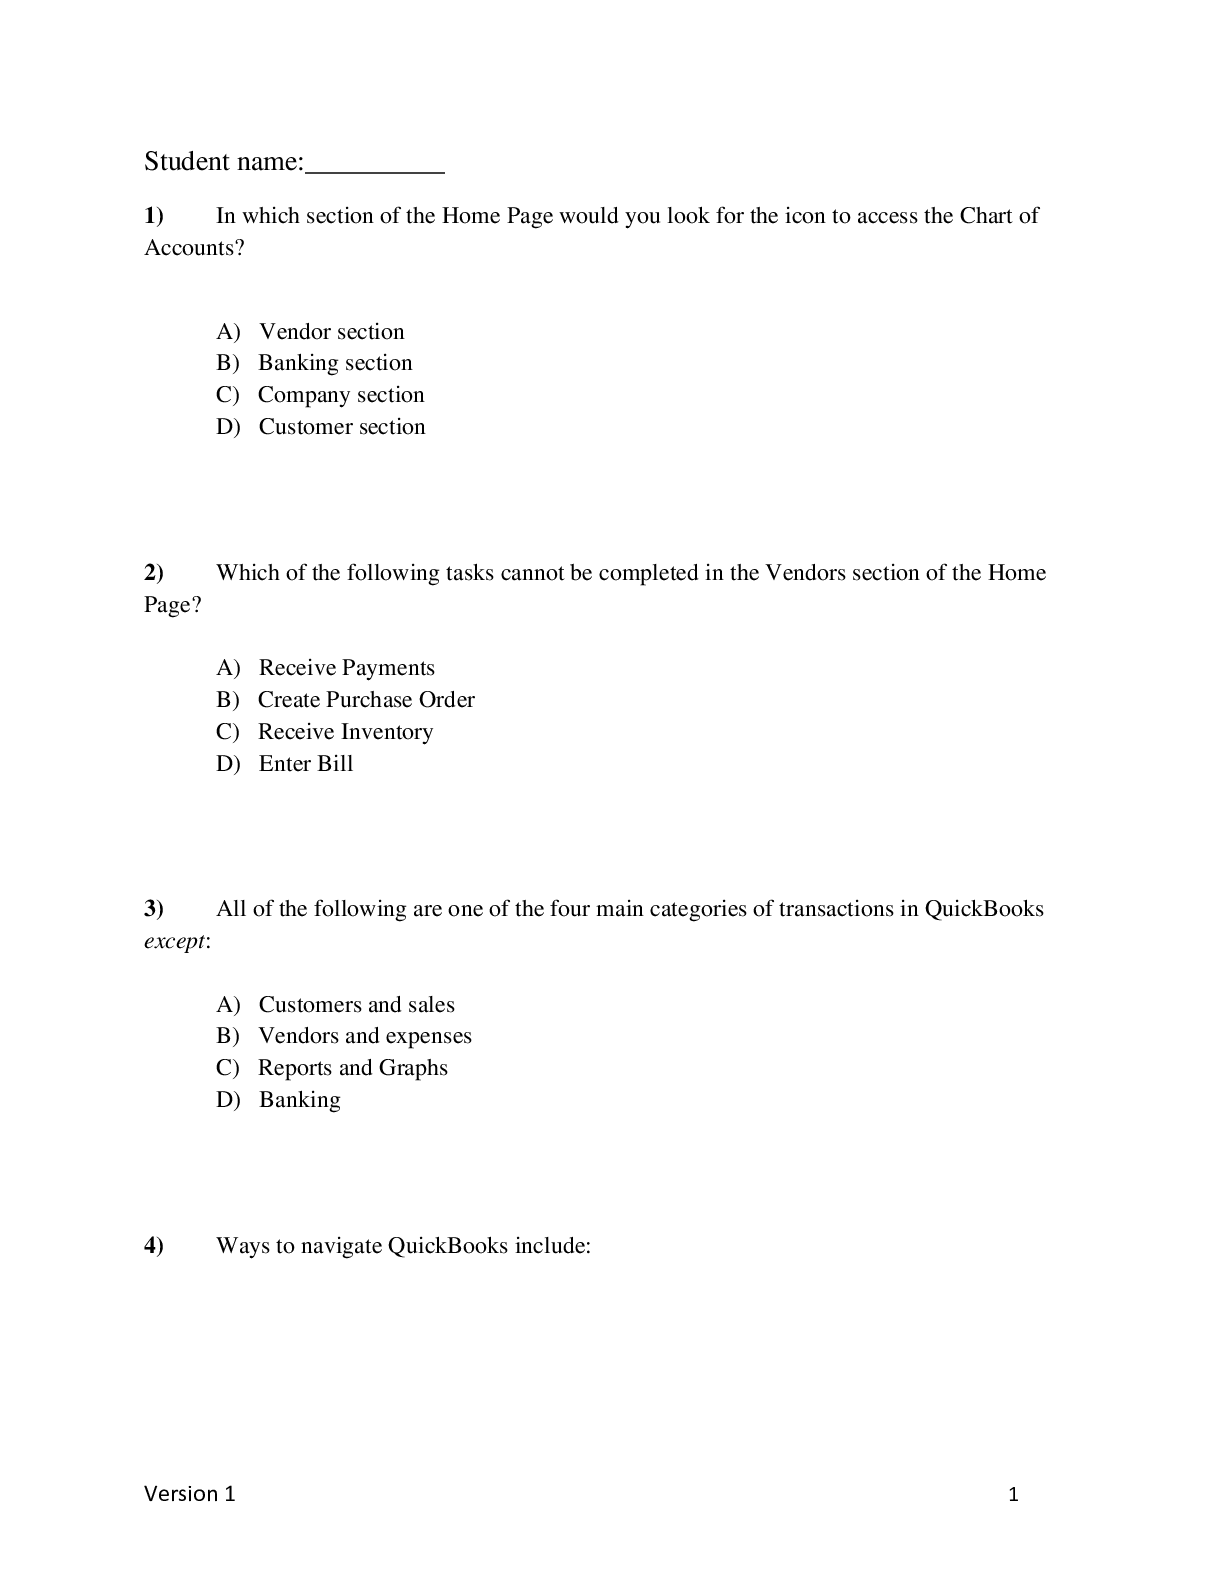
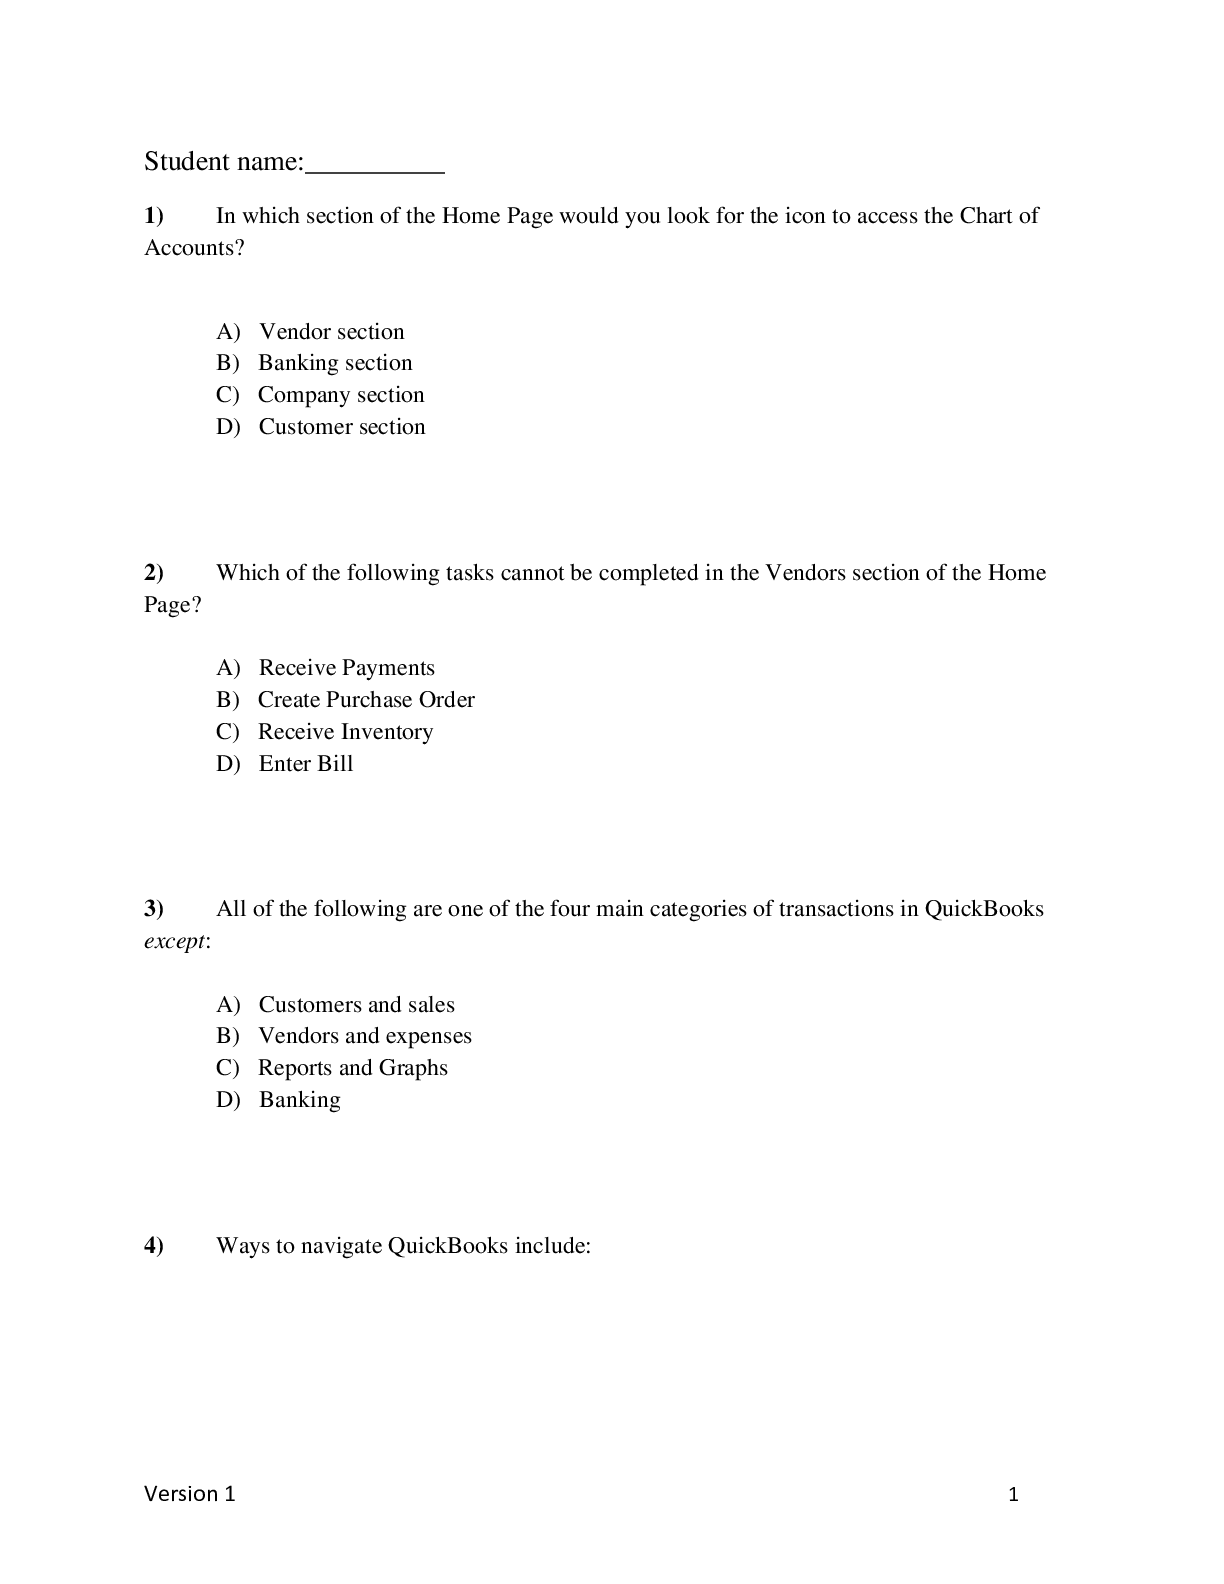
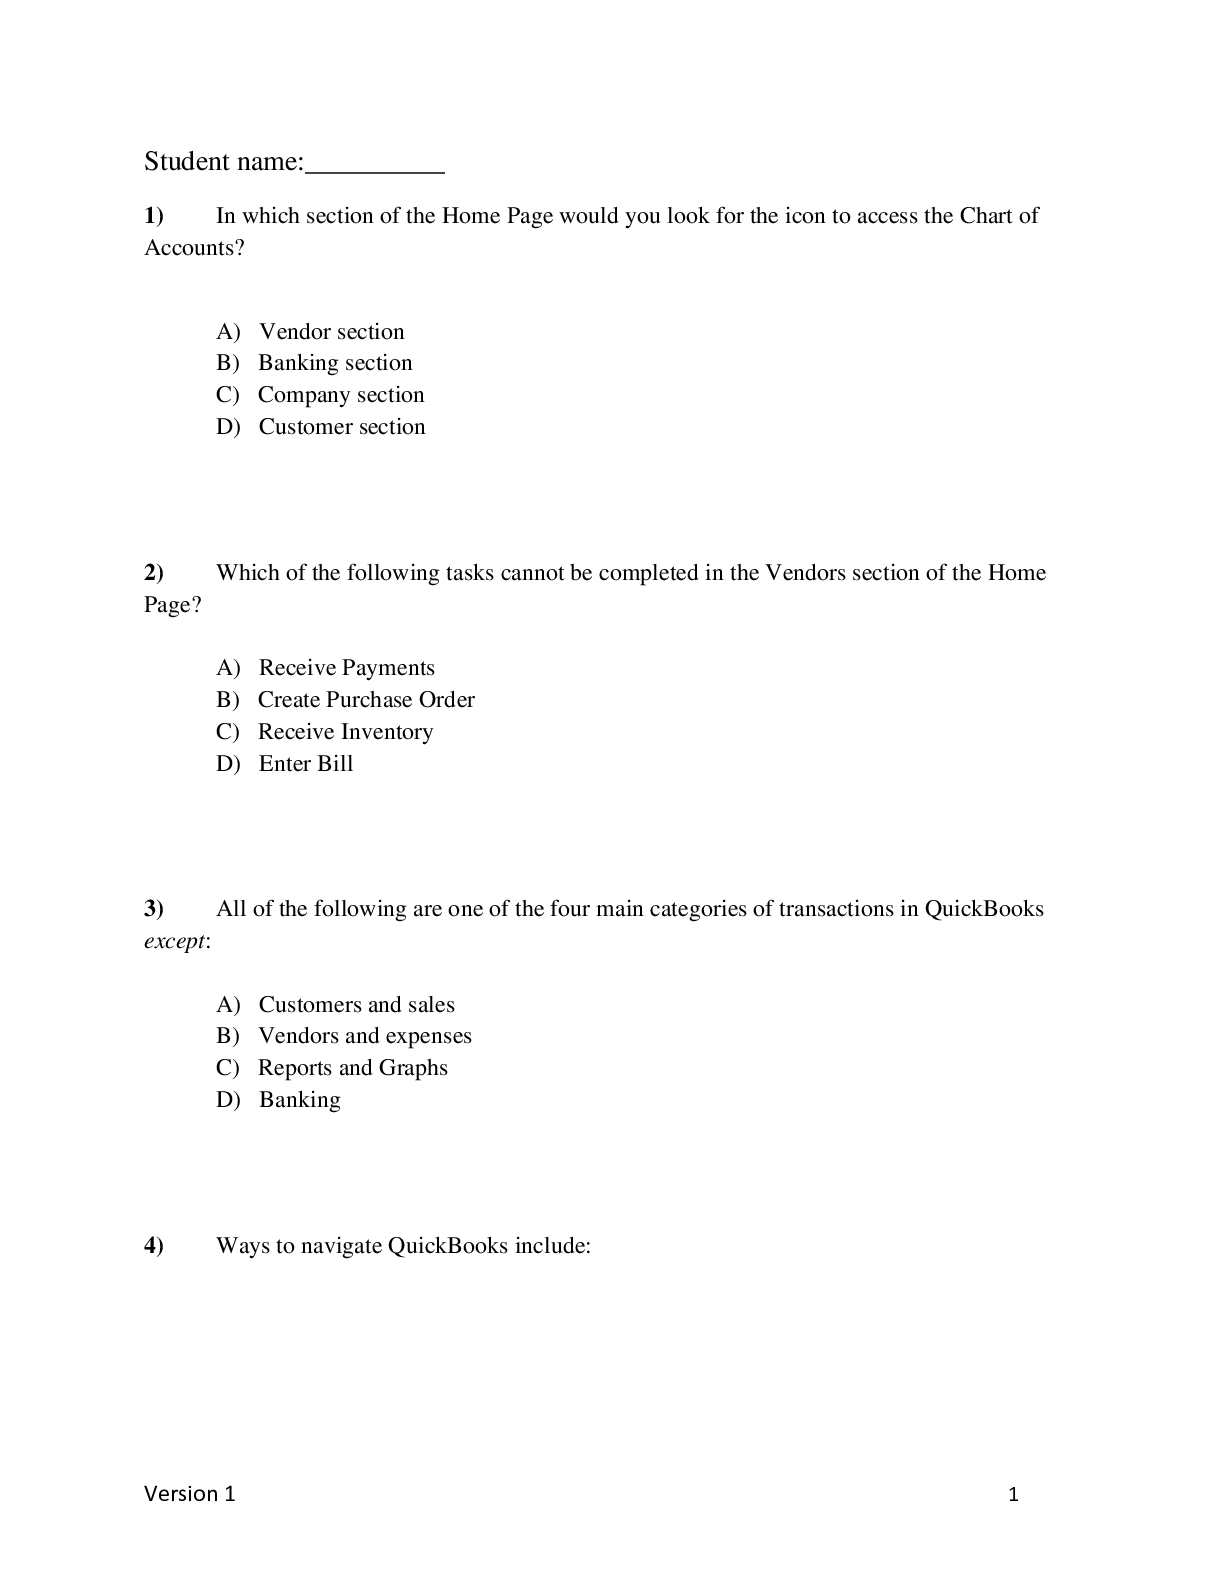
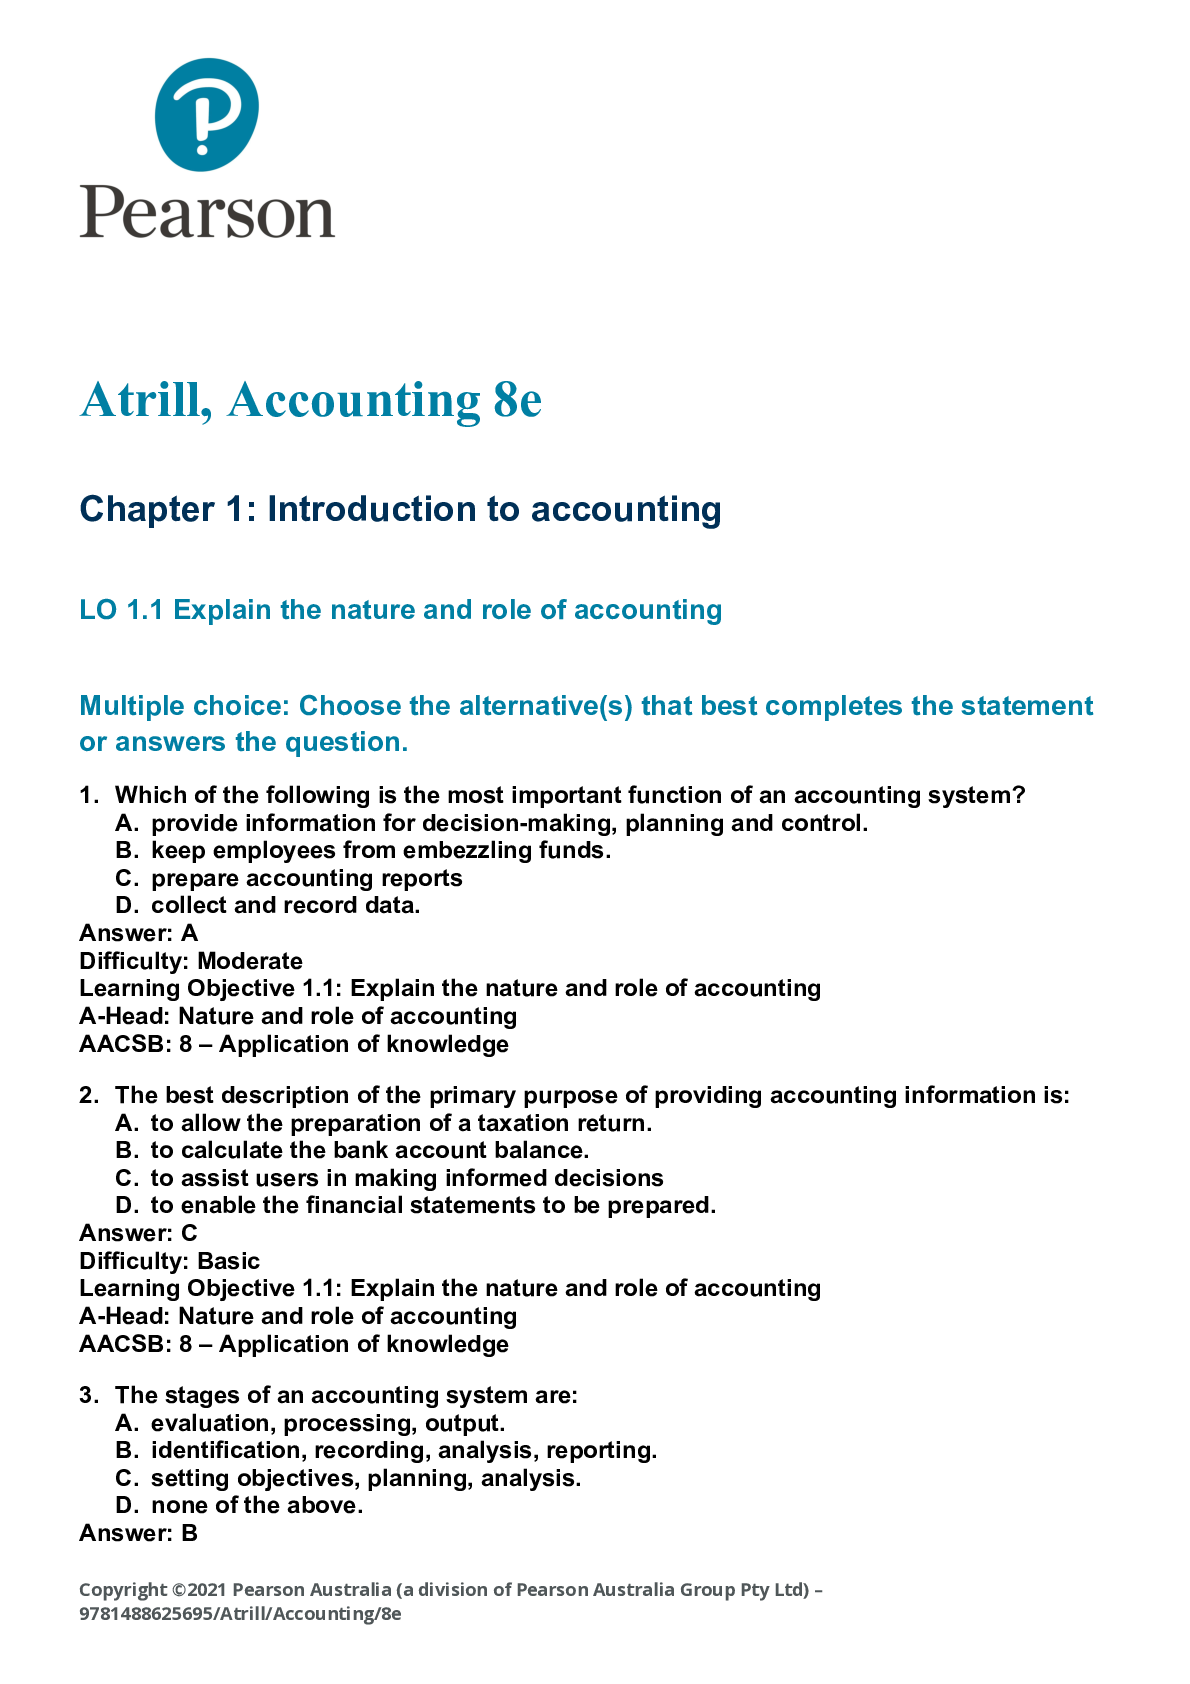
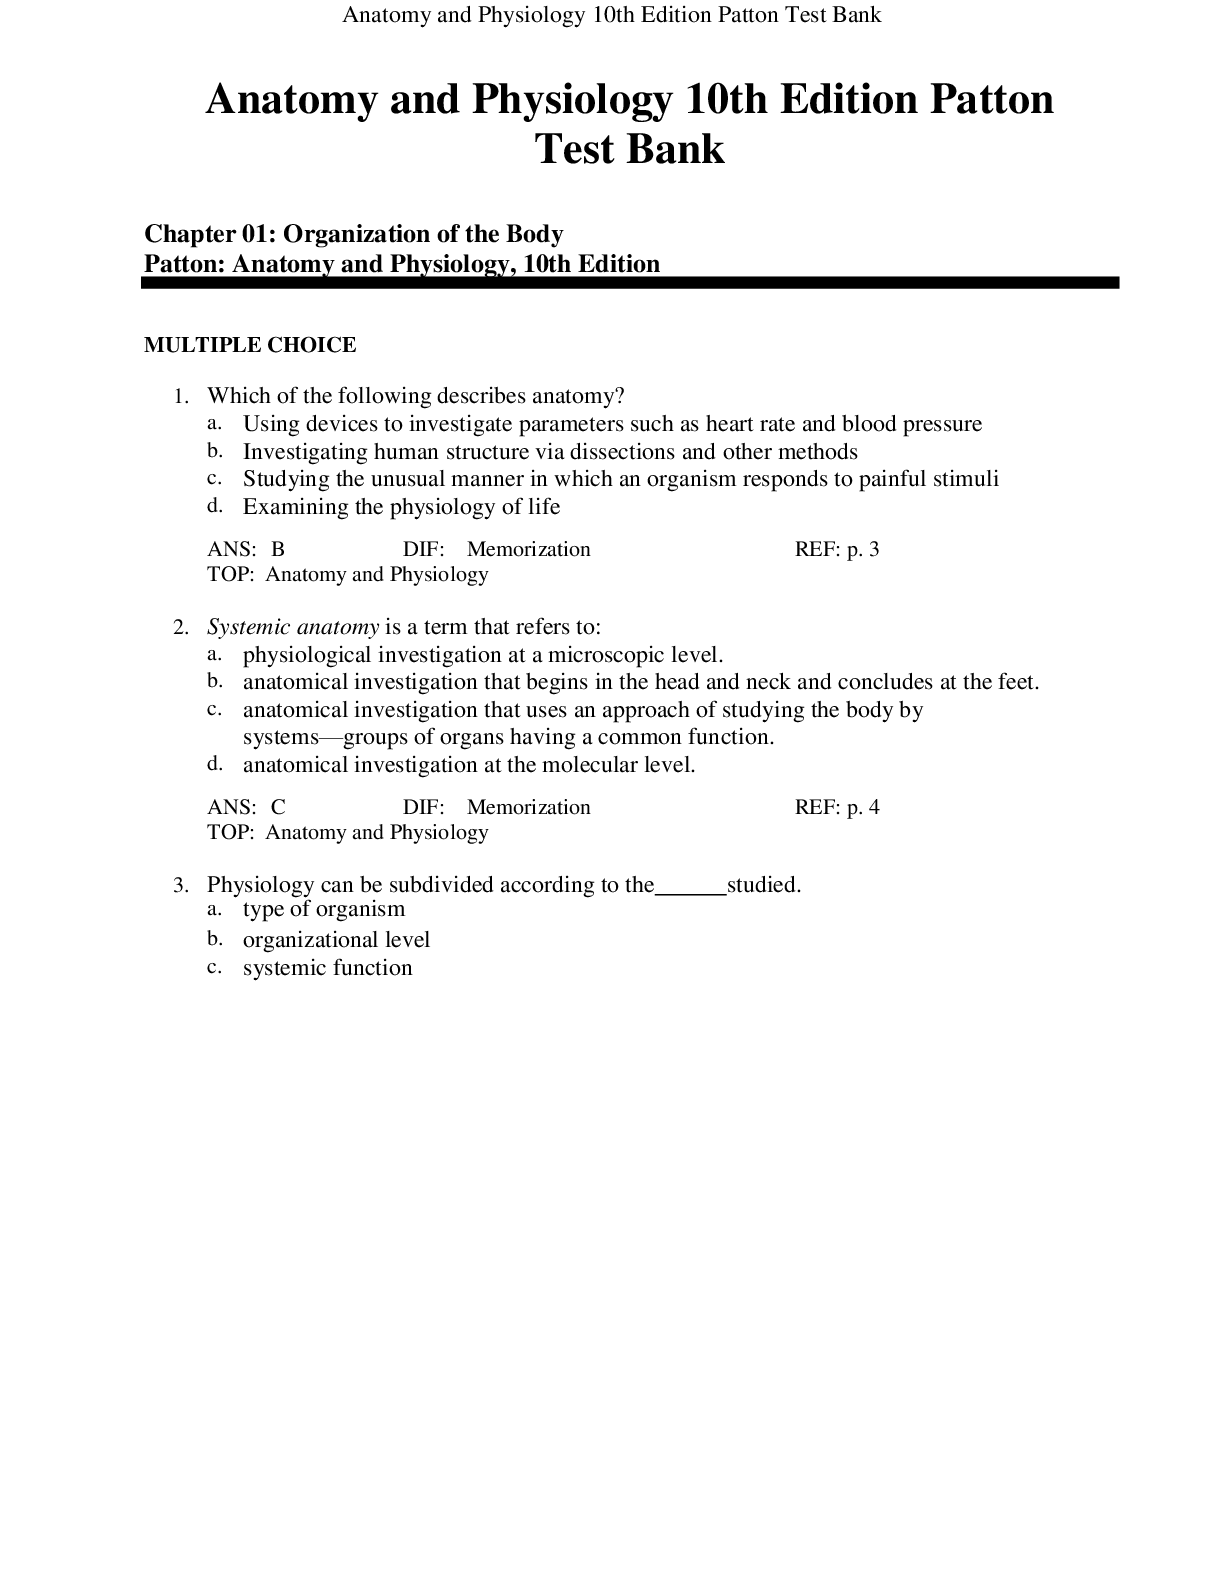
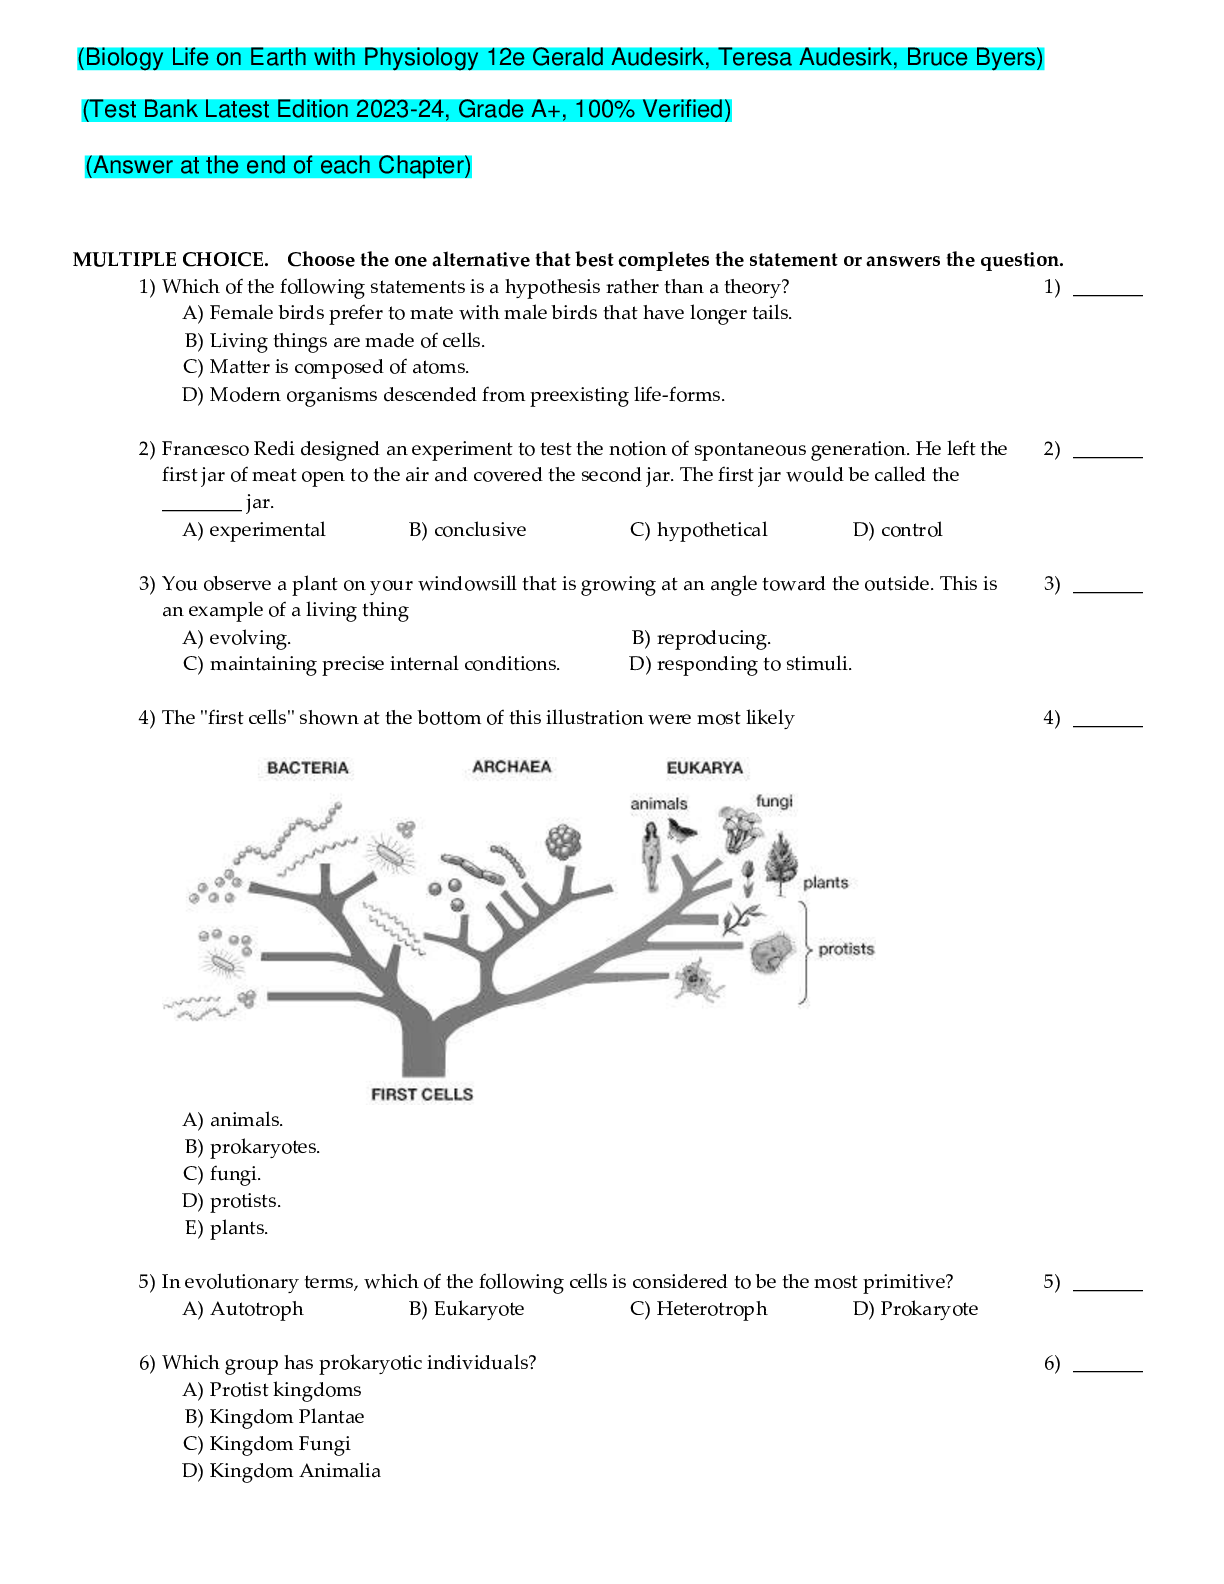
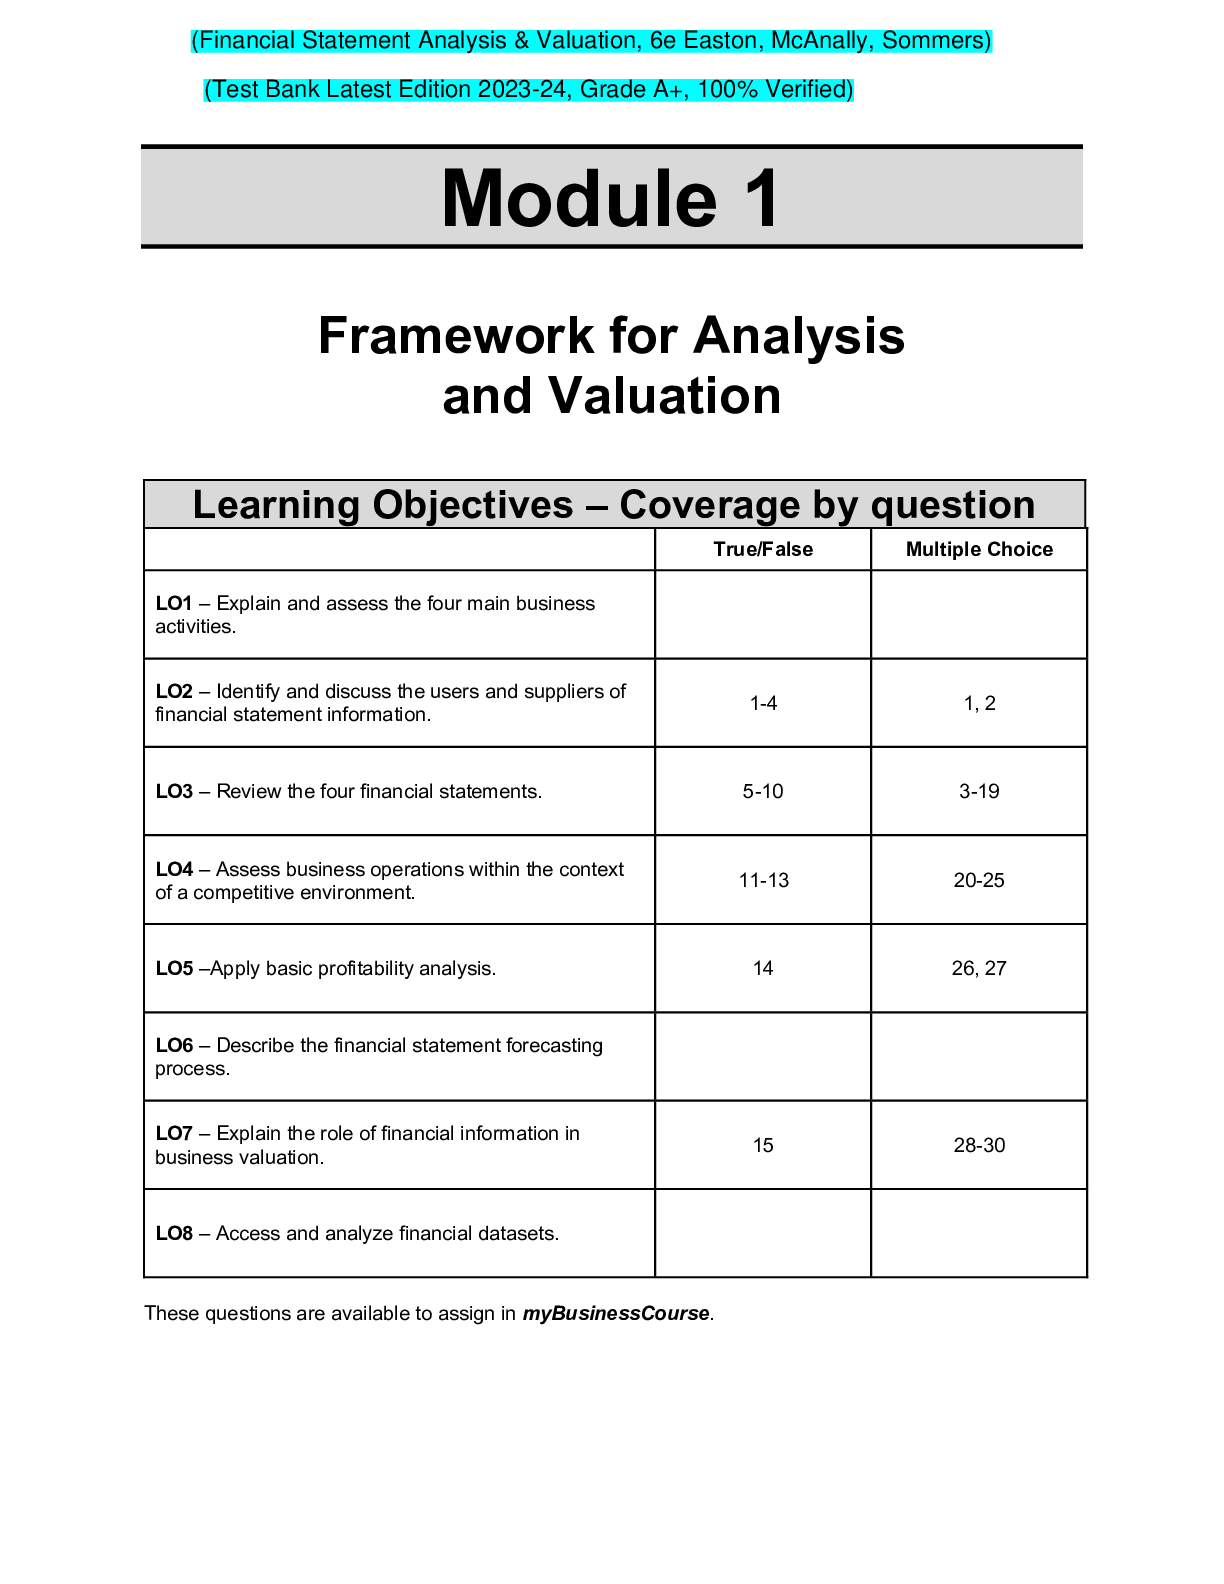
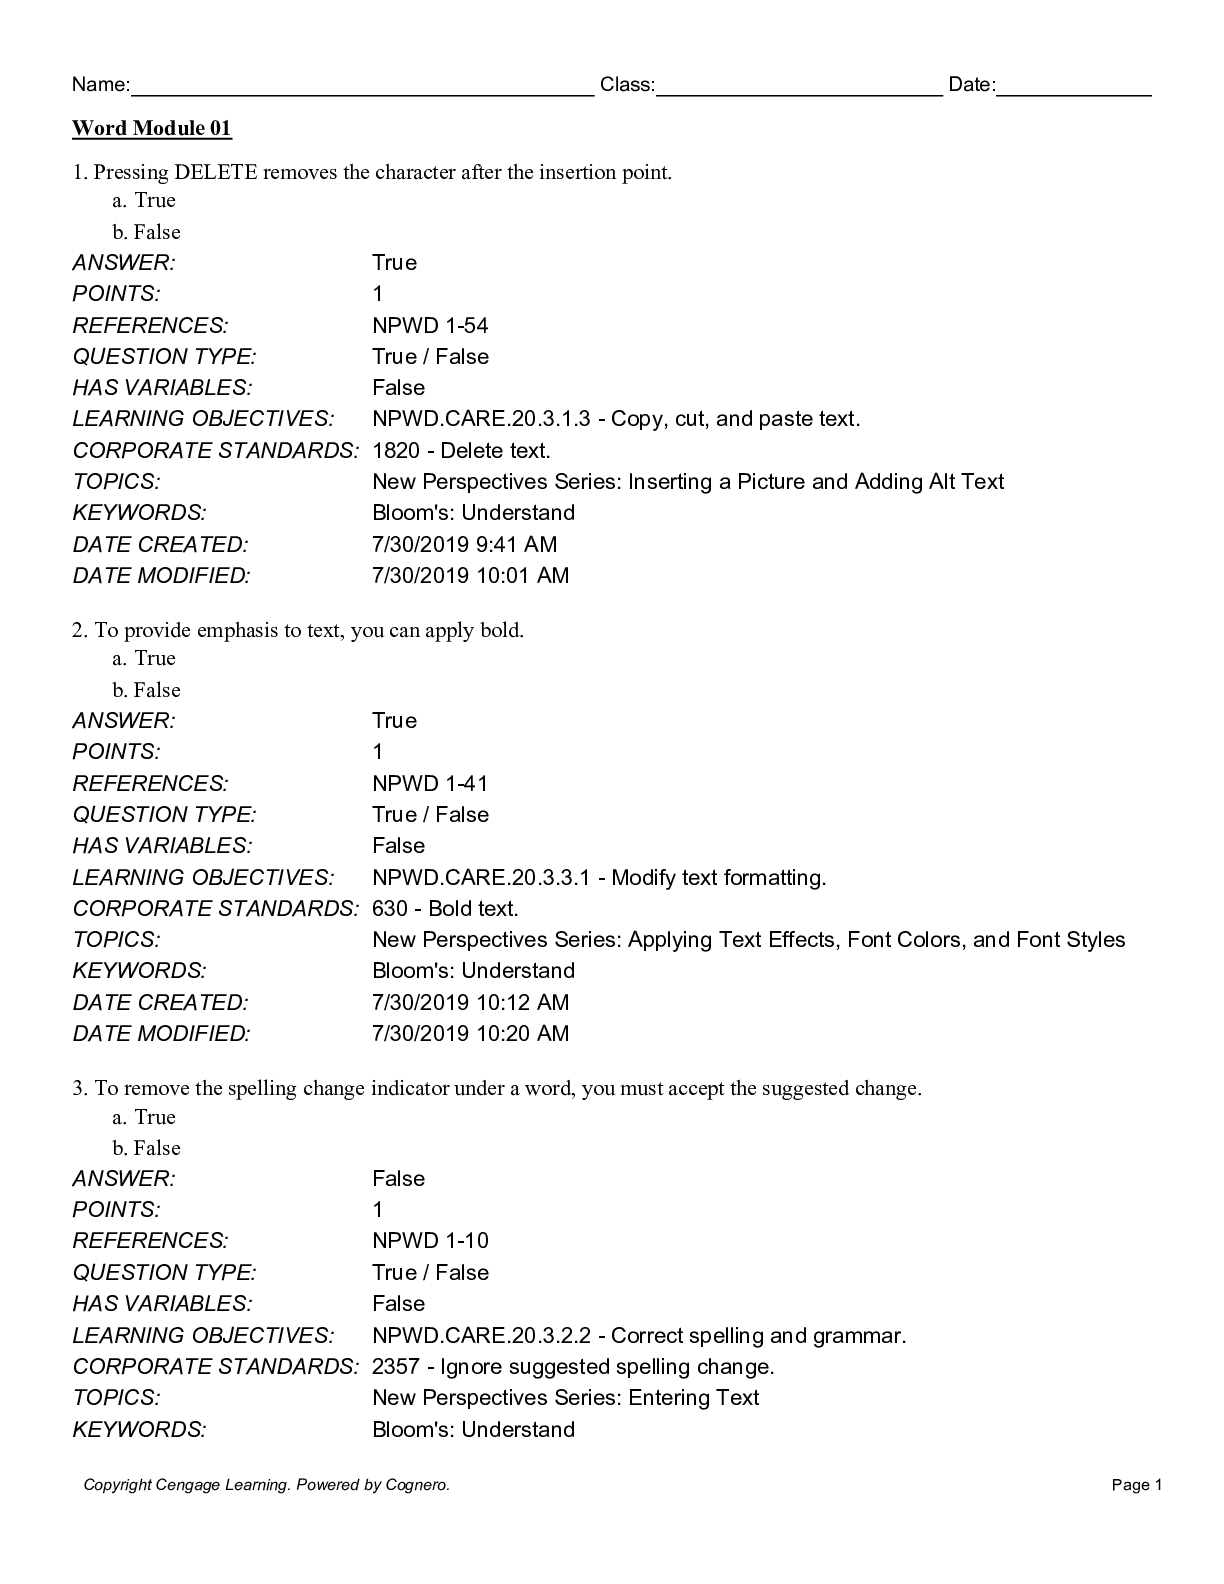
Test Bank for New Perspectives Microsoft® Office 365® & Excel® 2019 Comprehensive , 1st Edition, 1e by Patrick Carey TEST BANK ISBN-13: 9780357025765 Full chapters included Module 1: Getting S... tarted with Excel Session 1.1 Visual Overview: The Excel Workbook Introducing Excel and Spreadsheets Exploring a Workbook Closing a Workbook Planning a Workbook Starting a New Workbook Entering Text, Dates, and Numbers Resizing Columns and Rows Session 1.1 Quick Check Session 1.2 Visual Overview: Excel Formulas and Functions Calculating with Formulas Calculating with Functions Modifying a Worksheet Using the COUNT Function Modifying Rows and Columns Using Flash Fill Formatting a Worksheet Printing a Workbook Viewing Worksheet Formulas Session 1.2 Quick Check Module 2: Formatting Workbook Text and Data Session 2.1 Visual Overview: Formatting a Worksheet Formatting Cell Text Working with Fill Colors and Backgrounds Using Functions and Formulas with Sales Data Formatting Numbers Formatting Worksheet Cells Exploring the Format Cells Dialog Box Session 2.1 Quick Check Session 2.2 Visual Overview: Designing a Printout Calculating Averages Applying Cell Styles Copying and Pasting Formats Finding and Replacing Text and Formats Working with Themes Highlighting Data with Conditional Formats Formatting a Worksheet for Printing Session 2.2 Quick Check Module 3: Performing Calculations with Formulas and Functions Session 3.1 Visual Overview: Formulas and Functions Designing a Workbook for Calculations Calculating with Dates and Times AutoFilling Formulas and Data Patterns Applying Excel Functions Interpreting Error Values Session 3.1 Quick Check Session 3.2 Visual Overview: Lookup Tables and Logical Functions Calculating Running Totals with the Quick Analysis Tool Exploring Cell References Working with the IF Logical Function Formatting Input, Calculated, and Output Values Looking Up Data Performing What-If Analyses with Formulas and Functions Session 3.2 Quick Check Module 4: Analyzing and Charting FinancialData Session 4.1 Visual Overview: Chart Elements Getting Started with Excel Charts Creating a Pie Chart Working with Chart Elements Performing What-If Analyses with Charts Creating a Column Chart Creating a Line Chart Creating a Combination Chart Session 4.1 Quick Check Session 4.2 Visual Overview: Scatter Charts, Data Bars, and Sparklines Creating a Scatter Chart Editing the Chart Data Source Adding Graphic Objects to a Workbook Exploring Other Chart Types Creating Data Bars Creating Sparklines Session 4.2 Quick Check Module 5: Generating Reports from Multiple Worksheets and Workbooks Session 5.1 Visual Overview: Worksheet Groups and 3-D References Working with Multiple Worksheets Viewing a Workbook in Multiple Windows Working with Worksheet Groups Writing 3-D References Session 5.1 Quick Check Session 5.2 Visual Overview: External References and Links Linking to External Workbooks Creating Hyperlinks Session 5.2 Quick Check Session 5.3 Visual Overview: Named Ranges and Templates Simplifying Formulas with Named Ranges Exploring Workbook Templates Session 5.3 Quick Check Module 6: Managing Data with Data Tools Session 6.1 Visual Overview: Data Ranges, Workbook Panes, and Subtotals Handling Data in Excel Using Panes to View Data Locating Duplicate Records Sorting Records in a Data Range Calculating Subtotals Session 6.1 Quick Check Session 6.2 Visual Overview: Filters and Excel Tables Locating Cells Within a Worksheet Filtering Data Creating an Excel Table Session 6.2 Quick Check Session 6.3 Visual Overview: Slicers and Dashboards Filtering Data with Slicers Creating a Dashboard Session 6.3 Quick Check Module 7: Summarizing Data with PivotTables Session 7.1 Visual Overview: Summary IF Functions and VLOOKUP Using Lookup Functions Exploring Logical Functions Applying Summary IF Functions Session 7.1 Quick Check Session 7.2 Visual Overview: PivotTables Creating PivotTables Formatting a PivotTable Setting PivotTable Options Setting the PivotTable Design Session 7.2 Quick Check Session 7.3 Visual Overview: PivotCharts and Slicers Introducing PivotCharts Using Slicers and PivotTables Drilling Down a PivotTable Session 7.3 Quick Check Module 8: Performing What-If Analyses Session 8.1 Visual Overview: Data Tables and What-If Analysis Understanding Cost-Volume Relationships Working with Data Tables Creating a Two-Variable Data Table Session 8.1 Quick Check Session 8.2 Visual Overview: What-If Scenarios Exploring Financial Scenarios with Scenario Manager Creating Scenario Summary Reports Session 8.2 Quick Check Session 8.3 Visual Overview: Optimal Solutions with Solver Optimizing a Product Mix Finding the Optimal Solution with Solver Exploring the Iterative Process Creating a Solver Answer Report Saving and Loading Solver Models Session 8.3 Quick Check Module 9: Exploring Financial Tools and Functions Session 9.1 Visual Overview: Loan and Investment Functions Introducing Financial Functions Calculating Borrowing Costs Creating an Amortization Schedule Session 9.1 Quick Check Session 9.2 Visual Overview: Income Statements and Depreciation Projecting Future Income and Expenses Calculating Depreciation of Assets Adding Taxes and Interest Expenses to an Income Statement Session 9.2 Quick Check Session 9.3 Visual Overview: NPV and IRR Functions and Auditing Calculating Interest Rates with the RATE Function Viewing the Payback Period of an Investment Calculating Net Present Value Calculating the Internal Rate of Return Auditing a Workbook Session 9.3 Quick Check Module 10: Analyzing Data with Business Intelligence Tools Session 10.1 Visual Overview: Queries and Trendlines Introducing Business Intelligence Writing a Data Query Transforming Data with Queries Charting Trends Creating a Forecast Sheet Session 10.1 Quick Check Session 10.2 Visual Overview: Power Pivot and the Data Model Introducing Databases Exploring the Data Model Transforming Data with Power Pivot Creating a PivotTable from the Data Model Session 10.2 Quick Check Session 10.3 Visual Overview: Hierarchies and Maps Working with Outlines and Hierarchies Viewing Data with Map Charts Session 10.3 Quick Check Module 11: Exploring PivotTable Design Session 11.1 Visual Overview: Layouts, Sorting, Filtering, and Grouping Laying Out a PivotTable Sorting a PivotTable Filtering a PivotTable Grouping PivotTable Fields Session 11.1 Quick Check Session 11.2 Visual Overview: Conditional Formats and Calculations Calculations with PivotTables Displaying PivotTables with Conditional Formats Exploring the PivotTable Cache Working with Calculated Items and Calculated Fields Session 11.2 Quick Check Session 11.3 Visual Overview: PivotTable Measures Introducing PivotTable Design Under the Data Model Calculating Distinct Counts Creating a Measure Calculating Measures Across Tables and Rows Retrieving PivotTable Data with GETPIVOTDATA Exploring Database Functions Session 11.3 Quick Check Module 12: Developing an Excel Application Session 12.1 Visual Overview: WordArt and Funnel Charts Planning an Excel Application Creating a WordArt Graphic Displaying Data with a Funnel Chart Hiding Error Values with the IFERROR Function Session 12.1 Quick Check Session 12.2 Visual Overview: Data Validation and Workbook Protection Validating Data Entry Hiding Workbook Content Protecting Workbook Contents Session 12.2 Quick Check Session 12.3 Visual Overview: Macros and Visual Basic for Applications Loading the Excel Developer Tab Automating Tasks with Macros Assigning Macros to Shapes and Buttons Working with the VBA Editor Protecting Against Macro Viruses Session 12.3 Quick Check [Show More]
Last updated: 2 months ago
Preview 1 out of 228 pages
Reviews( 0 )
Document information
Connected school, study & course
About the document
Uploaded On
Sep 03, 2022
Number of pages
228
Written in
Additional information
This document has been written for:
Uploaded
Sep 03, 2022
Downloads
0
Views
105

