Engineering > QUESTIONS & ANSWERS > WEEK 10 HOMEWORK – SAMPLE SOLUTIONS (All)
WEEK 10 HOMEWORK – SAMPLE SOLUTIONS
Document Content and Description Below
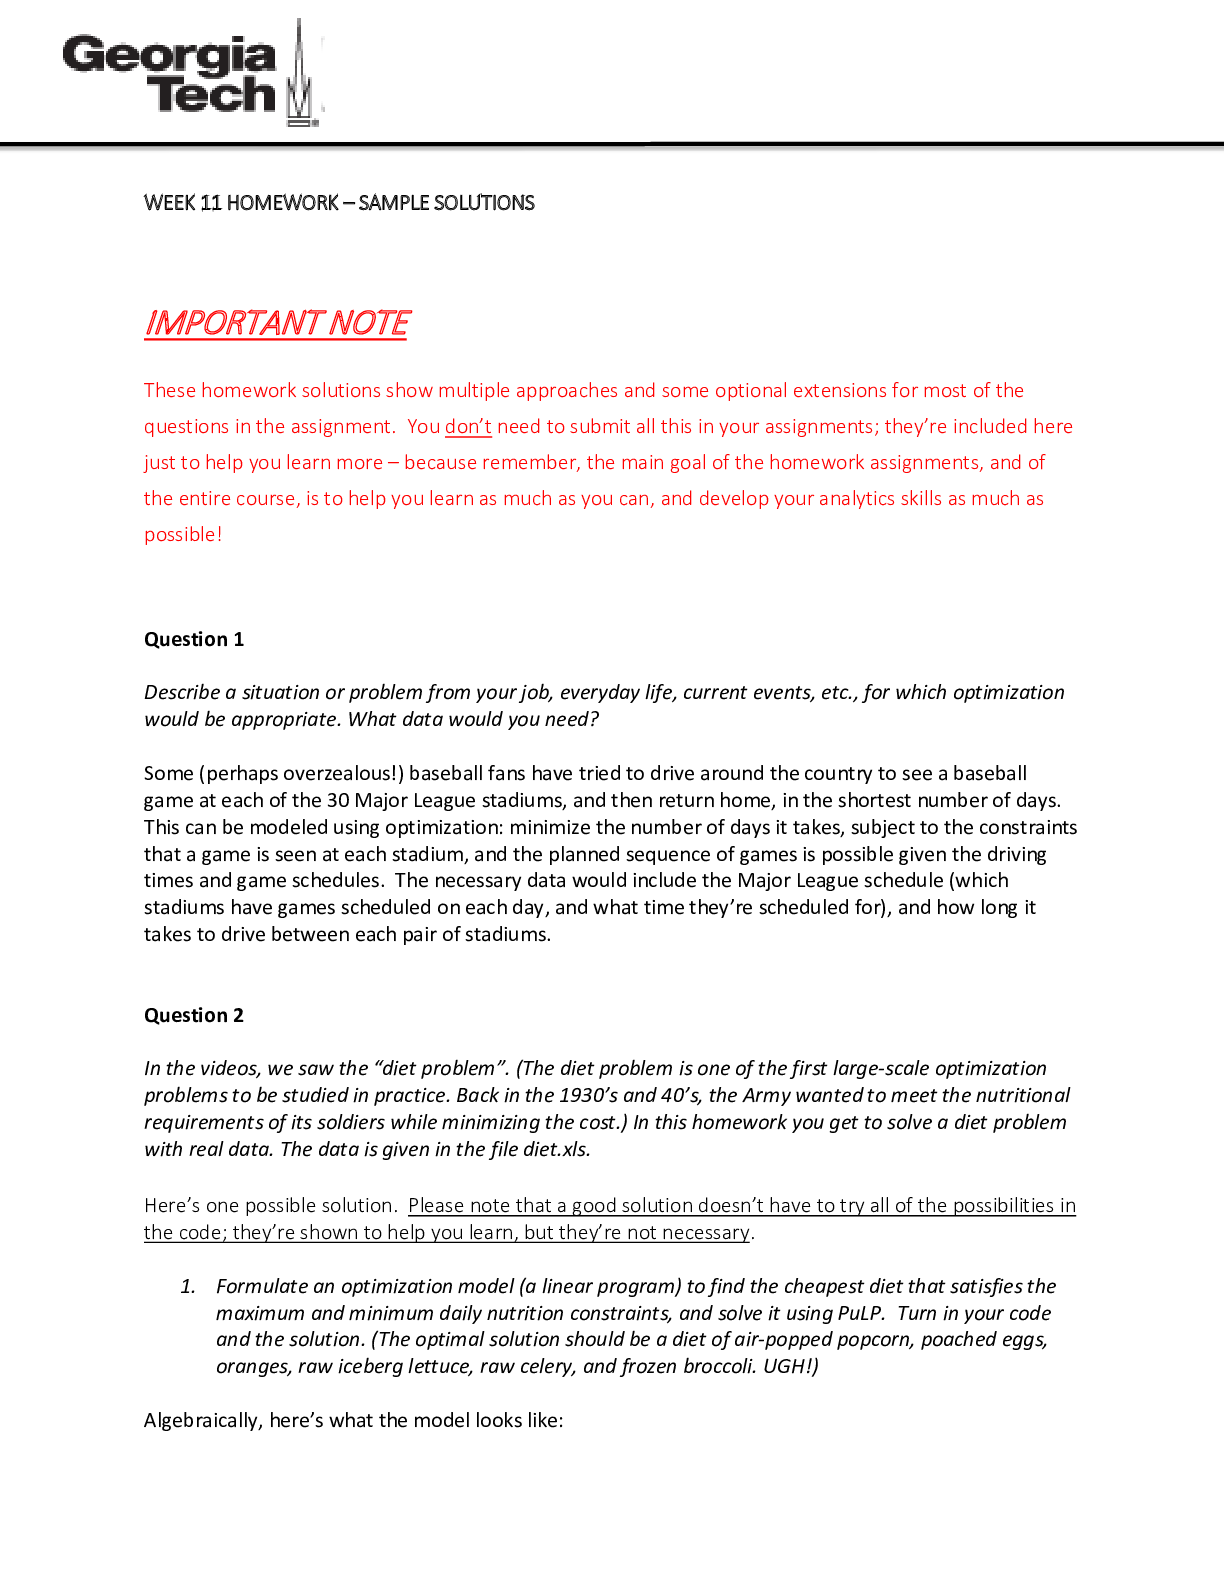
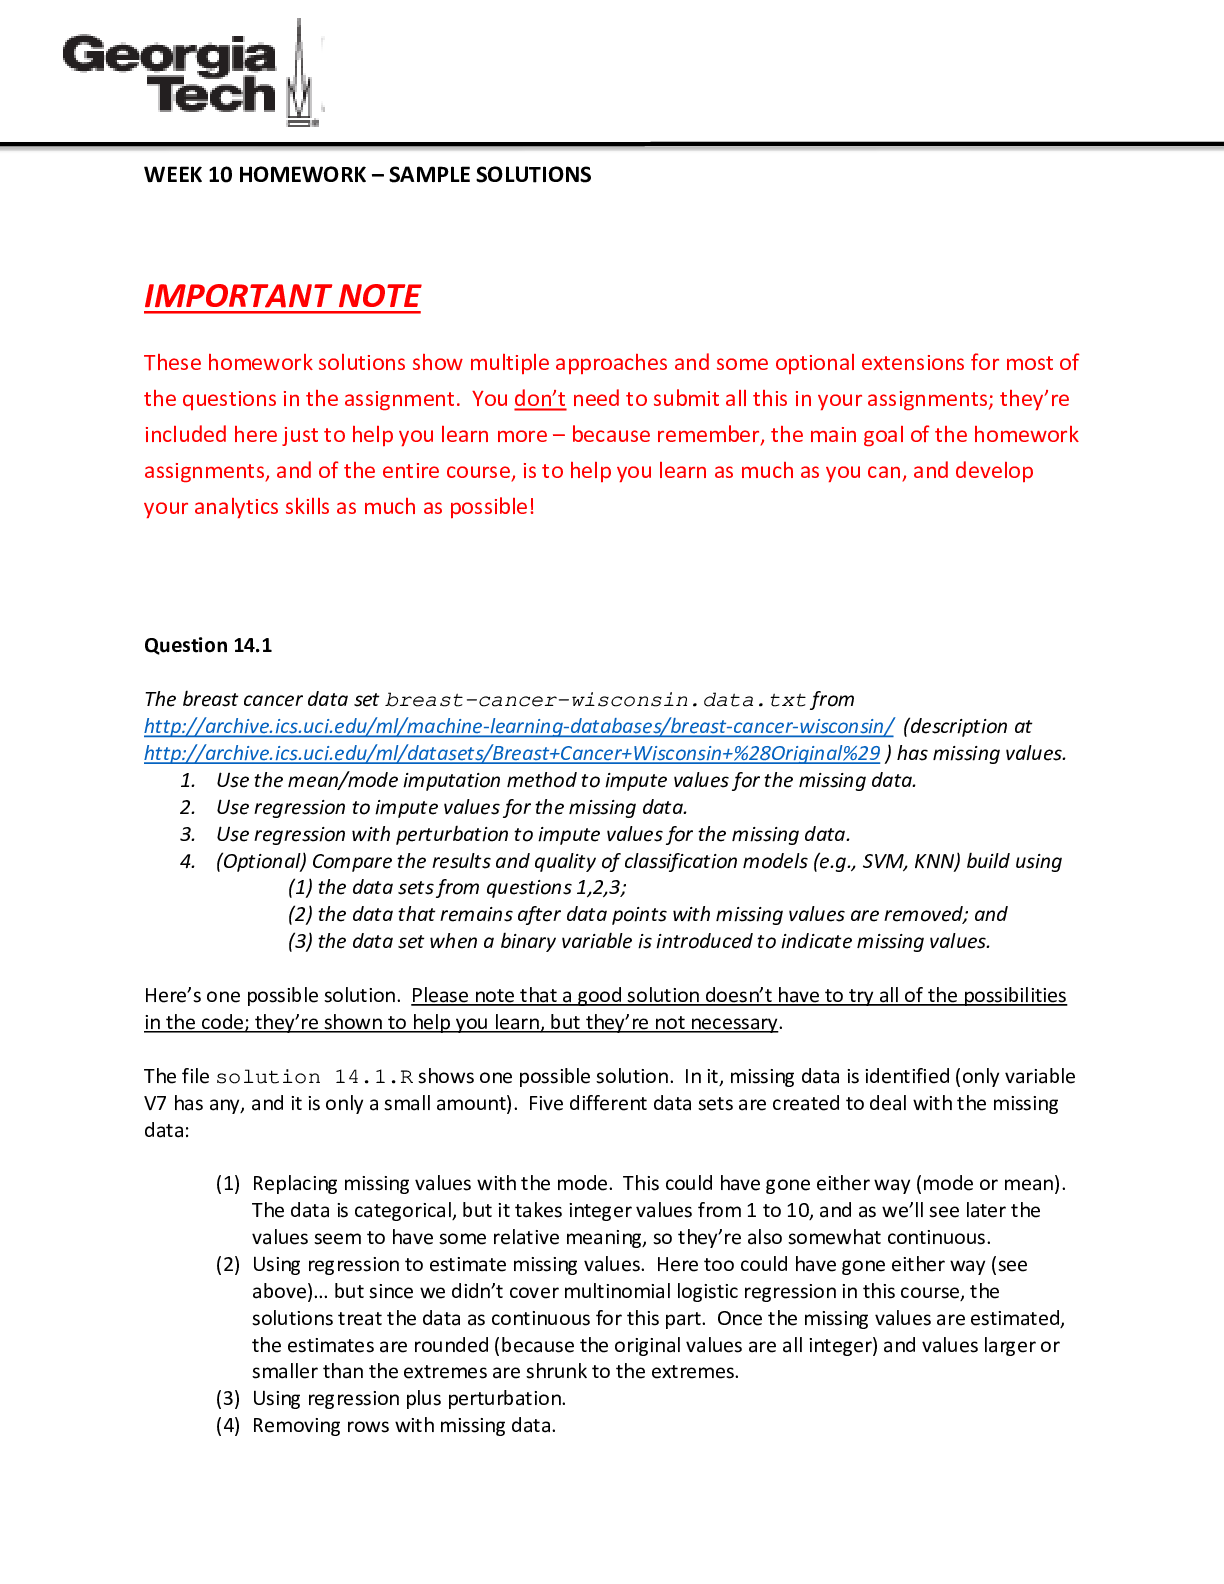
WEEK 10 HOMEWORK – SAMPLE SOLUTIONS IMPORTANT NOTE These homework solutions show multiple approaches and some optional extensions for most of the questions in the assignment. You don’t need to ... submit all this in your assignments; they’re included here just to help you learn more – because remember, the main goal of the homework assignments, and of the entire course, is to help you learn as much as you can, and develop your analytics skills as much as possible! Question 14.1 The breast cancer data set breast-cancer-wisconsin.data.txt from http://archive.ics.uci.edu/ml/machine-learning-databases/breast-cancer-wisconsin/ (description at http://archive.ics.uci.edu/ml/datasets/Breast+Cancer+Wisconsin+%28Original%29 ) has missing values. 1. Use the mean/mode imputation method to impute values for the missing data. 2. Use regression to impute values for the missing data. 3. Use regression with perturbation to impute values for the missing data. 4. (Optional) Compare the results and quality of classification models (e.g., SVM, KNN) build using (1) the data sets from questions 1,2,3; (2) the data that remains after data points with missing values are removed; and (3) the data set when a binary variable is introduced to indicate missing values. Here’s one possible solution. Please note that a good solution doesn’t have to try all of the possibilities in the code; they’re shown to help you learn, but they’re not necessary. The file solution 14.1.R shows one possible solution. In it, missing data is identified (only variable V7 has any, and it is only a small amount). Five different data sets are created to deal with the missing data: (1) Replacing missing values with the mode. This could have gone either way (mode or mean). The data is categorical, but it takes integer values from 1 to 10, and as we’ll see later the values seem to have some relative meaning, so they’re also somewhat continuous. (2) Using regression to estimate missing values. Here too could have gone either way (see above)… but since we didn’t cover multinomial logistic regression in this course, the solutions treat the data as continuous for this part. Once the missing values are estimated, the estimates are rounded (because the original values are all integer) and values larger or smaller than the extremes are shrunk to the extremes. (3) Using regression plus perturbation. (4) Removing rows with missing data. (5) Adding a binary variables to indicate when data is missing, and adding the necessary interaction variables also. Once the data sets have been created, we use KNN (for k=1,2,3,4,5) and SVM (C=0.0001,0.001,0.01,0.1,1,10) to create classification models, and measure their quality. The table below shows the results. Method for dealing with missing data Model Impute using mode Impute using regression Impute using regression, then perturb Remove rows with missing data Add binary variable for missing data KNN (k=1) 0.952 0.948 0.948 0.952 0.952 KNN (k=2) 0.952 0.948 0.948 0.952 0.952 KNN (k=3) 0.924 0.919 0.919 0.923 0.924 KNN (k=4) 0.924 0.919 0.919 0.923 0.924 KNN (k=5) 0.919 0.914 0.914 0.913 0.919 SVM (C=0.0001) 0.662 0.662 0.662 0.659 0.662 SVM (C=0.001) 0.943 0.943 0.943 0.942 0.943 SVM (C=0.01) 0.957 0.957 0.957 0.957 0.957 SVM (C=0.1) 0.962 0.962 0.962 0.962 0.962 SVM (C=1) 0.967 0.962 0.967 0.966 0.967 SVM (C=10) 0.967 0.962 0.967 0.966 0.967 It turns out that there isn’t much difference in model performance across the five ways of dealing with missing data. The best SVM models are a little better than the best KNN models, but SVM is harder to calibrate; the worst SVM models tested are much worse than the worst KNN models. Question 15.1 Describe a situation or problem from your job, everyday life, current events, etc., for which optimization would be appropriate. What data would you need? Some (perhaps overzealous!) baseball fans have tried to drive around the country to see a baseball game at each of the 30 Major League stadiums, and then return home, in the shortest number of days. This can be modeled using optimization: minimize the number of days it takes, subject to the constraints that a game is seen at each stadium, and the planned sequence of games is possible given the driving times and game schedules. The necessary data would include the Major League schedule (which stadiums have games scheduled on each day, and what time they’re scheduled for), and how long it takes to drive between each pair of stadiums. Question 15.2 In the videos, we saw the “diet problem”. (The diet prob [Show More]
Last updated: 1 year ago
Preview 1 out of 7 pages
Reviews( 0 )
Document information
Connected school, study & course
About the document
Uploaded On
May 19, 2022
Number of pages
7
Written in
Additional information
This document has been written for:
Uploaded
May 19, 2022
Downloads
0
Views
94

.png)
.png)
.png)
.png)
.png)
.png)
.png)
.png)
.png)
.png)
.png)

.png)

.png)
.png)
