Statistics > QUESTIONS & ANSWERS > Sophia __ Intro to Stats Unit 4 Milestone 4 Questions and Answers Rated A. (All)
Sophia __ Intro to Stats Unit 4 Milestone 4 Questions and Answers Rated A.
Document Content and Description Below
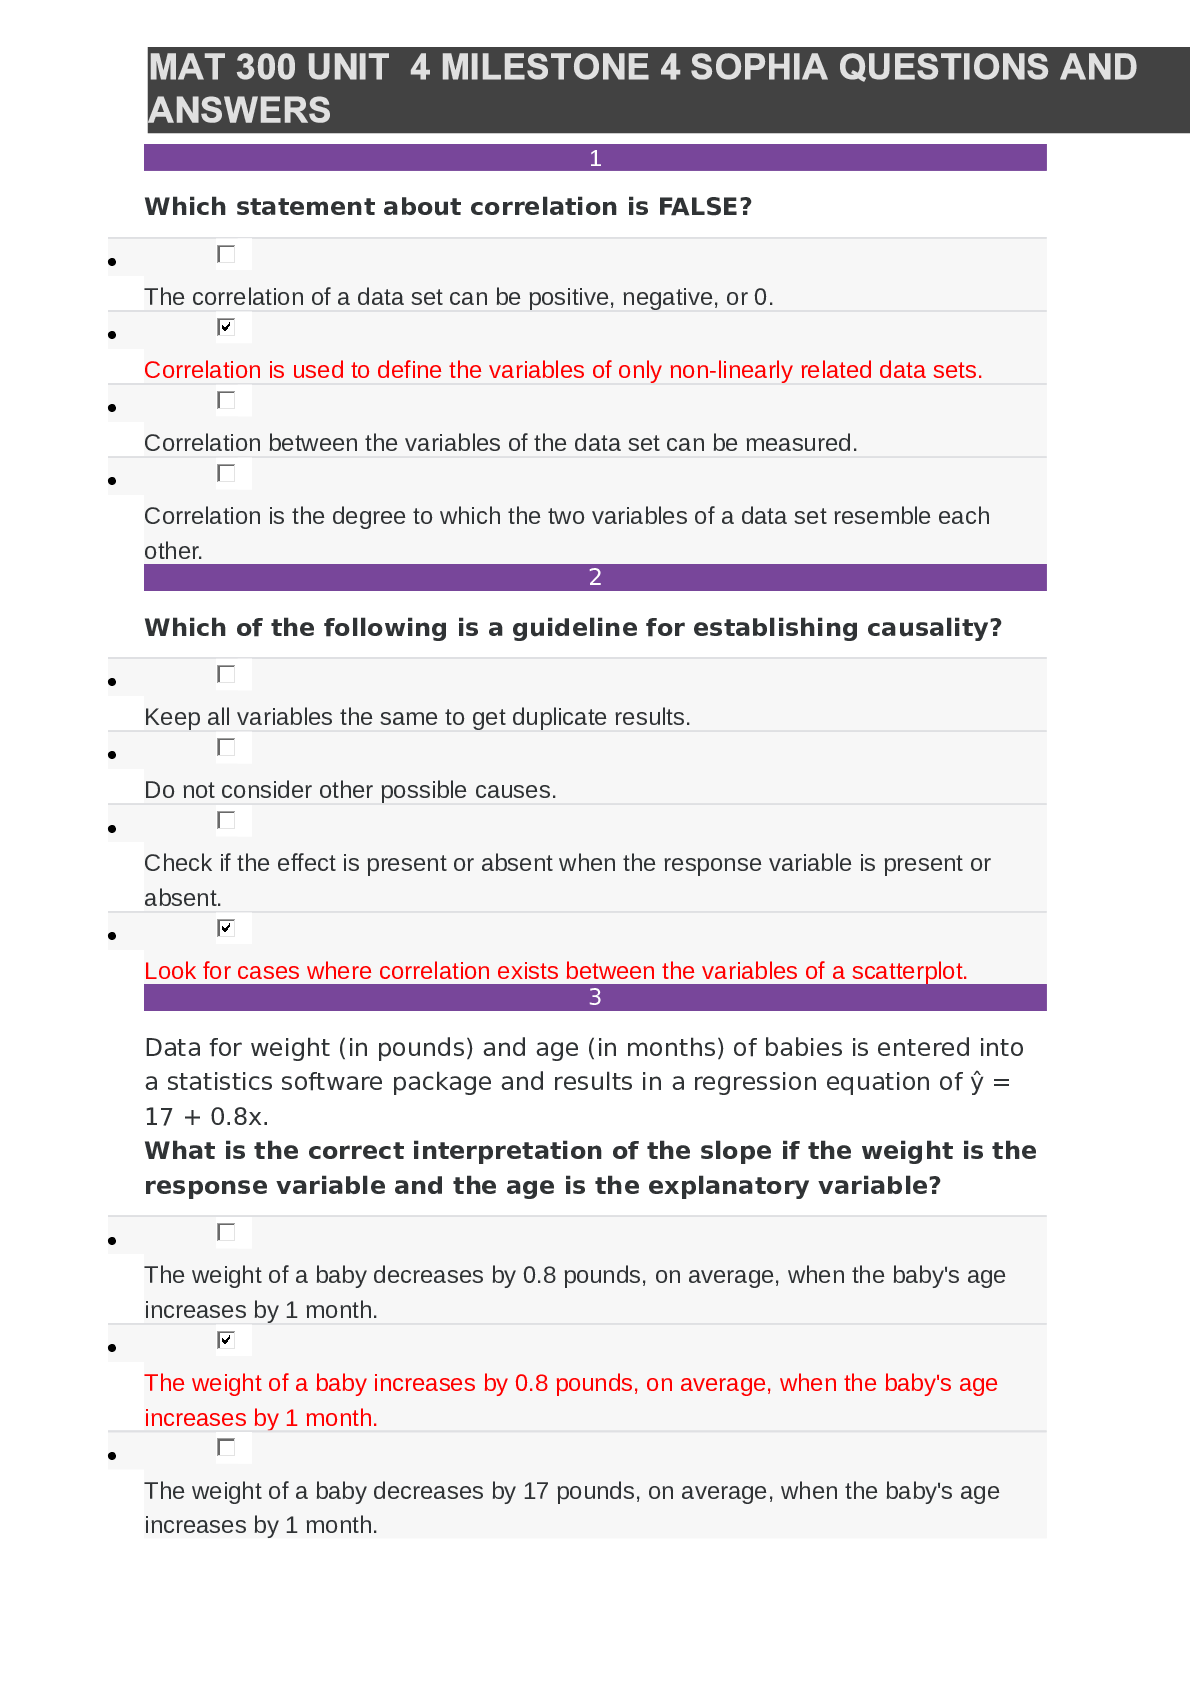
2 questions were answered incorrectly. 1 For ten students, a teacher records the following scores of two assessments, Quiz 1 and Test. Quiz 1 (x) Test (y) 15 20 12 15 10 12 14 18 10 10 8 13 ... 6 12 15 10 16 18 13 15 Mean 11.9 14.3 Standard Deviation 3.3 3.5 The correlation of Quiz 1 and Test is 0.568. Given the information below, what is the slope and y-intercept for the least-squares line of the Quiz 1 scores and Test scores? Answer choices are rounded to the hundredths place. Slope = 0.54 y-intercept = 1.71 Slope = 0.54 y-intercept = 1.22 Slope = 0.60 y-intercept = 7.16 Slope = 0.60 y-intercept = 1.22 RATIONALE We first want to get the slope. We can use the formula: To then get the intercept, we can solve for the y-intercept by using the following formula: We know the slope, , and we can use the mean of x and the mean of y for the variables and to solve for the y-intercept, . CONCEPT Finding the Least-Squares Line 2 A bank manager declares, with help of a scatterplot, that the number of health insurances sold may have some association with the number of inches it snows. How many policies were sold when it snowed 2 to 4 inches? 350 470 210 240 RATIONALE In order to find the total number of policies between 2 and 4 inches, we must add the three values of 10 in that interval. At 2 inches, there were 100 policies. At 3 inches, there were 110 policies. At 4 inches, there were 140 policies. So the total is 100 + 110 + 140 = 350 policies. CONCEPT Scatterplot 3 Which of the following scatterplots shows an outlier in the y-direction? RATIONALE To have an outlier in the y-direction the outlier must be in the range of x data but outside the range of y-data. This outlier is outside of the data in the y direction, lying below all of the data. CONCEPT Outliers and Influential Points 4 Thomas was interested in learning more about the salary of a teacher. He believed as a teacher increases in age, the annual earnings also increases. The age (in years) is plotted against the earnings (in dollars) as shown below. Using the best-fit line, approximately how much money would a 45-year-old teacher make? $50,000 $55,000 $58,000 $48,000 RATIONALE To get a rough estimate of the salary of a 45 year-old, we go to the value of 45 on the horizontal axis and then see where it falls on the best-fit line. This looks to be about $50,000. CONCEPT Best-Fit Line and Regression Line 5 Which of the following scatterplots shows a correlation affected by non-linearity? [Show More]
Last updated: 1 year ago
Preview 1 out of 23 pages

Reviews( 0 )
Document information
Connected school, study & course
About the document
Uploaded On
Apr 10, 2022
Number of pages
23
Written in
Additional information
This document has been written for:
Uploaded
Apr 10, 2022
Downloads
0
Views
67

.png)
.png)
.png)
.png)
.png)
.png)
.png)
.png)
.png)
.png)
.png)

.png)
.png)
.png)
.png)





.png)
