Statistics > EXAM > STAT 200 Week 3 Homework Problems. (All)
STAT 200 Week 3 Homework Problems.
Document Content and Description Below
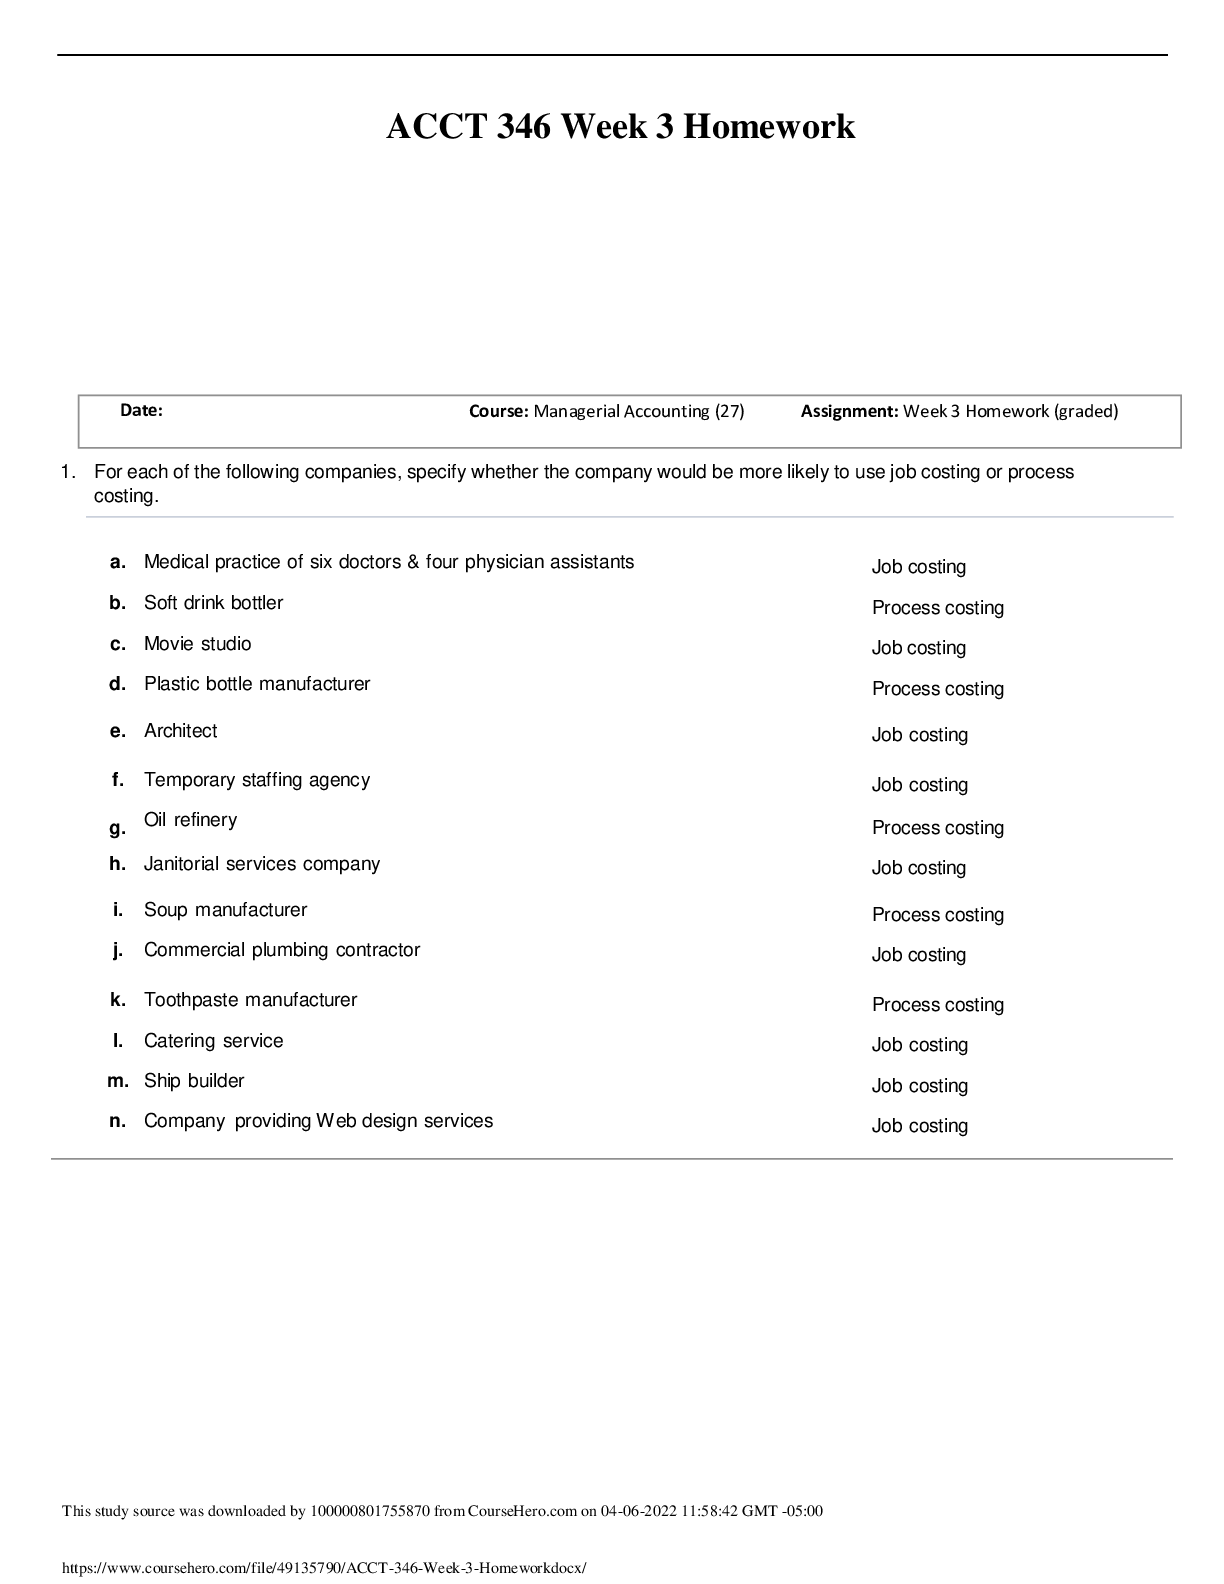
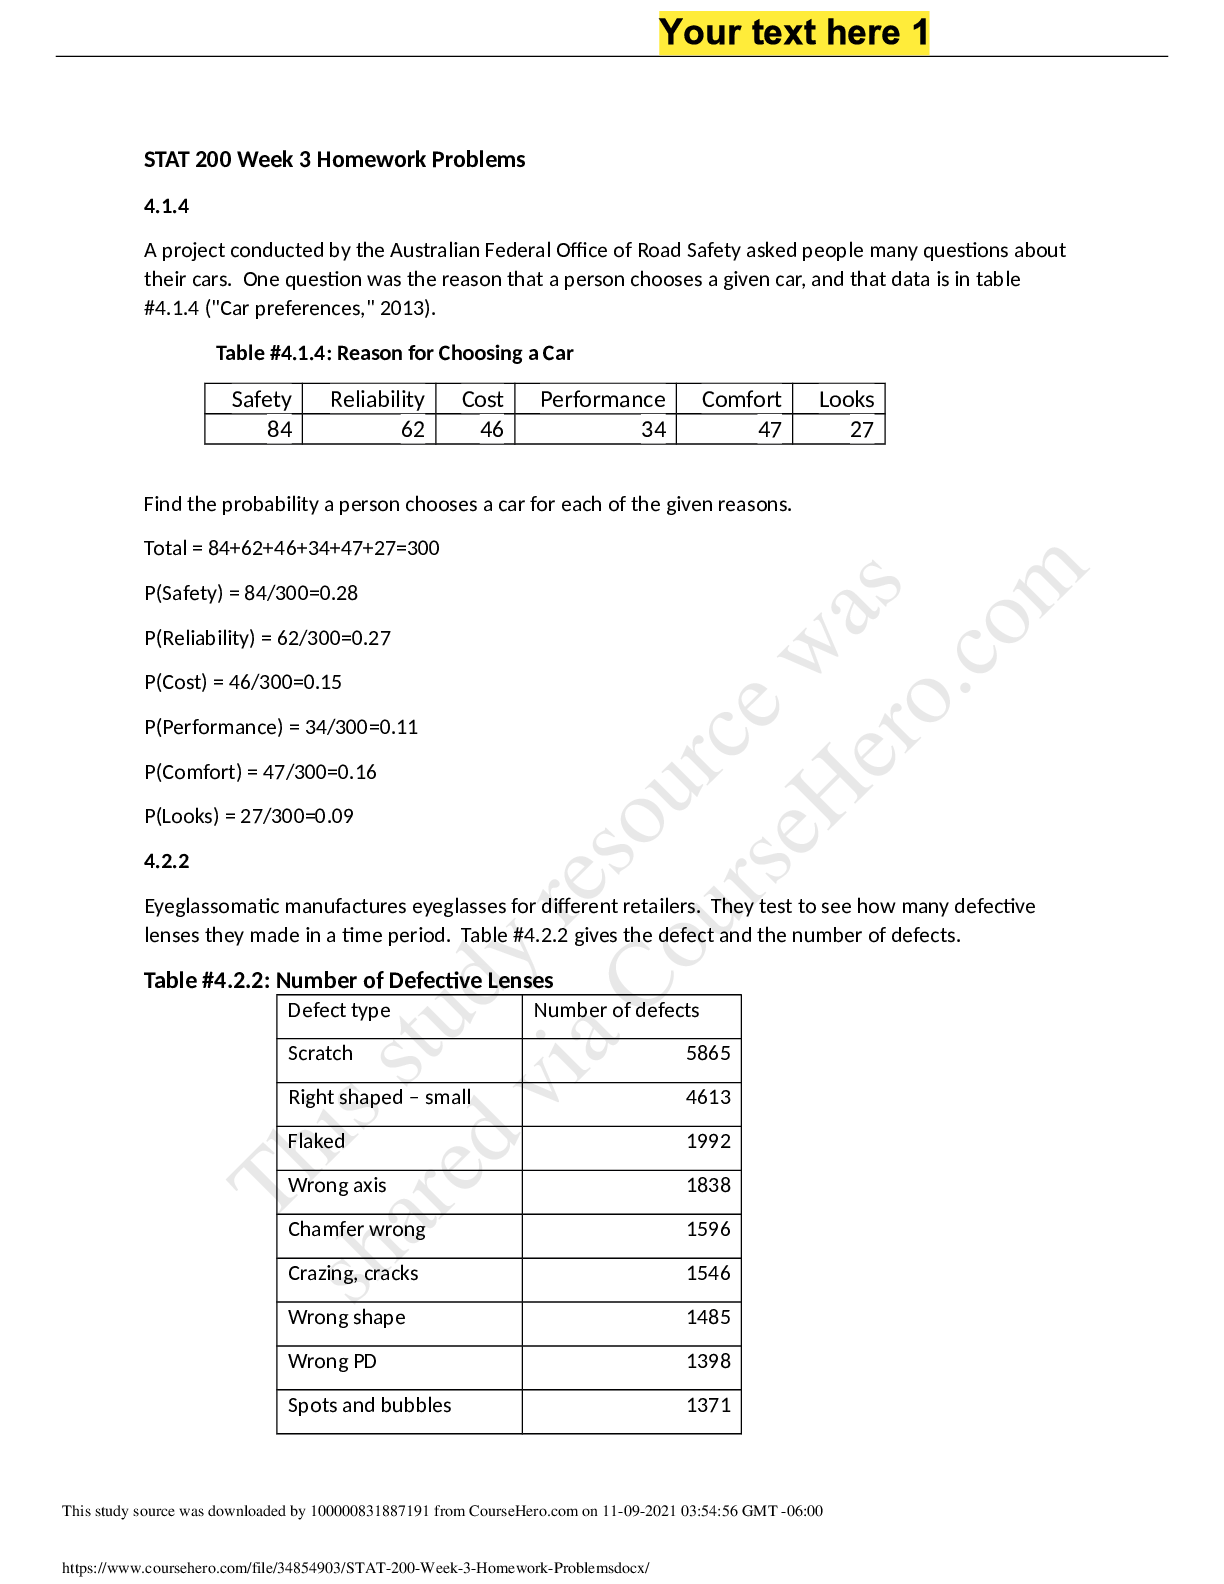
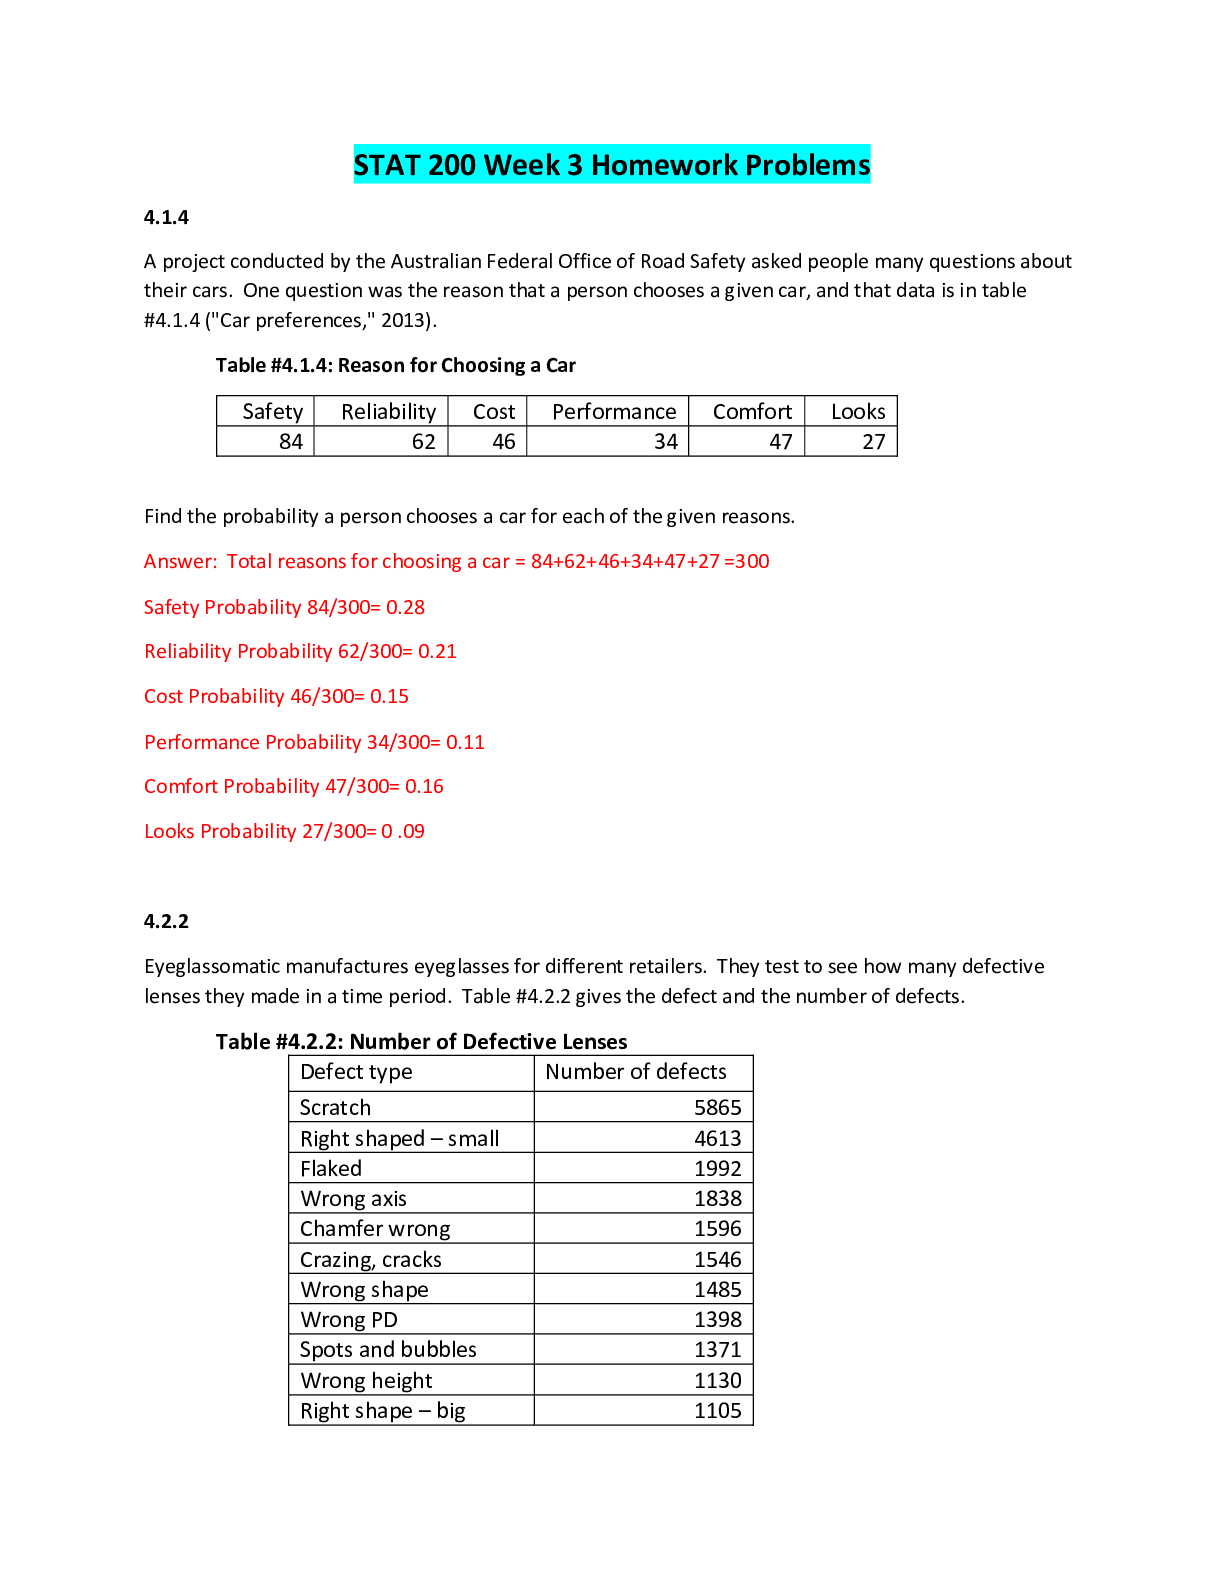
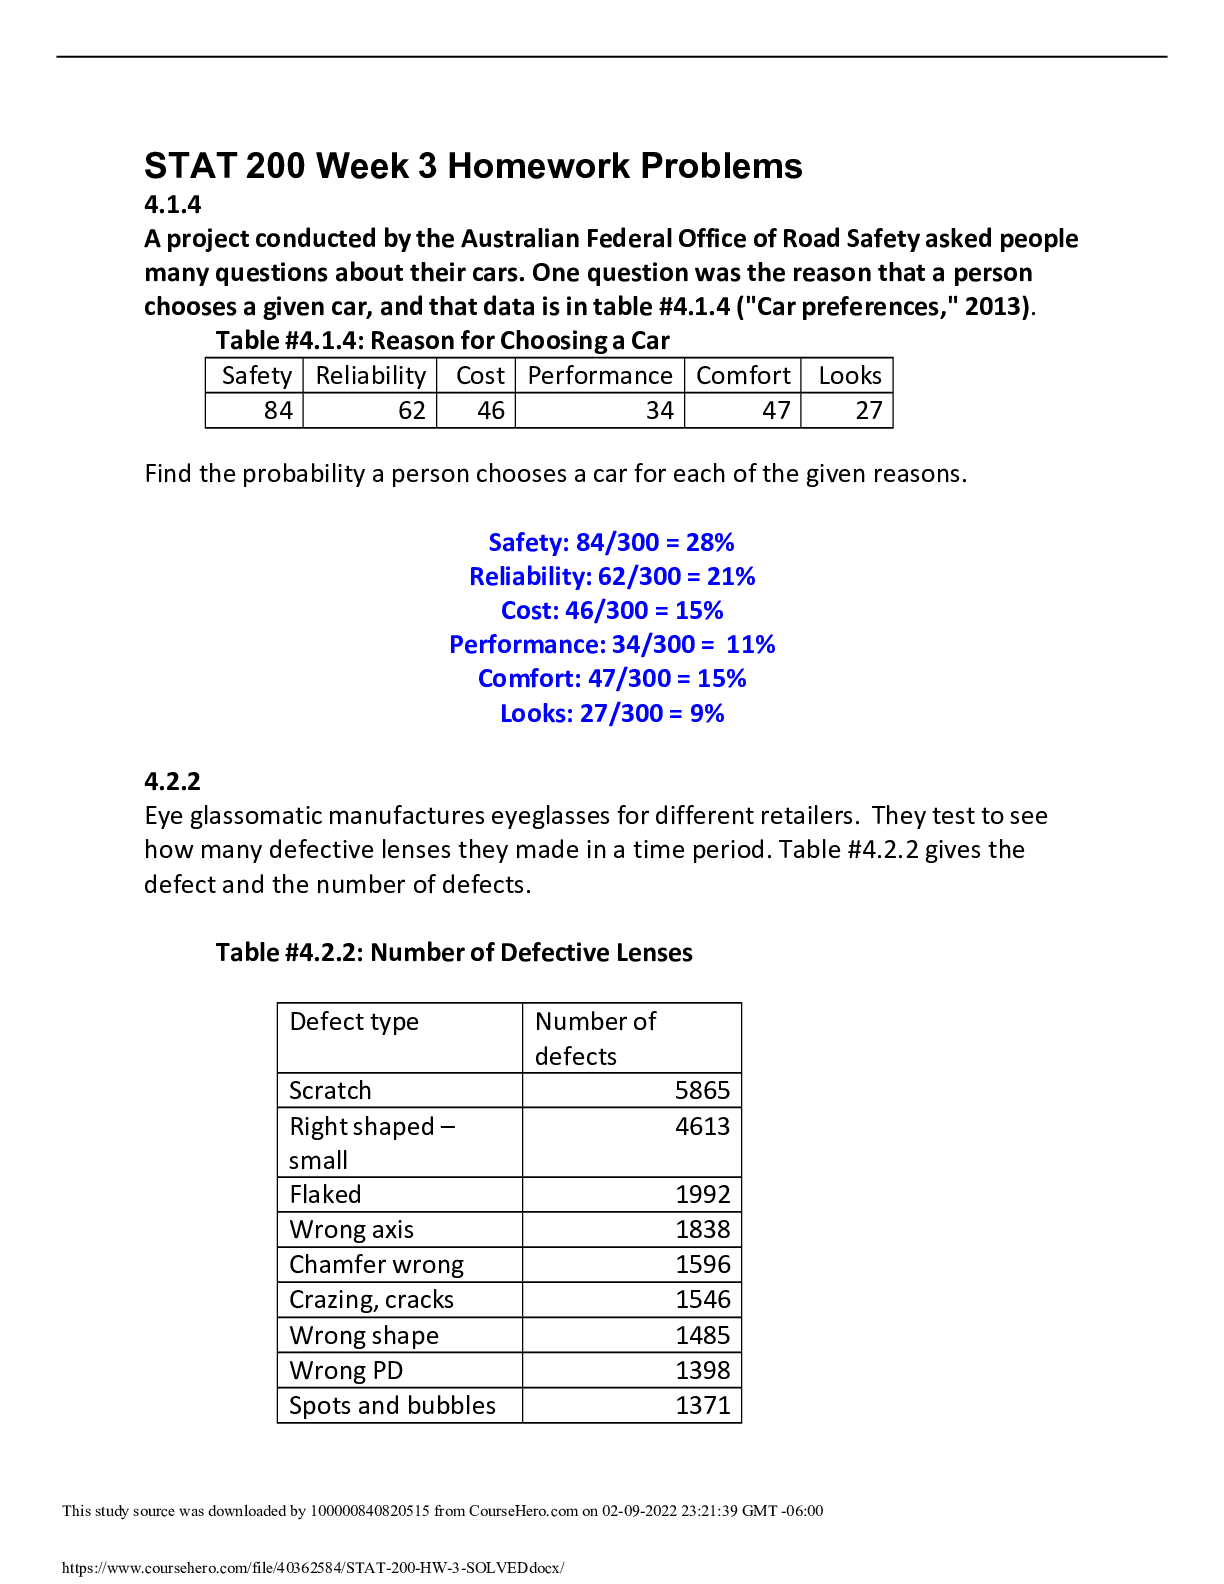
4.1.4 A project conducted by the Australian Federal Office of Road Safety asked people many questions about their cars. One question was the reason that a person chooses a given car, and that data is... in table #4.1.4 ("Car preferences," 2013). Table #4.1.4: Reason for Choosing a Car Safety Reliability Cost Performance Comfort Looks 84 62 46 34 47 27 Find the probability a person chooses a car for each of the given reasons. Safety: 84/300 = 28% Reliability: 62/300 = 21% Cost: 46/300 = 15% Performance: 34/300 = 11% Comfort: 47/300 = 15% Looks: 27/300 = 9% 4.2.2 Eye glassomatic manufactures eyeglasses for different retailers. They test to see how many defective lenses they made in a time period. Table #4.2.2 gives the defect and the number of defects. Table #4.2.2: Number of Defective Lenses Defect type Number of defects Scratch 5865 Right shaped – small 4613 Flaked 1992 Wrong axis 1838 Chamfer wrong 1596 Crazing, cracks 1546 Wrong shape 1485 Wrong PD 1398 Spots and bubbles 1371 [Show More]
Last updated: 1 year ago
Preview 1 out of 7 pages
Reviews( 0 )
Document information
Connected school, study & course
About the document
Uploaded On
Feb 10, 2022
Number of pages
7
Written in

Additional information
This document has been written for:
Uploaded
Feb 10, 2022
Downloads
0
Views
39


.png)
.png)
.png)