Statistics > SOPHIA Milestone > Sophia Statistics FINAL Milestone. With RATIONALE and CONCEPT. Score 21/25 (All)
Sophia Statistics FINAL Milestone. With RATIONALE and CONCEPT. Score 21/25
Document Content and Description Below
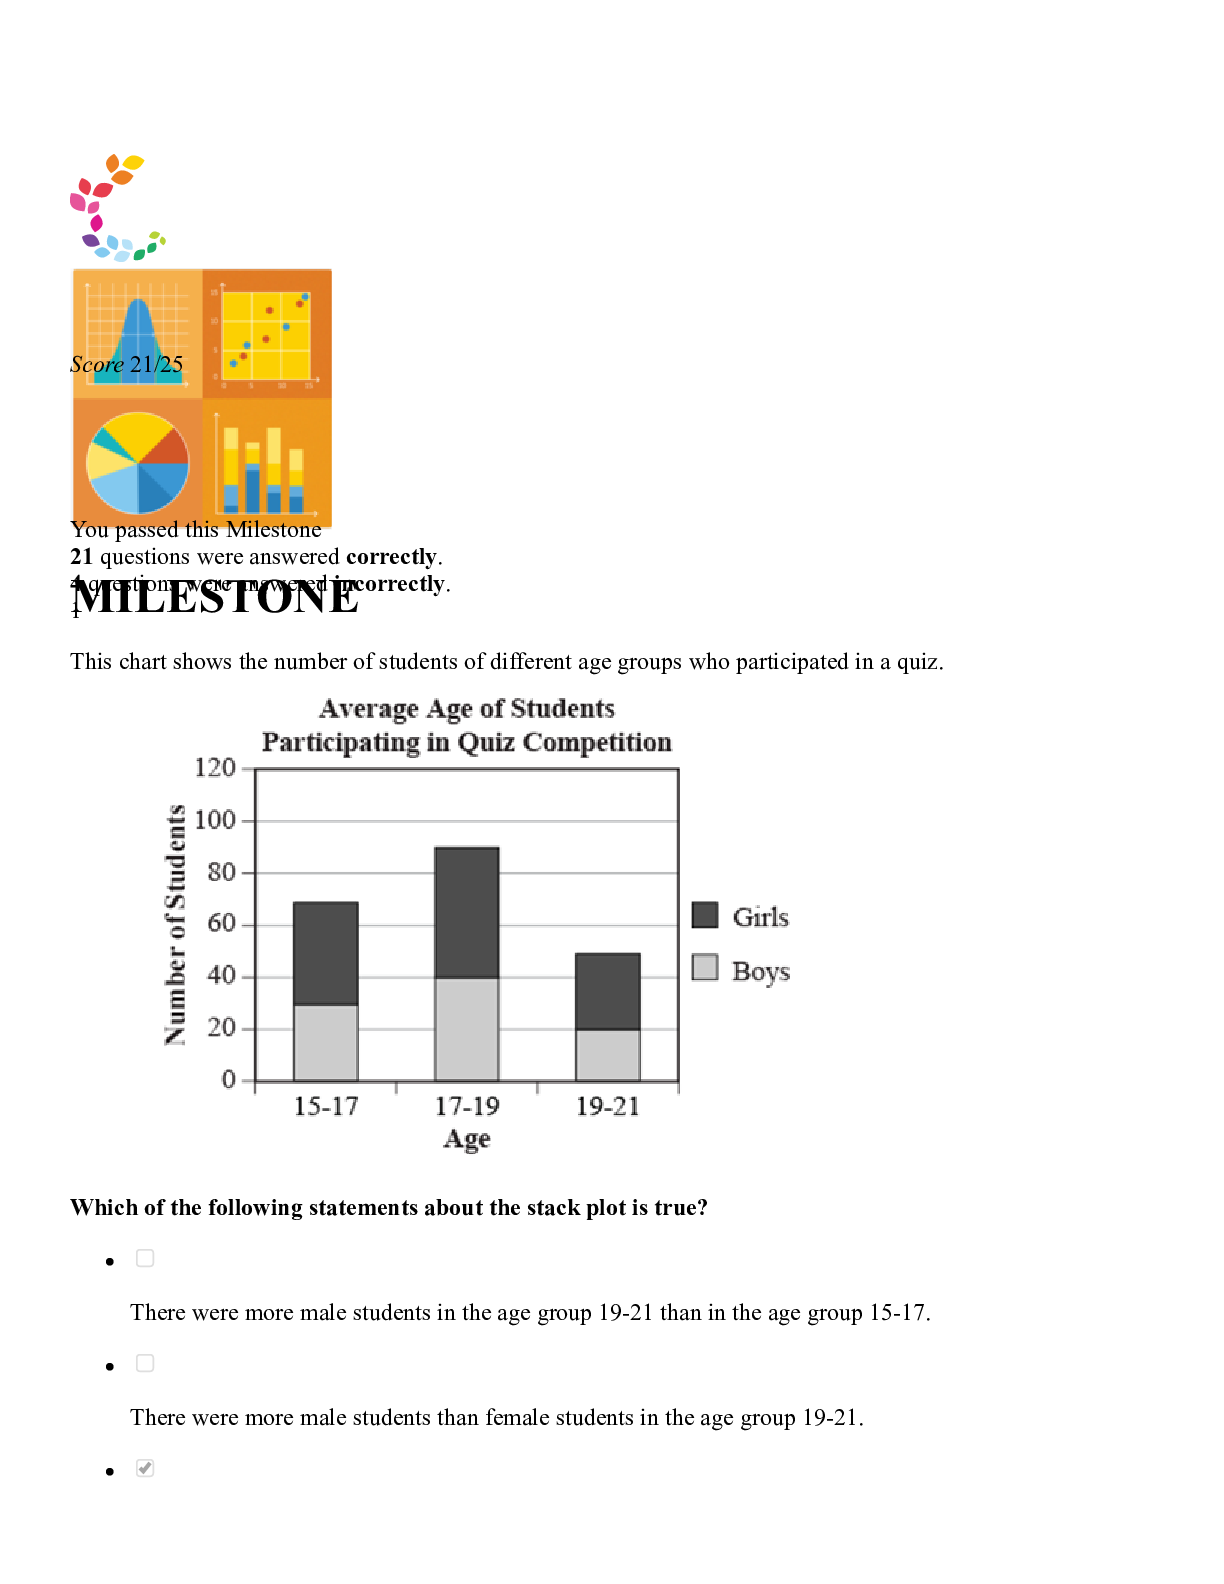
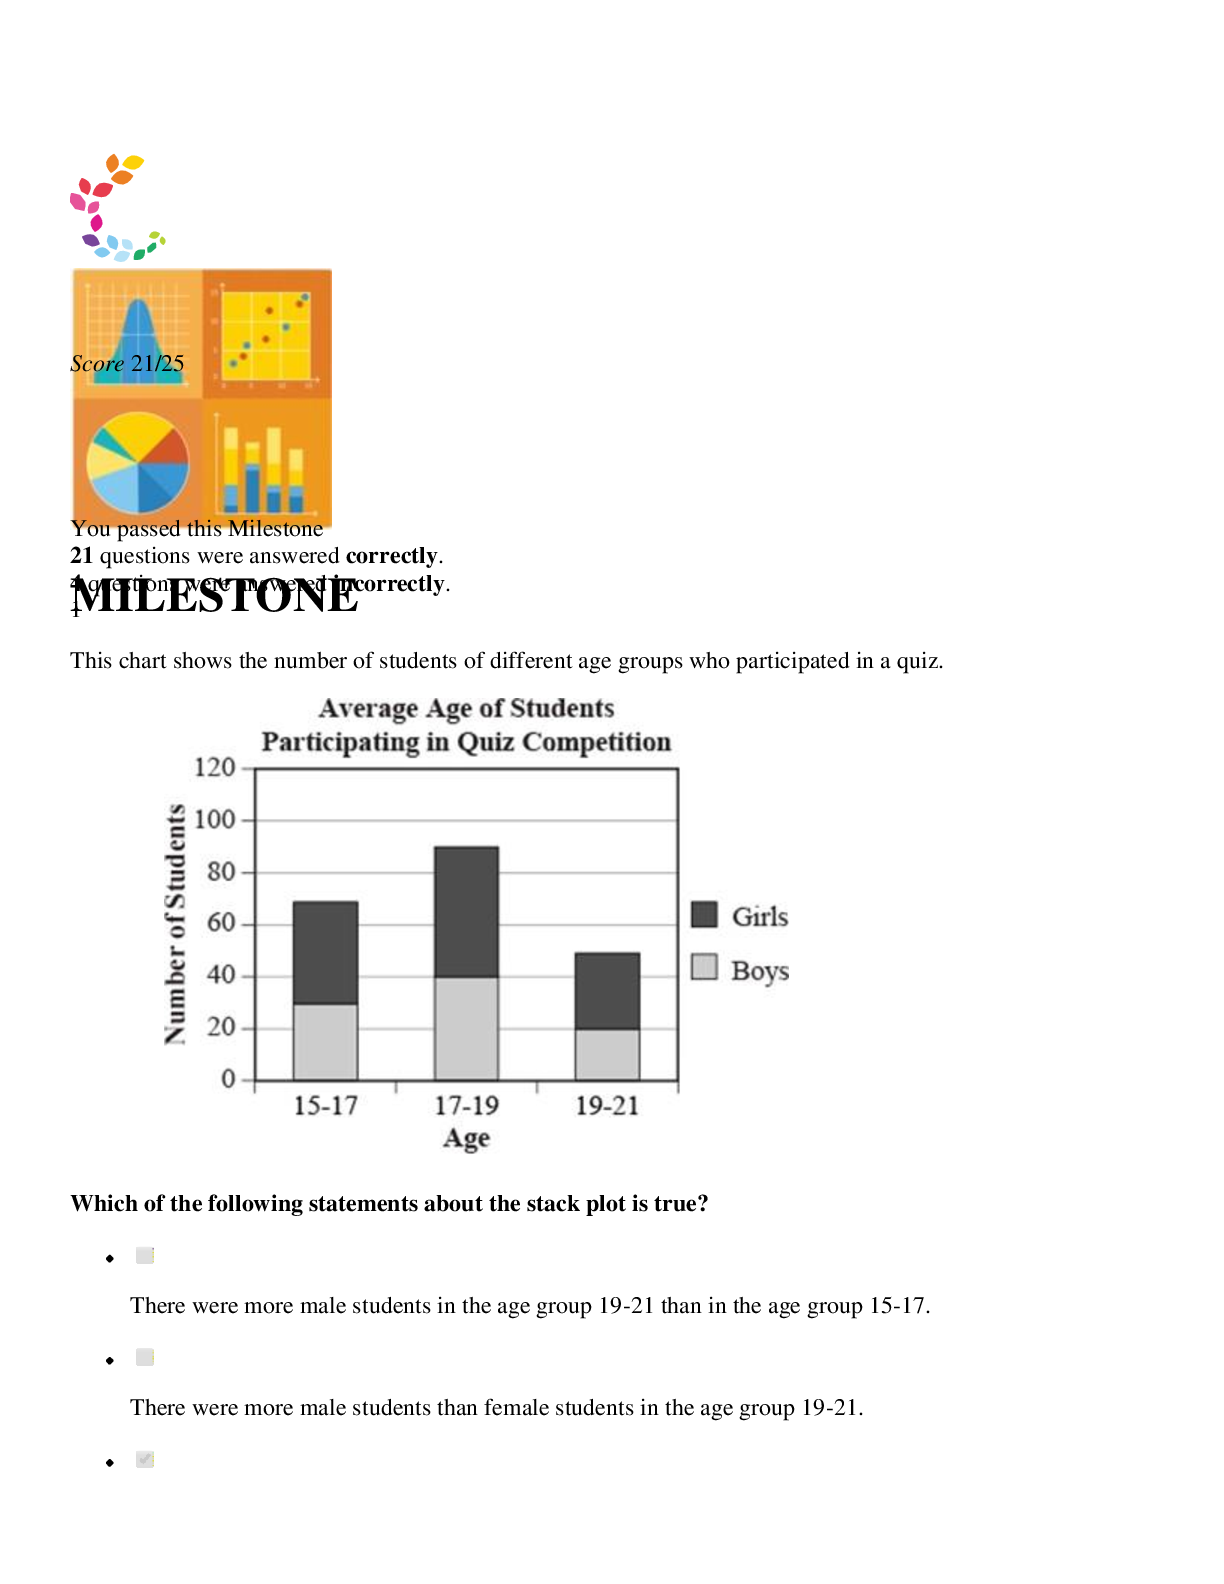
MILESTONE Score 21/25 You passed this Milestone 21 questions were answered correctly. 4 questions were answered incorrectly. 1 This chart shows the number of students of different age groups who... participated in a quiz. Which of the following statements about the stack plot is true? There were more male students in the age group 19-21 than in the age group 15-17. There were more male students than female students in the age group 19-21. There were more female students in the age group 17-19 than in any other age group. There were more students in the age group 15-17 than in any other age group. If we note that the greatest area for the girls is the longest darker region, this occurs in the age group 17-19. Stack Plots I need help with this question 2 Jay wants to study nutrition and performance in schools using available data. Which of the scenarios below will provide Jay with available data? Going to a local high school and asking the principal for information about students' previous grades, then interviewing a random selection of students about their eating habits. Going to a local high school and asking the principal for information about students' current and previous grades, then interviewing a random selection of students about their eating habits. Going to a local high school and asking the principal for information about students' current and previous grades, then asking the health teacher for the results from a survey students took in health class. Going to a local college and asking current undergraduates to report their grades and eating habits from high school. Recall, for data to be considered available data it must already be collected. Since the grades data and survey data were already collected these are examples of available data. Data I need help with this question 3 Regan wants to study how reading on a computer affects comprehension among elementary school students. Regan thinks that girls and boys might differ and he also suspects that grade level will affect the results. He decides to create a male and a female group for each grade. Within each group, he randomly assigns half of the students to read an article on paper and half of the students to read the article on a computer. Which type of experimental design does this situation illustrate? Completely Randomized Randomized Block Double-Blind Matched-Pair Since students are put into gender and grade blocks and are then assigned treatment or control randomly this is called a randomized block design. Randomized Block Design I need help with this question 4 Select the correct statement regarding experiments. A researcher can control the environment and observe the response. A researcher cannot control the environment but can observe the response. A researcher can control the environment but cannot observe the response. A researcher can neither control the environment nor observe the response. The defining part of experimental setting is that the researcher can control the setting and apply some treatment to observe how it affects an outcome of interest. Observational Studies and Experiments I need help with this question 5 Rachel measured the lengths of a random sample of 100 screws. The mean length was 2.9 inches, and the population standard deviation is 0.1 inch. To see if the batch of screws has a significantly different mean length from 3 inches, what would the value of the z-test statistic be? 1 10 -10 -1 If we first note the denominator of Then, getting the z-score we can note it is This tells us that 2.9 is 10 standard deviations below the value of 3, which is extremely far away. Z-Test for Population Means I need help with this question 6 Jesse takes two data points from the weight and feed cost data set to calculate a slope, or average rate of change. A ferret weighs 2.1 pounds and costs $3.40 per week to feed, while a Labrador Retriever weighs 70 pounds and costs $7.50 per week to feed. Using weight as the explanatory variable, what is the slope of the line between these two points? Answer choices are rounded to the nearest hundredth. $1.62 / lb. $1.73 / lb. $16.56 / lb. $.06 / lb. In order to get slope, we can use the formula: s l o p e equals fraction numerator y 2 minus y 1 over denominator x 2 minus x 1 end fraction. Using the information provided, the two points are: (2.1 lb., $3.40) and (70 lb., $7.50). We can note that: Linear Equation Algebra Review I need help with this question 7 Eric is randomly drawing cards from a deck of 52. He first draws a red card, places it back in the deck, shuffles the deck, and then draws another card. What is the probability of drawing a red card, placing it back in the deck, and drawing another red card? Answer choices are in the form of a percentage, rounded to the nearest whole number. 25% 22% 13% 4% Since Eric puts the card back and re-shuffles, the two events (first draw and second draw) are independent of each other. To find the probability of red on the first draw and second draw, we can use the following formula: Note that the probability of drawing a red card is or for each event. "And" Probability for Independent Events I need help with this question 8 A travel agency contacted a department store and obtained the list of all people who made purchases using their credit cards at the store in the last month. The agency then surveyed a random sample from the list, calling them to ask their preference for air travel or train travel for taking holidays. Which of the following types of bias affects the conclusions of the survey? Non-response bias Deliberate bias Selection bias Response bias Selection bias is when the mode of selection introduces a bias in the sample so that it is not representative of the population of interest. Since they only collected information from those using their credit card at a department store, this does not represent how people travel in general and is therefore an example of selection bias. Selection and Deliberate Bias I need help with this question 9 Jenae is able to purchase a different brand of coffee for half the price from a new supplier. She anticipated that her co-workers would object to switching to the new brand, as they were really partial to the coffee they have been drinking so far. Indeed, when offered a taste test of the old brand versus the new brand, her co-workers unanimously rejected the new brand. Jenae's boss, Steven, pointed out that this result was most likely due to the fact that the taste test was not ________. randomized blinded controlled replicated Since they didn't keep the participants unaware of what brand they were tasting, this could influence the findings. So, the rejection of the new brand was likely due to not blinding them from what brand they were drinking. Blinding I need help with this question 10 Fred Anderson, an artist, has recorded the number of visitors who visited his exhibit in the first 8 hours of opening day. He has made a scatter plot to depict the relationship between the number of hours and the number of visitors. How many visitors were there during the fourth hour? 1 21 4 20 The number of visitors at 4 hours is 4 visitors. This is the value that is directly at the value at 4 on the horizontal axis. Scatterplot I need help with this question 11 The third quartile (Q3) value from this box plot is __________. 37 29 48 60 The value for Q3 is the right edge of the box, which in this figure is 48. Five Number Summary and Boxplots I need help with this question 12 Shawna reads a scatterplot that displays the relationship between the number of cars owned per household and the average number of citizens who have health insurance in neighborhoods across the country. The plot shows a strong positive correlation. Shawna recalls that correlation does not imply causation. In this example, Shawna sees that increasing the number of cars per household would not cause members of her community to purchase health insurance. Identify the lurking variable that is causing an increase in both the number of cars owned and the average number of citizens with health insurance. The number of citizens in the United States Average mileage per vehicle The number of cars on the road Average income per household Recall that a lurking variable is something that must be related to the outcome and explanatory variable that when considered can help explain a relationship between 2 variables. Since higher income is positively related to owning more cars and having health insurance, this variable would help explain why we see this association. Correlation and Causation I need help with this question 13 Select the statement that correctly describes a Type I error. A Type I error occurs when the null hypothesis is rejected when it is actually true. A Type I error occurs when the null hypothesis is accepted when it is actually true. A Type I error occurs when the null hypothesis is accepted when it is actually false. A Type I error occurs when the null hypothesis is rejected when it is actually false. Recall a Type I error is when we incorrectly reject a true null hypothesis. So we would reject using sample evidence, when in fact it was not true. Type I/II Errors I need help with this question 14 Select the following statement that describes overlapping events. Amanda understands that she cannot get a black diamond when playing poker. Amanda wants a black card so she can have a winning hand, and she receives the two of hearts. Amanda rolls a three when she needed to roll an even number. Receiving a Jack of diamonds meets the requirement of getting both a Jack and a diamond. Events are overlapping if the two events can both occur in a single trial of a chance experiment. Since she wants a Jack {Jack of Hearts, Jack of Clubs, Jack of Diamonds, Jack of Spades} and a diamond {Ace, 2, 3, 4, 5, 6, 7, 8, 9, 10, Jack, Queen, or King: all as diamonds}, the overlap is Jack of Diamonds. Overlapping Events I need help with this question 15 Consider the histogram showing the weights of babies born in a hospital over a month. What is the difference in the weights of the lightest baby and the heaviest baby born in the hospital? 6 pounds 7.5 pounds 3 pounds 5.5 pounds If we look at the histogram, the heaviest baby is 10 lbs and the lightest baby is about 4.5 lbs. So the difference between the heaviest and lightest baby would be: Histograms I need help with this question 16 At Jeremy's school, the final grade for his Human Biology course is weighted as follows: Tests: 50% Quizzes: 35% Homework: 15% Jeremy has an average of 94% on his tests, 78% on his quizzes, and 62% on his homework. What is Jeremy's weighted average? 78% 83.6% 75.6% 74.8% In order to get the weighted average we use the following formula: Weighted Mean I need help with this question 17 Which of the following symbols represents a statistic? For something to be a statistic, it must come from a sample. Recall that p with hat on topis the sample proportion, which is a statistic. Sample Statistics and Population Parameters I need help with this question 18 What is the probability of drawing a spade or a jack from a standard deck of 52 cards? Since it is possible for a card to be a spade and a jack, these two events are overlapping. We can use the following formula: In a standard deck of cards, there are 13 cards that have Spade as their suit, so . There is a total of 4 Jacks, so . Of the 4 Jacks, only one is spade so . "Either/Or" Probability for Overlapping Events I need help with this question 19 Select the false statement about ANOVA. If a researcher wants to compare the mean wages of females in different age groups at a particular company, he or she should not use an ANOVA because the population means are unknown. If a researcher wants to compare the mean wages of females in different age groups at a particular company to the mean wages of males in different age groups at the same company, the researcher should use a Two-Way ANOVA test. A one-way ANOVA hypothesis test considers comparisons between populations based on one characteristic, while a two-way ANOVA hypothesis test considers comparisons between populations based on multiple characteristics. If a researcher wants to study the effectiveness of three brands of nicotine patches, the researcher should use a One-Way ANOVA test. If performing a statistical test, we don't need to know the population values. This is true for one-way ANOVA. We use the sample evidence to determine if the means between groups in population are equal. One-Way ANOVA/Two-Way ANOVA I need help with this question 20 For the plot below the value of r2 is 0.7783. Which of the following sets of statements is true? About 22% of the variation in ticket price can be explained by the distance flown. The correlation coefficient, r, is 0.606. About 78% of the variation in ticket price can be explained by the distance flown. The correlation coefficient, r, is 0.882. About 78% of the variation in distance flown can be explained by the ticket price. The correlation coefficient, r, is 0.606. About 88% of the variation in ticket price can be explained by the distance flown. The correlation coefficient, r, is 0.882. The coefficient of determination measures the percent of variation in the outcome, y, explained by the regression. So a value of 0.7783 tells us the regression with distance, x, can explain about 77.8% of the variation in cost, y. We can also note that r = . Coefficient of Determination/r^2 I need help with this question 21 Using this Venn diagram, what is the probability that event A or event B occurs? 0.41 0.68 0.36 0.77 To find the probability that event A or event B occurs, we can use the following formula for overlapping events: The probability of event A is ALL of circle A, or 0.24 + 0.41 = 0.65. The probability of event B is ALL of circle B, or 0.12 + 0.41 = 0.53. The probability of event A and B is the intersection of the Venn diagram, or 0.41. We can also simply add up all the parts = 0.24 + 0.41 + 0.12 = 0.77. "Either/Or" Probability for Overlapping Events I need help with this question 22 Which of the following statements about a positively skewed distribution is true? The distribution of the data tails to the right of the median. The mean, median, and mode have the same values. The distribution of the data features two modes. The distribution of the data tails to the left of the median. Skewness refers to how the data trends to the left or right. If a dataset is skewed, it is not symmetric. The direction of the tail of a distribution tells you which direction the skew lies. If there is positive skew, this implies the skew is to the right. If the distribution trends to the right, it will have a mean that is larger than the median due to those higher values. Shapes of Distribution I need help with this question 23 The scatterplot below charts the performance of an electric motor. Which answer choice correctly indicates the explanatory variable and the response variable of the scatterplot? Explanatory variable: Voltage Response variable: Rotation Explanatory variable: Rotation Response variable: Electric motor Explanatory variable: Rotation Response variable: Voltage Explanatory variable: Voltage Response variable: Electric motor The explanatory variable is what is along the horizontal axis, which is voltage. The response variable is along the vertical axis, which is speed of rotation. Explanatory and Response Variables I need help with this question 24 The data below shows the heights in inches of 10 students in a class. Student Height, in inches Student 1 53 Student 2 52.5 Student 3 54 Student 4 51 Student 5 50.5 Student 6 49.5 Student 7 48 Student 8 53 Student 9 52 Student 10 50 The standard error of the sample mean for this set of data is __________. Answer choices are rounded to the hundredths place. 1.77 0.19 0.59 1.87 In order to get the standard error of the mean, we can use the following formula: fraction numerator s over denominator square root of n end fraction, where is the standard deviation and is the sample size. Either calculate by hand or use Excel to find the standard deviation, which is 1.87. The sample size is 10 students. The standard error is then: Calculating Standard Error of a Sample Mean I need help with this question 25 What is the theoretical probability of drawing a king from a well shuffled deck of 52 cards? Recall that there are four kings in a standard deck of cards. The probability of a king is: Theoretical Probability/A Priori Method I need help with this question © 2020 SOPHIA Learning, LLC. SOPHIA is a registered trademark of SOPHIA Learning, LLC. About Contact Us Privacy Policy Terms of Use [Show More]
Last updated: 4 weeks ago
Preview 1 out of 21 pages
Reviews( 5 )

by Pickett · 3 years ago
IDK yet i havent got to review the docuent but i have to rate first
It's all good. Thank you. by QuizMaster. 3 years ago
by QuizMaster · 3 years ago
It's all good. Thank you.
by jenndurham70 · 3 years ago
did not help me on the exam at all. none of the questions that are on the study guide are on try final! DO NOT WASTE YOUR MONEY
by AUTUMN CALLIHAN · 2 years ago
Welcome. All the best in your studies. by QuizMaster. 2 years ago
by QuizMaster · 2 years ago
Welcome. All the best in your studies.
Recommended For You
*NURSING> SOPHIA Milestone > SOPHIA Statistics Final Milestone. With Compete Solutions (All)
SOPHIA Statistics Final Milestone. With Compete Solutions
Sophia Statistics Final Milestone
By Good grade , Uploaded: Aug 12, 2020
$9.5
Statistics> SOPHIA Milestone > Sophia Statistics FINAL Milestone. With RATIONALE and CONCEPT. (All)
Sophia Statistics FINAL Milestone. With RATIONALE and CONCEPT.
Sophia Statistics FINAL Milestone. With RATIONALE and CONCEPT.
By quizprof , Uploaded: Mar 17, 2021
$10
Religious Studies> SOPHIA Milestone > APPROACHES TO STUDYING RELIGIONS FINAL MILESTONE (All)
APPROACHES TO STUDYING RELIGIONS FINAL MILESTONE
APPROACHES TO STUDYING RELIGIONS FINAL MILESTONE
By Reviewnurse , Uploaded: Mar 12, 2021
$10
Art> SOPHIA Milestone > SOPHIA art history unit 1 milestone,100% CORRECT (All)
SOPHIA art history unit 1 milestone,100% CORRECT
Which of the following is the correct definition of a curator? 2 While artists like Henri Matisse used traditional media, including oil paint on canvas, artists in the later 20th century exp...
By securegrades , Uploaded: Oct 12, 2020
$11
Social Sciences> SOPHIA Milestone > HUM 111 Sophia Art History 1 Milestone 2. Strayer University – A Grade (All)
HUM 111 Sophia Art History 1 Milestone 2. Strayer University – A Grade
HUM 111 Sophia Art History 1 Milestone 2 {2020} – Strayer University 1 Which of the following best describes this sculpture? • Subject is depicted in the Flavian style • Subject is portr...
By Elli , Uploaded: Jan 07, 2021
$12
Biology> SOPHIA Milestone > HUMAN BIOLOGY Sophia Learning -Milestone Study Guide Revisions, 17 Updated Study Guide, Correctly Answered Questions, (All)
HUMAN BIOLOGY Sophia Learning -Milestone Study Guide Revisions, 17 Updated Study Guide, Correctly Answered Questions,
Sophia Learning - HUMAN BIOLOGY - Milestone Study Guide Revisions, 17 Updated Study Guide, Correctly Answered Questions, Test bank Questions and Answers with Explanations (latest Update), 100% Correct...
By TopScholar , Uploaded: Feb 01, 2021
$13
History> SOPHIA Milestone > Introduction to Art History SOPHIA Milestone UNIT 2. Passed this Milestone All questions were answered correctly. SOPHIA Learning (All)
Introduction to Art History SOPHIA Milestone UNIT 2. Passed this Milestone All questions were answered correctly. SOPHIA Learning
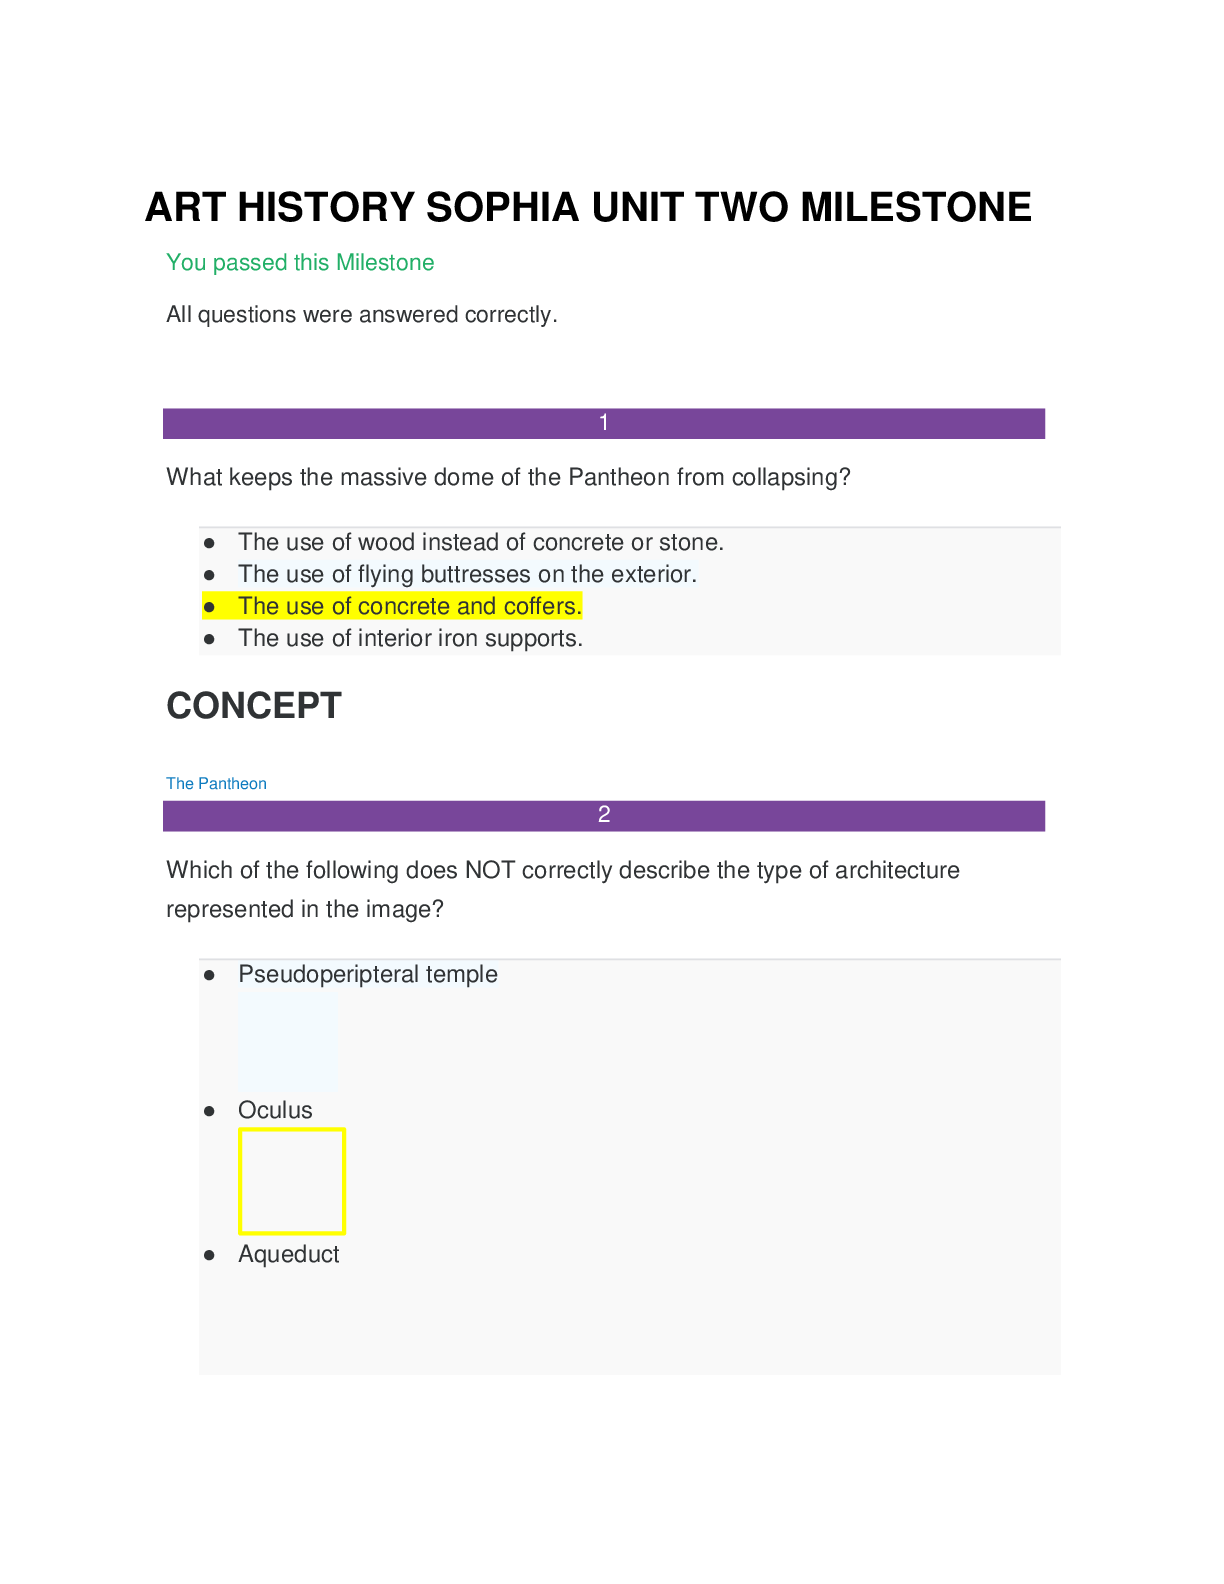
ART HISTORY SOPHIA UNIT 2 MILESTONE You passed this Milestone All questions were answered correctly. 1 What keeps the massive dome of the Pantheon from collapsing? ● The use of wood instead of co...
By QuizMaster , Uploaded: Oct 26, 2020
$10
Statistics> SOPHIA Milestone > Sophia Statistics Unit 1 Milestone, Revised, answers/ Rationale. (All)
Sophia Statistics Unit 1 Milestone, Revised, answers/ Rationale.
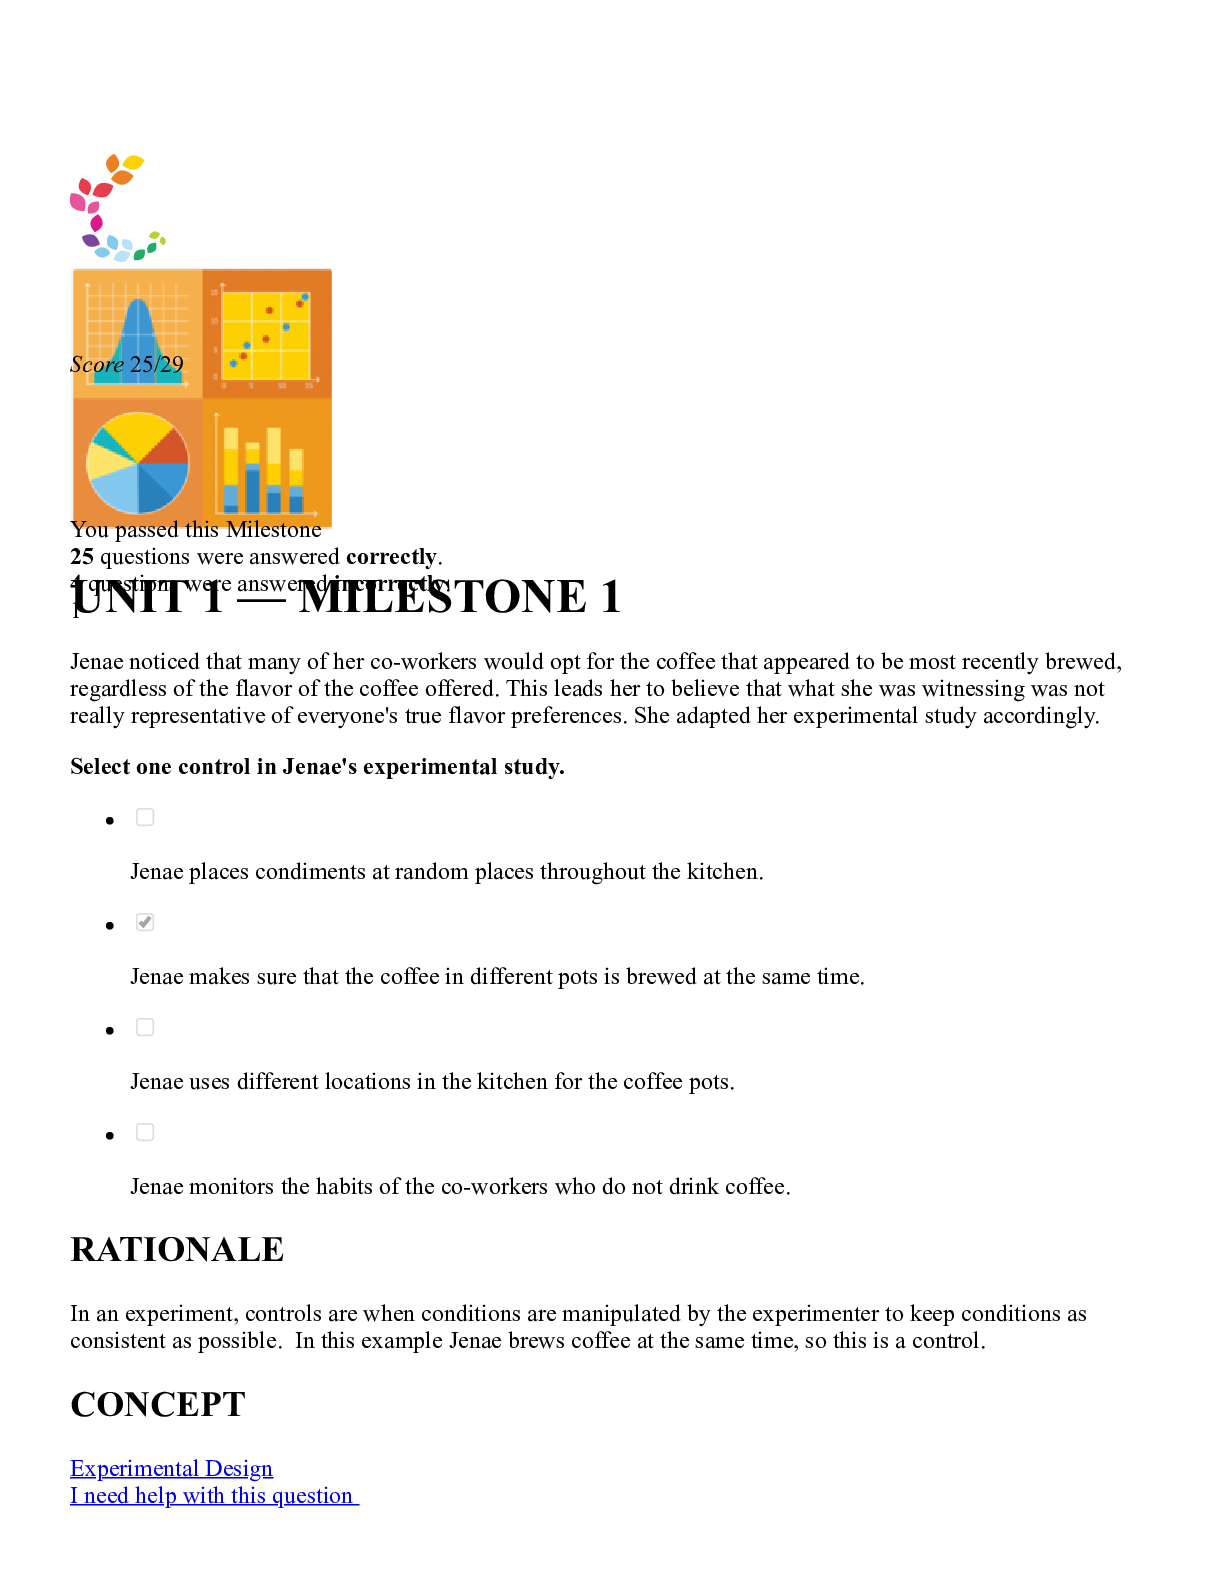
UNIT 1 — MILESTONE 1 Score 25/29 You passed this Milestone 25 questions were answered correctly. 4 questions were answered incorrectly. 1 Jenae noticed that many of her co-workers would opt for...
By Expert1 , Uploaded: Jul 30, 2020
$10
Environmental Science> SOPHIA Milestone > Environmental Science Final Milestone | All answers are 100% correct | Graded A+ (All)
Environmental Science Final Milestone | All answers are 100% correct | Graded A+
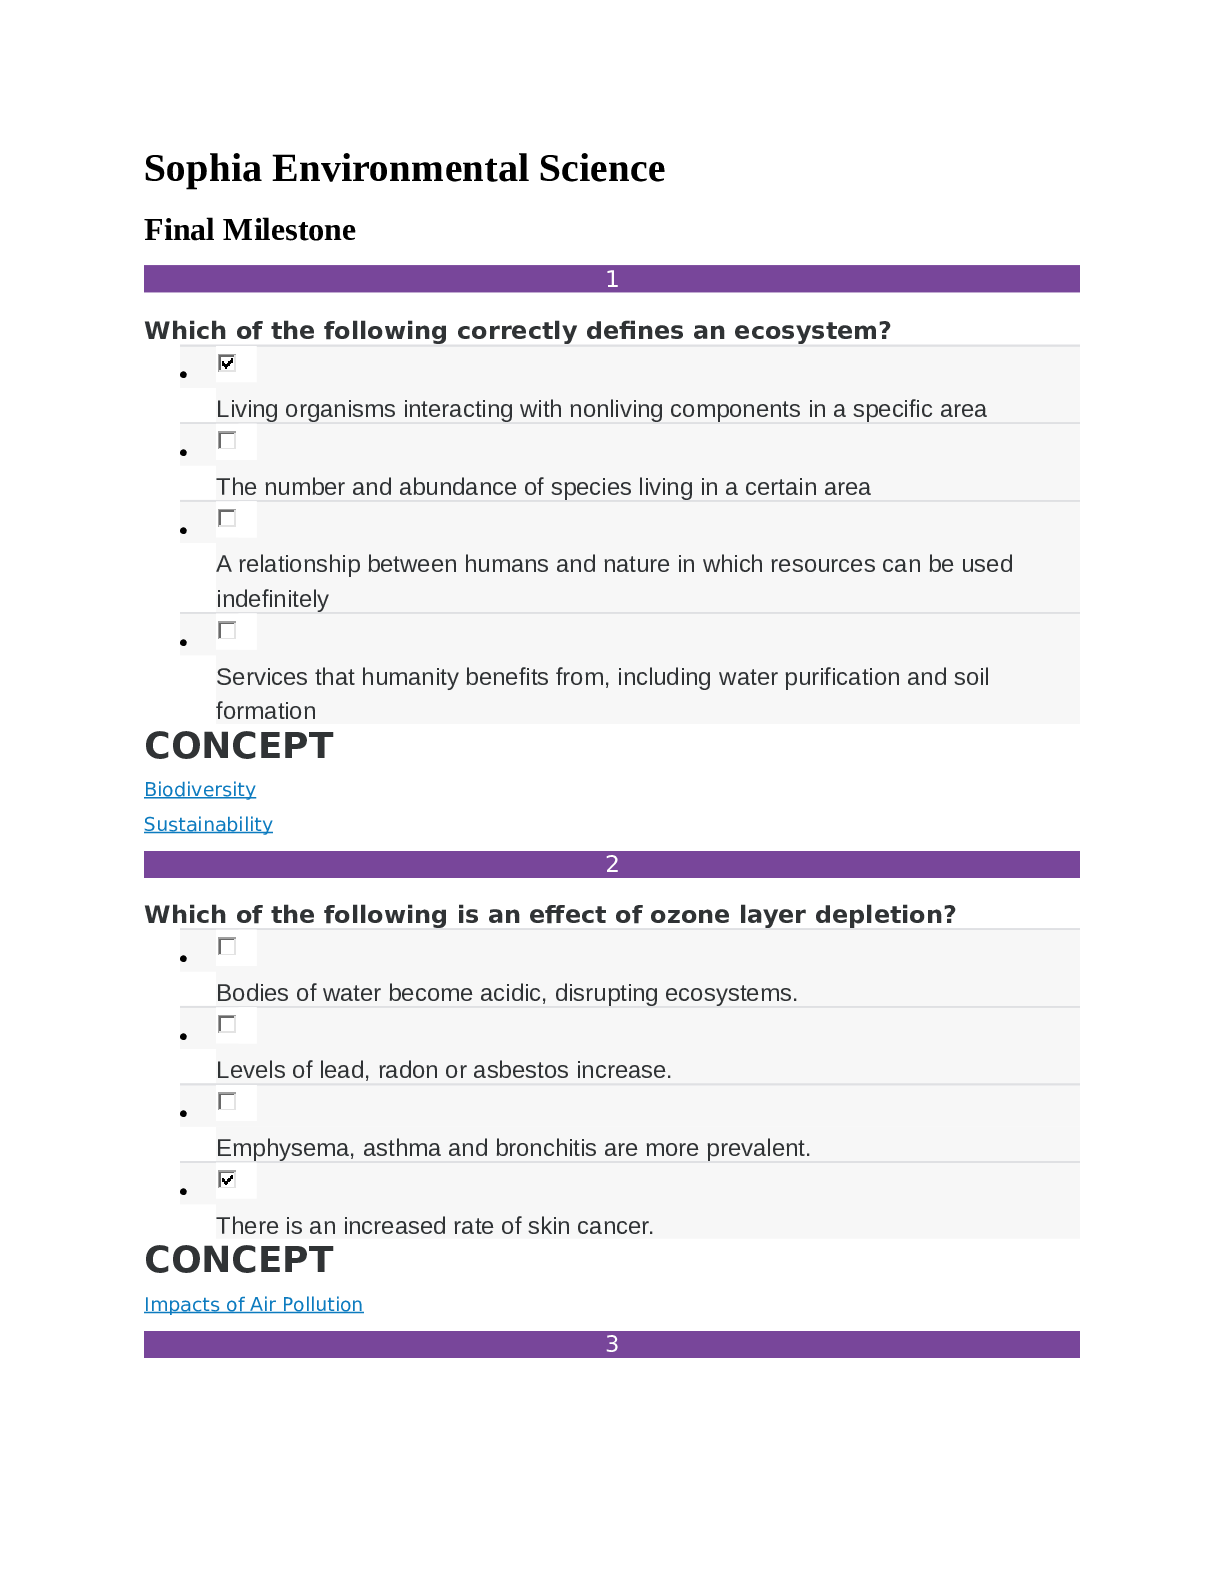
Which of the following correctly defines an ecosystem? Living organisms interacting with nonliving components in a specific area The number and abundance of species living in a certain area ...
By Dr Medina Reed , Uploaded: Aug 27, 2022
$9
Information Technology> SOPHIA Milestone > Sophia Intro to IT Milestone Final. Sophia University - IT 100 | Already passed. (All)
Sophia Intro to IT Milestone Final. Sophia University - IT 100 | Already passed.
Sophia Intro to IT Milestone Final Score 24/25 1 Game Changer Technologies has four software teams. Each of them is developing four different examples of its new game app. Which software develop...
By Expert1 , Uploaded: Aug 14, 2020
$10
Document information
Connected school, study & course
About the document
Uploaded On
Oct 15, 2020
Number of pages
21
Written in

Additional information
This document has been written for:
Uploaded
Oct 15, 2020
Downloads
3
Views
607