Mathematics > EXAM > MAT 300 Unit 4 Milestone 4 Sophia,100% CORRECT (All)
MAT 300 Unit 4 Milestone 4 Sophia,100% CORRECT
Document Content and Description Below
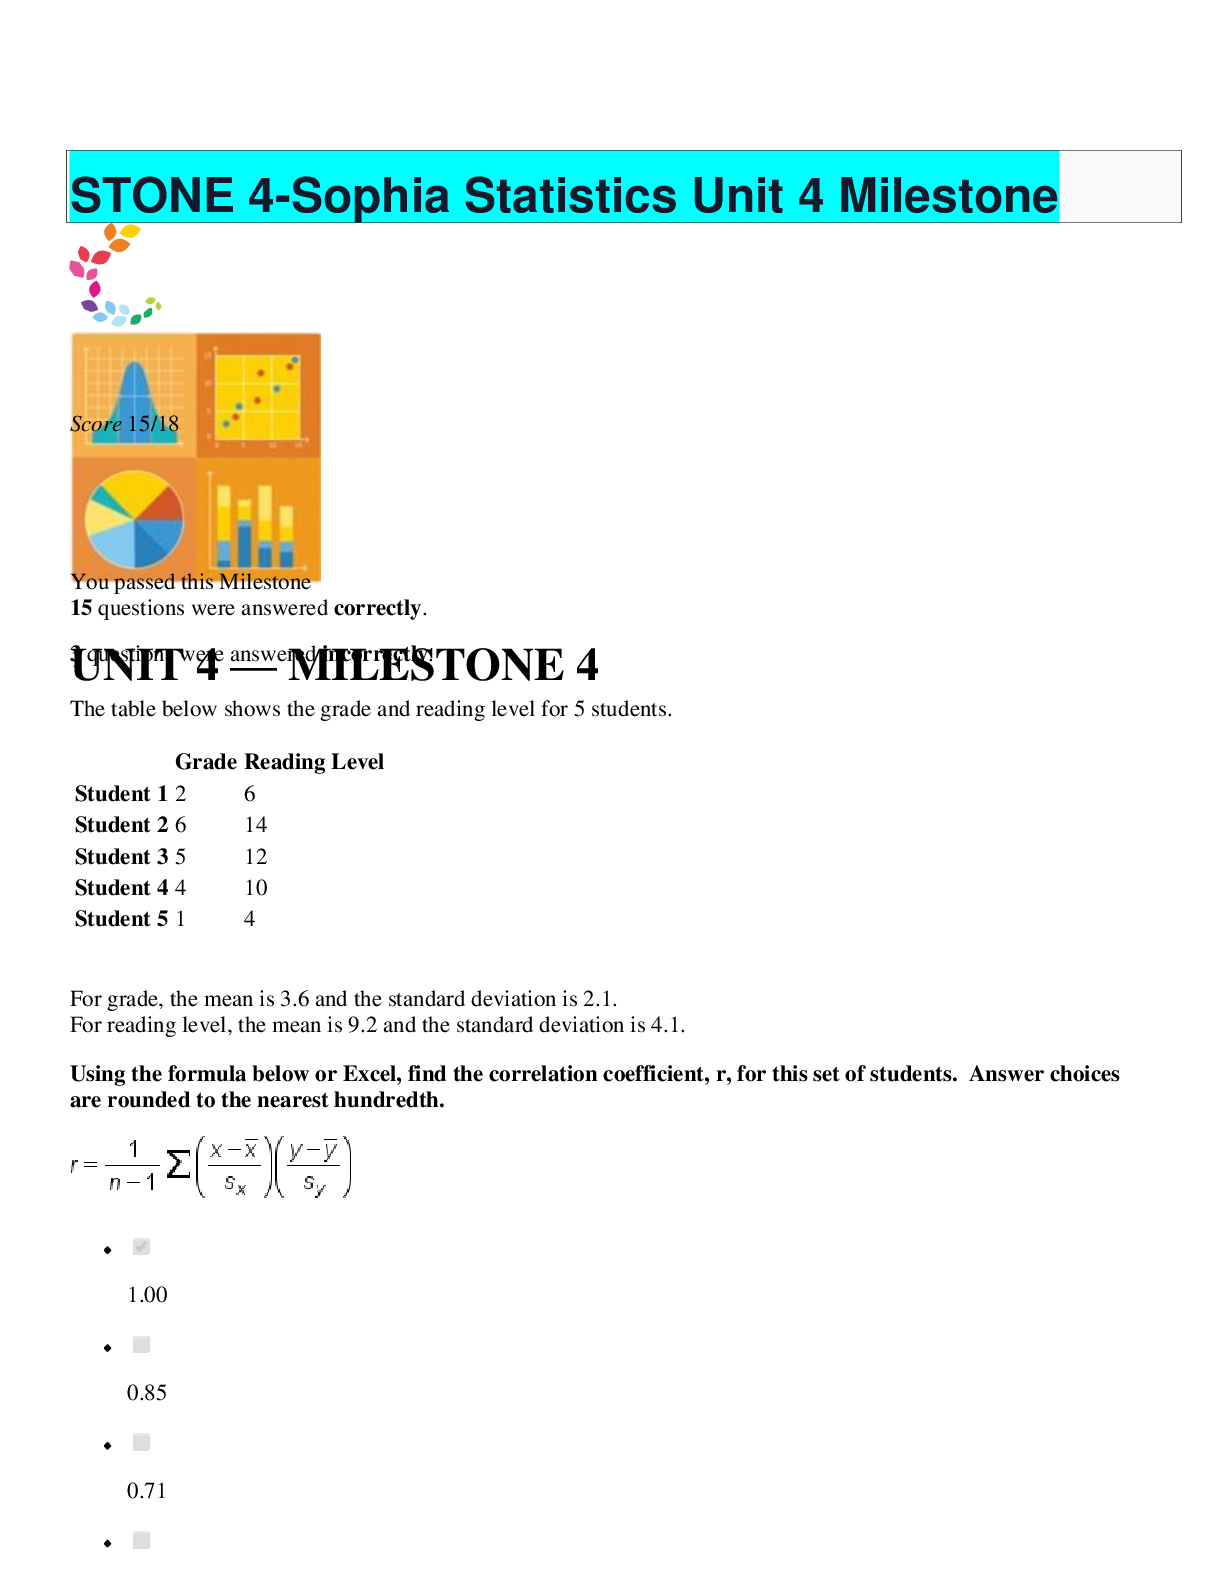
Which statement about correlation is FALSE? • The correlation of a data set can be positive, negative, or 0. • Correlation is used to define the variables of only non-linearly related data... sets. • Correlation between the variables of the data set can be measured. • Correlation is the degree to which the two variables of a data set resemble each other. 2 Which of the following is a guideline for establishing causality? • Keep all variables the same to get duplicate results. • Do not consider other possible causes. • Check if the effect is present or absent when the response variable is present or absent. • Look for cases where correlation exists between the variables of a scatterplot. 3 Data for weight (in pounds) and age (in months) of babies is entered into a statistics software package and results in a regression equation of ŷ = 17 + 0.8x. What is the correct interpretation of the slope if the weight is the response variable and the age is the explanatory variable? • The weight of a baby decreases by 0.8 pounds, on average, when the baby's age increases by 1 month. • The weight of a baby increases by 0.8 pounds, on average, when the baby's age increases by 1 month. • The weight of a baby decreases by 17 pounds, on average, when the baby's age increases by 1 month. • The weight of a baby increases by 17 pounds, on average, when the baby's age increases by 1 month. 4 Jesse takes two data points from the weight and feed cost data set to calculate a slope, or average rate of change. A hamster weighs half a pound and costs $2 per week to feed, while a Labrador Retriever weighs 62.5 pounds and costs $10 per week to feed. Using weight as the explanatory variable, what is the slope of a line between these two points? Answer choices are rounded to the nearest hundredth. • $7.75 / lb. • $0.13 / lb. • $6.25 / lb. • $4.00 / lb. 5 For a set of data, x is the explanatory variable. Its mean is 8.2, and its standard deviation is 1.92. For the same set of data, y is the response variable. Its mean is 13.8, and its standard deviation is 3.03. The correlation was found to be 0.223. Select the correct slope and y-intercept for the least-squares line. • Slope = 0.35 y-intercept = 10.9 • Slope = -0.35 y-intercept = 10.9 • Slope = 0.35 y-intercept = -10.9 • Slope = -0.35 y-intercept = -10.9 6 Thomas was interested in learning more about the salary of a teacher. He believed as a teacher increases in age, the annual earnings also increases. The age (in years) is plotted against the earnings (in dollars) as shown below. Using the best-fit line, approximately how much money would a 45-year-old teacher make? • $50,000 • $55,000 • $58,000 • $48,000 7 Shawna finds a study of American men that has an equation to predict weight (in pounds) from height (in inches): ŷ = -210 + 5.6x. Shawna's dad’s height is 72 inches and he weighs 182 pounds. What is the residual of weight and height for Shawna's dad? • -11.2 pounds • 809.2 pounds • 193.2 pounds • 11.2 pounds 8 Which of the following statements is TRUE? • Only a correlation of 0 implies causation. • High correlation does not always imply causation. • High correlation always implies causation. • Only a correlation of 1 implies causation. 9 For the data plotted in the scatterplot, the r2 value was calculated to be 0.9846. Which of the following sets of statements is true? • 98.5% of the variation in age is explained by a nonlinear relationship with yearly income. The correlation coefficient, r, is 0.969. • 98.5% of the variation in yearly income is explained by a linear relationship with age. The correlation coefficient, r, is 0.992 • 98.5% of the variation in yearly income is explained by a nonlinear relationship with age. The correlation coefficient, r, is 0.992. • 98.5% of the variation in age is explained by a linear relationship with yearly income. The correlation coefficient, r, is 0.969. 10 Alice reads a scatterplot that shows data for nine schools. It relates the percentage of students receiving free lunches to the percentage of students wearing a bicycle helmet. The plot shows a strong negative correlation. Alice recalls that correlation does not imply causation. In this example, Alice sees that increasing the percentage of free lunches would not cause children to use their bicycle helmets less. Identify the confounding variable that is causing Alice's observed association. • School funding • The number of free lunches available • Parents' income • The number of bike helmets available 11 Which of the following scatterplots shows a correlation affected by inappropriate grouping? • • • • 12 Which of the following scatterplots shows an outlier in the x-direction? • • • • 13 The scatterplot below shows the relationship between the grams of fat and total calories in different food items. The equation for the least-squares regression line to this data set is . What is the predicted number of total calories for a food item that contains 25 grams of fat? • 417.56 • 549.54 • 483.55 • 383.55 14 Raoul lives in Minneapolis and he is planning his spring break trip. He creates the scatterplot below to assess how much his trip will cost. Which answer choice correctly indicates the explanatory and response variables for the scatterplot? • Explanatory variable: Miles flown Response variable: Minneapolis • Explanatory variable: Cost Response variable: Distance • Explanatory variable: Minneapolis Response variable: Miles flown • Explanatory variable: Distance Response variable: Cost 15 The table below shows the grade and reading level for 5 students. Grade Reading Level Student 1 2 6 Student 2 6 14 Student 3 5 12 Student 4 4 10 Student 5 1 4 For grade, the mean is 3.6 and the standard deviation is 2.1. For reading level, the mean is 9.2 and the standard deviation is 4.1. Using the formula below or Excel, find the correlation coefficient, r, for this set of students. Answer choices are rounded to the nearest hundredth. • 0.71 • 1.00 • 0.92 • 0.85 16 A correlation coefficient between average temperature and coat sales is most likely to be __________. • between -1 and -2 • between 0 and -1 • between 0 and 1 • between 1 and 2 17 This scatterplot shows the performance of an electric motor using the variables speed of rotation and voltage. Select the answer choice that accurately describes the data's form, direction, and strength in the scatterplot. • Form: The data points appear to be in a straight line. Direction: The speed of rotation increases with an increase in voltage. Strength: The data points are closely concentrated. • Form: The data points appear to be in a straight line. Direction: The voltage increases as the speed of rotation increases. Strength: The data points are closely concentrated. • Form: The data points are arranged in a curved line. Direction: The speed of rotation increases with an increase in voltage. Strength: The data points are far apart from each other. • Form: The data points are arranged in a curved line. Direction: The voltage increases as the speed of rotation increases. Strength: The data points are far apart from each other. 18 A bank manager declares, with help of a scatterplot, that the number of health insurances sold may have some association with the number of inches it snows. How many policies were sold when it snowed 2 to 4 inches? • 210 • 470 • 240 • 350 MAT 300 Unit 4 Milestone 4 Exam Answer Sophia Course 1 Data for weight (in pounds) and age (in months) of babies is entered into a statistics software package and results in a regression equation of ŷ = 17 + 0.8x. What is the correct interpretation of the slope if the weight is the response variable and the age is the explanatory variable? • The weight of a baby increases by 0.8 pounds, on average, when the baby's age increases by 1 month. • The weight of a baby increases by 17 pounds, on average, when the baby's age increases by 1 month. • The weight of a baby decreases by 17 pounds, on average, when the baby's age increases by 1 month. • The weight of a baby decreases by 0.8 pounds, on average, when the baby's age increases by 1 month. 2 Fred Anderson, an artist, has recorded the number of visitors who visited his exhibit in the first 8 hours of opening day. He has made a scatter plot to depict the relationship between the number of hours and the number of visitors. How many visitors were there during the fourth hour? • 4 • 20 • 1 • 21 3 The scatterplot below shows the relationship between the grams of fat and total calories in different food items. The equation for the least-squares regression line to this data set is . What is the predicted number of total calories for a food item that contains 25 grams of fat? • 483.55 • 549.54 • 417.56 • 383.55 4 Which of the following scatterplots shows an outlier in both the x- and y-direction? • • • • • 5 For this scatterplot, the r2 value was calculated to be 0.9382. Which of the following set of statements is true? • About 94% of the variation in beach visitors can be explained by a positive linear relationship with daily temperature. The correlation coefficient, r, is 0.969. • About 94% of the variation in beach visitors is explained by a negative linear relationship with daily temperatures. The correlation coefficient, r, is 0.969. • There is no strong correlation in the linear association between beach visitors and daily temperatures. The correlation coefficient, r, is 0.880 • About 94% of the variation in daily temperature can be explained by a positive linear relationship with beach visitors. The correlation coefficient, r, is 0.880 6 Shawna reads a scatterplot that displays the relationship between the number of cars owned per household and the average number of citizens who have health insurance in neighborhoods across the country. The plot shows a strong positive correlation. Shawna recalls that correlation does not imply causation. In this example, Shawna sees that increasing the number of cars per household would not cause members of her community to purchase health insurance. Identify the lurking variable that is causing an increase in both the number of cars owned and the average number of citizens with health insurance. • Average mileage per vehicle • The number of cars on the road • The number of citizens in the United States • Average income per household I need help with this question 7 A basketball player recorded the number of baskets he could make depending on how far away he stood from the basketball net. The distance from the net (in feet) is plotted against the number of baskets made as shown below. Using the best-fit line, approximately how many baskets can the player make if he is standing ten feet from the net? • 9 baskets • 8 baskets • 3 baskets • 5 baskets 8 Jesse takes two data points from the weight and feed cost data set to calculate a slope, or average rate of change. A rat weighs 3.5 pounds and costs $4.50 per week to feed, while a Beagle weighs 30 pounds and costs $9.20 per week to feed. Using weight as the explanatory variable, what is the slope of the line between these two points? Answer choices are rounded to the nearest hundredth. • $0.18 / lb. • $5.64 / lb. • $0.31 / lb. • $1.60 / lb. I need help with this question 9 The scatterplot below charts the performance of an electric motor. Which answer choice correctly indicates the explanatory variable and the response variable of the scatterplot? • Explanatory variable: Voltage Response variable: Electric motor • Explanatory variable: Rotation Response variable: Voltage • Explanatory variable: Voltage Response variable: Rotation • Explanatory variable: Rotation Response variable: Electric motor 10 Given the information below, what is the slope and y-intercept for the least-squares line of the Quiz 1 scores and Test scores? Answer choices are rounded to the hundredths place. • Slope = 0.54 y-intercept = 1.71 • Slope = 0.60 y-intercept = 7.16 • Slope = 0.60 y-intercept = 1.22 • Slope = 0.54 y-intercept = 1.22 11 This scatterplot shows the performance of a thermocouple using the variables temperature difference and voltage. Select the answer choice that accurately describes the data's form, direction, and strength in the scatterplot. • Form: The data pattern is nonlinear. Direction: There is a positive association between temperature difference and voltage. Strength: The data pattern is weak. • Form: The data pattern is linear. Direction: There is a negative association between temperature difference and voltage. Strength: The data pattern is strong. • Form: The data pattern is nonlinear. Direction: There is a negative association between temperature difference and voltage. Strength: The data pattern is weak. • Form: The data pattern is linear. Direction: There is a positive association between temperature difference and voltage. Strength: The data pattern is strong. 12 Which of the following statements is TRUE? • A high correlation is insufficient to establish causation on its own. • If the two variables of a scatterplot are strongly related, this condition implies causation between the two variables. • Only a correlation equal to 0 implies causation. • A correlation of 1 or -1 implies causation. 13 A correlation coefficient between average temperature and coat sales is most likely to be __________. • between 1 and 2 • between 0 and 1 • between 0 and -1 • between -1 and -2 14 The scores of the quizzes of five students in both English and Science are: Student English Science Student 1 6 8 Student 2 5 5 Student 3 9 6 Student 4 4 7 Student 5 8 9 For English, the mean is 6.4 and the standard deviation is 2.0. For Science, the mean is 7 and the standard deviation is 1.6. Using the formula below or Excel, find the correlation coefficient, r, for this set of scores. Answer choices are rounded to the nearest hundredth. • 0.05 • 0.50 • 0.23 • 0.42 15 Shawna finds a study of American women that had an equation to predict weight (in pounds) from height (in inches): ŷ = -260 + 6.6x. Shawna’s height was 64 inches and her weight was 150 pounds. What is the value of the residual for Shawna's weight and height? • 730 pounds • -12.4 pounds • 162.4 pounds • 12.4 pounds 16 Which of the following scatterplots shows a correlation affected by inappropriate grouping? • • • • 17 Which of the following is NOT a guideline for establishing causality? • Take into consideration all the other possible causes. • Keep all variables the same to get duplicate results. • Perform a randomized, controlled experiment. • Look for cases where correlation exists between the variables of a scatterplot. 18 Which statement about correlation is FALSE? • A correlation of -1 or 1 corresponds to a perfectly linear relationship. • Correlation is a quantitative measure of the strength of a linear association between two variables. • Correlation is a quantitative measure of the strength of a non-linear association between two variables. • Correlation is measured by r, the correlation coefficient which has a value between -1 and 1. [Show More]
Last updated: 1 year ago
Preview 1 out of 26 pages

Reviews( 0 )
Document information
Connected school, study & course
About the document
Uploaded On
Oct 10, 2020
Number of pages
26
Written in

Additional information
This document has been written for:
Uploaded
Oct 10, 2020
Downloads
0
Views
118