Mathematics > STUDY GUIDE > MATH225N Week 3 Quiz (Central Tendency Q & A) (2020, Latest): Chamberlain College of Nursing ( Grade (All)
MATH225N Week 3 Quiz (Central Tendency Q & A) (2020, Latest): Chamberlain College of Nursing ( Graded A)
Document Content and Description Below
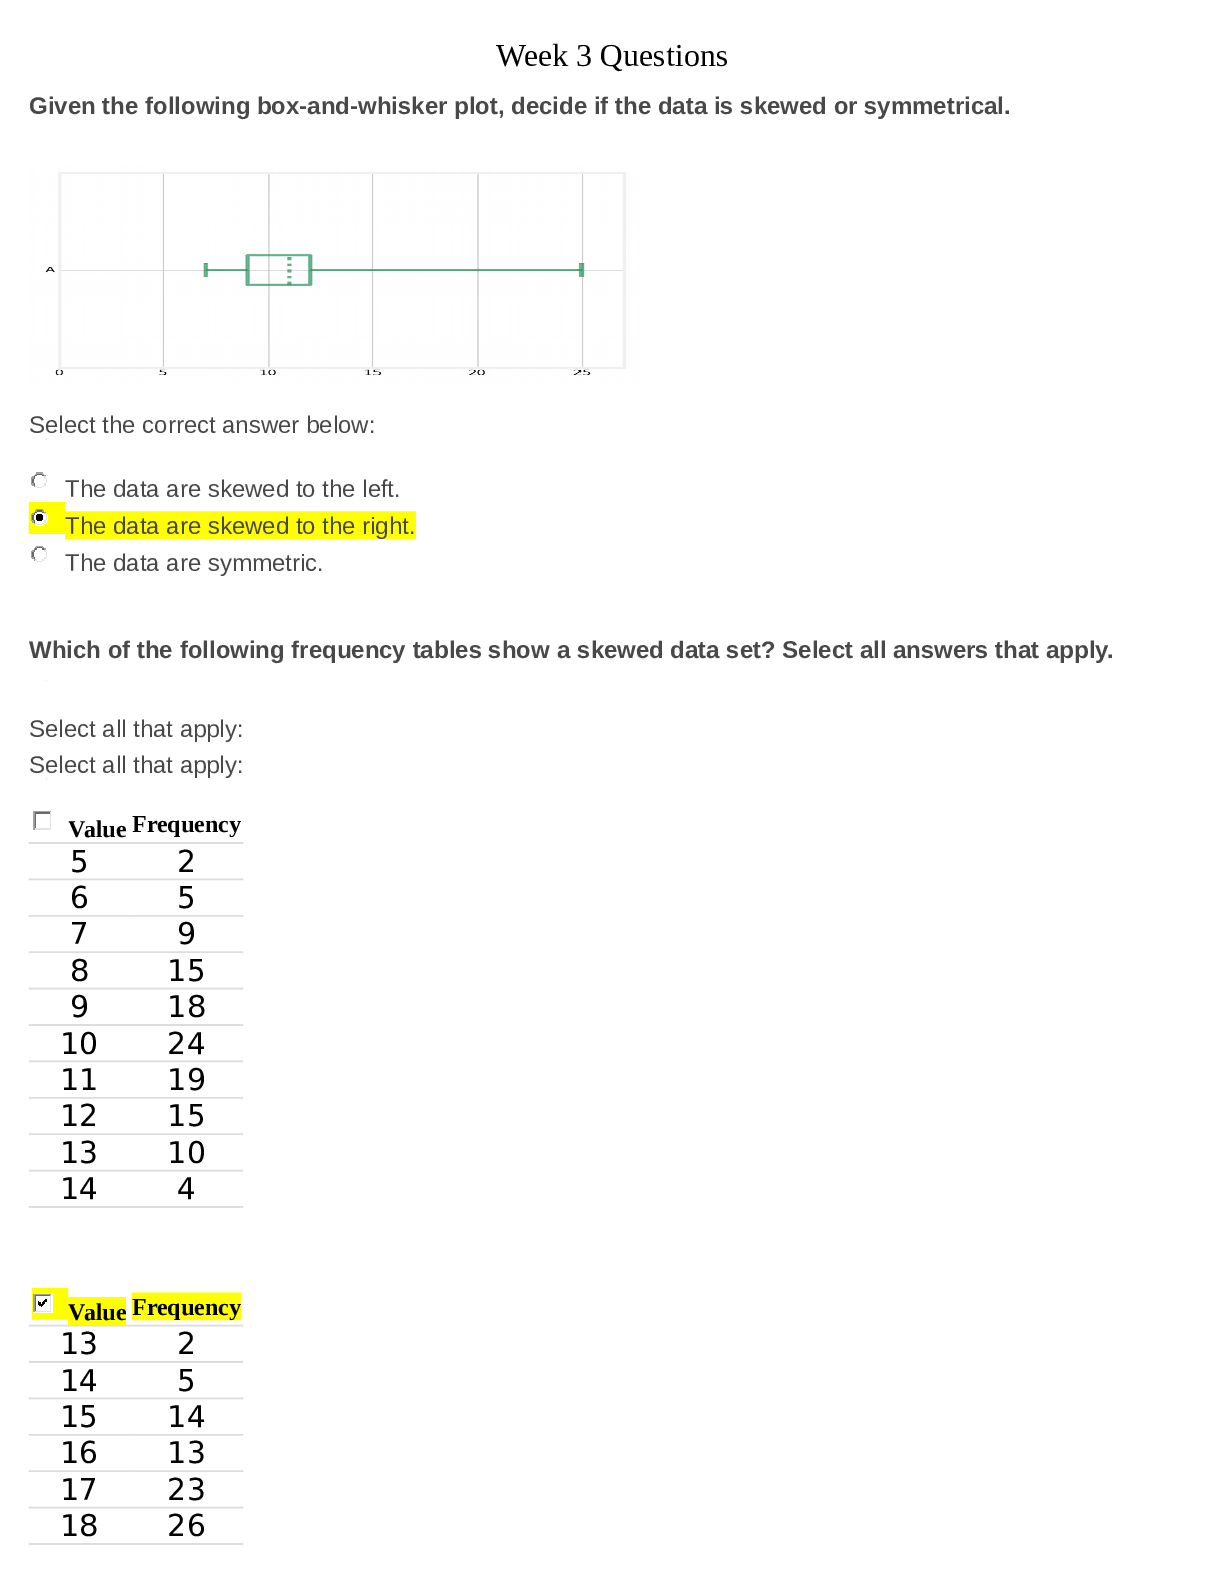
MATH225 Week 3 Quiz / MATH 225 Week 3 Quiz (Latest): Statistical reasoning for health sciences: Chamberlain College of Nursing MATH225N Week 3 Quiz / MATH 225N Week 3 Quiz (Central Tendency Q & A) (La... test): Statistical reasoning for health sciences: Chamberlain College of Nursing Given the following box-and-whisker plot, decide if the data is skewed or symmetrical. Select the correct answer below: ________________________________________ The data are skewed to the left. The data are skewed to the right. The data are symmetric. Which of the following frequency tables show a skewed data set? Select all answers that apply. ________________________________________ Select all that apply: Select all that apply: ________________________________________ Value Frequency 5 2 6 5 7 9 8 15 9 18 10 24 11 19 12 15 13 10 14 4 Value Frequency 13 2 14 5 15 14 16 13 17 23 18 26 19 15 20 2 Value Frequency 5 1 6 1 7 9 8 20 9 24 10 20 11 9 12 4 13 1 14 1 15 1 Value Frequency 0 4 1 12 2 23 3 28 4 17 5 7 6 6 7 3 Which of the following frequency tables show a skewed data set? Select all answers that apply. ________________________________________ Select all that apply: •Value Frequency 0 2 1 11 2 30 3 22 4 15 5 12 6 6 7 1 8 1 Value Frequency 4 1 5 2 6 3 7 7 8 19 9 17 10 17 11 15 12 12 13 4 14 1 15 2 Value Frequency 13 1 14 6 15 9 16 15 17 27 18 28 19 10 20 4 Value Frequency 3 1 4 0 5 1 6 5 7 9 8 12 9 12 10 18 11 12 12 17 13 11 14 0 15 1 16 0 17 1 Which of the following frequency tables shows a skewed data set? Select all answers that apply. ________________________________________ Select all that apply: ________________________________________ Value Frequency 7 4 8 8 9 12 10 16 11 15 12 13 13 10 14 5 Value Frequency 5 3 6 3 7 8 8 12 9 15 10 19 11 19 12 10 13 4 14 3 15 3 16 1 Value Frequency 12 1 13 2 14 3 15 13 16 10 17 26 18 25 19 15 20 5 Value Frequency 0 9 1 21 2 23 3 18 4 15 5 9 6 3 7 2 For the following dataset, you are interested to determine the "spread" of the data. Would you employ calculations for the sample standard deviation, or population standard deviation for this dataset: Ages of all students in a Statistics course with an enrollment of 30 students. ________________________________________ Select the correct answer below: ________________________________________ Use calculations for sample standard deviation Use calculations for population standard deviation Which of the following lists of data has the smallest standard deviation? ________________________________________ Select the correct answer below: ________________________________________ 11, 17, 9, 4, 4, 6, 6, 9, 8, 18 29, 21, 21, 28, 28, 26, 24, 24, 17, 23 6, 8, 10, 6, 8, 8, 10, 7, 10, 10 23, 19, 12, 19, 17, 18, 16, 10, 12, 21 17, 12, 6, 6, 15, 16, 20, 20, 5, 17 Remember that standard deviation is a measure of how spread out the values are. The list 6, 8, 10, 6, 8, 8, 10, 7, 10, 10 has the smallest standard deviation because its values are all relatively close together. Which of the data sets represented by the following histograms has the smallest standard deviation? A company is interested to know the variation in yearly sales amount for all 5 salespeople in the company. The dataset shown below is the sales amount sold by the 5 salespeople in the company (expressed in thousands of dollars): 40,60,65,70,80 Find the variance for this dataset. ________________________________________ Provide your answer below: ________________________________________ Variance = 176 (population “all’ Variance) The data below are the monthly average high temperatures for November, December, January, and February in New York City from the Country Studies/Area Handbook Series sponsored by the U.S. Department of the Army between 1986 and 1998. What is the sample standard deviation? 54,42,40,40 • Round the final answer to one decimal place. ________________________________________ Provide your answer below: 6.733 ________________________________________ The following data values represent the daily amount spent by a family during a 7 day summer vacation. Find the sample standard deviation of this dataset: $96, $125, $80, $110, $75, $100, $121 • Round the final answer to one decimal place. Answer 19.1 Which of the following lists of data has the smallest standard deviation? ________________________________________ Select the correct answer below: ________________________________________ 30, 21, 19, 17, 16, 32, 26, 25, 19, 16 5, 11, 15, 7, 5, 9, 8, 16, 14, 11 25, 24, 28, 18, 32, 34, 34, 22, 28, 19 17, 19, 17, 18, 17, 16, 16, 16, 17, 20 9, 16, 14, 22, 20, 9, 19, 16, 21, 8 Which of the following lists of data has the smallest standard deviation? ________________________________________ Select the correct answer below: ________________________________________ 13, 12, 12, 13, 11, 12, 12, 14, 13, 11 25, 26, 23, 17, 21, 28, 28, 23, 25, 16 5, 21, 13, 12, 19, 10, 16, 19, 8, 7 17, 16, 9, 10, 14, 6, 8, 16, 16, 2 33, 33, 30, 32, 31, 24, 28, 23, 24, 23 Find the median of the following set of miles per gallon for randomly selected sports cars. 36,22,24,30,44,13,21,34,18 ________________________________________ Provide your answer below:24 (arrange smallest to largest and find middle) Find the mode of the following number of times each machine in a car factory needed to be fixed within the last year. 2,5,6,12,14,12,6,2,5,3,14,5 ________________________________________ Provide your answer below:5 (# that occurs most often in the set) Laura runs at the park after school and wants to know the mean number of miles she runs. The numbers for the miles run each day so far are listed below. 8,9,7,13,3,9,14 Find the mean number of miles she runs daily. ________________________________________ Provide your answer below:9 (average of all numbers) An art collector bought 20 paintings at an art fair, and wants to know the average price of her new paintings. She adds the prices of all the paintings and divides this number by 20 to find an average price of $350 . Is this price a sample mean or a population mean, and which symbol would be used to denote it? ________________________________________ Select the correct answer below: ________________________________________ Population Mean μ Sample Mean x¯¯¯ Given the following list of the number of pens randomly selected students purchased in the last semester, find the median. 13,7,8,37,32,19,17,32,12,26 ________________________________________ Provide your answer below:18(because the list has length 10, which is even, we know the median number will be the average of the middle two numbers, 17 and 19. So the median number of pens randomly selected students purchased in the last semester is 18.) Find the mode of the following amounts of exercise (in hours) randomly selected runners completed during a weekend. 2,14,14,4,2,4,1,14,4,4,8 ________________________________________ Provide your answer below:4 (Note that 4 occurs 4 times, which is the greatest frequency) ________________________________________ Find the mode of the following list of points earned on a 16 point quiz given during a finance class. 7,7,3,2,7,16,12,16,12 ________________________________________ Provide your answer below:7 Find the median of the following set of data. 35,43,18,35,29,27,19,19 Give your answer as a number only. For example, if you found the median was 34, you would enter 34. ________________________________________ Provide your answer below:28 Each person in a group shuffles a deck of cards and keeps selecting a card until an ace appears. Find the mode of the following number of cards drawn from a deck until an ace appears. 14,10,7,14,9,9,10,12,9,7,12 ________________________________________ Provide your answer below:9 A grandfather wants to know the average height of all his grandchildren. He finds that the heights of his 9 grandchildren are given in inches by 63,71,60,59,74,60,60,75,58. What is the population mean of the height of his grandchildren in inches? Round your answer to the nearest tenth of an inch and do not include units. ________________________________________ Provide your answer below: 64.4 Given the following list of the number of pencils randomly selected students used in a school year, find the median. 10,22,6,7,19,5,27 ________________________________________ Provide your answer below:10 A teacher randomly selects 10 out of her 30 students and finds that the mean height of those 10 students is 5′2". Is this a sample mean or a population mean, and which symbol would be used to denote it? ________________________________________ Select the correct answer below: ________________________________________ Population Mean μ Sample Mean x¯¯¯ A data set lists the number of strikes scored per team during a bowling league championship. For this data set, the minimum is 2, the first quartile is 3, the median is 5, the third quartile is 7, and the maximum is 14. Construct a box-and-whisker plot that shows the number of strikes scored. ________________________________________ Provide your answer below: Given the following frequency table of data, what is the potential outlier? Value Frequency 11 1 12 2 13 12 14 6 15 7 16 2 17 0 18 0 19 0 20 0 21 0 22 0 23 1 ________________________________________ Select the correct answer below: ________________________________________ 11 14 12 13 23 (Note that most of the values are between 11 and 16, whereas 23 is far above the rest of the values. Therefore, 23 is the potential outlier.) Given the following frequency table of data, what is the potential outlier? Value Frequency 15 1 16 0 17 3 18 4 19 6 20 10 21 3 22 2 23 1 24 0 25 0 26 0 27 0 28 0 29 0 30 1 ________________________________________ Select the correct answer below: ________________________________________ 30 18 23 19 17 A data set lists the number of extra credit points awarded on midterm scores of 15 students taking a statistics course. For this data set, the minimum is 3, the median is 15, the third quartile is 16, the interquartile range is 4, and the maximum is 19. Construct a box-and-whisker plot that shows the extra credit points awarded. ________________________________________ Provide your answer below:Remember that the interquartile range is the third quartile minus the first quartile. Since we know the third quartile is 16, and the interquartile range is 4, we find that the first quartile must be 16−4=12. Find the Five-Number Summary of a Data Set Question Given the following list of data, what is the five-number summary? 10, 12, 14, 14, 14, 16, 17, 17, 17, 19, 19 ________________________________________ Select the correct answer below: ________________________________________ Min Q1 Median Q3 Max 10 12 15 18 19 Min Q1 Median Q3 Max 10 13 15 17 19 Min Q1 Median Q3 Max 10 15 17 18 19 Min Q1 Median Q3 Max 10 14 16 17 19 Min Q1 Median Q3 Max 10 14 15 18 19 The following frequency table summarizes a set of data. What is the five-number summary? "Value " " Frequency " "9 " " 3 " "10 " " 3 " "11 " " 1 " "13 " " 3 " "14 " " 1 " "15 " " 5 " "16 " " 1 " "17 " " 1 " "18 " " 1 " Select the correct answer below: ________________________________________ Min Q1 Median Q3 Max 9 11 14 16 18 Min Q1 Median Q3 Max 9 10 11 17 18 Min Q1 Median Q3 Max 9 11 15 16 18 Min Q1 Median Q3 Max 9 10 11 15 18 Min Q1 Median Q3 Max 9 10 13 15 18 The following frequency table summarizes a set of data. What is the five-number summary? "Value " " Frequency " "8 " " 2 " "9 " " 1 " "10 " " 2 " "11 " " 3 " "12 " " 4 " "13 " " 1 " "14 " " 1 " "16 " " 1 " Min Q1 Median Q3 Max 8 9 12 13 16 Min Q1 Median Q3 Max 8 10 11 12 16 Min Q1 Median Q3 Max 8 10 11 13 16 Min Q1 Median Q3 Max 8 10 11 15 16 The following frequency table summarizes a set of data. What is the five-number summary? "Value " " Frequency " "5 " " 3 " "6 " " 5 " "7 " " 2 " "8 " " 2 " "9 " " 3 " "12 " " 1 " "14 " " 3 " Min Q1 Median Q3 Max 5 6 7 9 14 Min Q1 Median Q3 Max 5 8 11 12 14 Min Q1 Median Q3 Max 5 7 9 10 14 Min Q1 Median Q3 Max 5 8 9 11 14 Given the following frequency table of data, what is the potential outlier? Value Frequency 7 1 8 0 9 0 10 0 11 0 12 0 13 0 14 2 15 7 16 4 17 5 18 6 19 5 20 1 7 (7 is the correct answer) 14 15 16 19 The five number summary for a set of data is given below. Min Q1 Median Q3 Max 68 70 74 80 88 What is the interquartile range of the set of data? Enter just the number as your answer. For example, if you found that the interquartile range was 25, you would enter 25. ________________________________________ Provide your answer below: 10 (Remember that the interquartile range is the third quartile minus the first quartile. So we find that the interquartile range is 80−70=10) The five number summary for a set of data is given below. Min Q1 Median Q3 Max 76 84 89 98 99 Using the interquartile range, which of the following are outliers? Select all correct answers. ________________________________________ Select all that apply: ________________________________________ • 6 • ________________________________________ • 42 • ________________________________________ • 97 • ________________________________________ • 111 • ________________________________________ • 116 Given the following frequency table of data, what is the potential outlier? Value Frequency 9 1 10 0 11 0 12 0 13 0 14 0 15 0 16 0 17 3 18 6 19 10 20 8 9 21 18 19 20 The five number summary for a set of data is given below. Min Q1 Median Q3 Max 67 68 80 81 86 What is the interquartile range of the set of data? ________________________________________ Select the correct answer below: ________________________________________ 19 13 9 3 23 The five number summary for a set of data is given below. Min Q1 Median Q3 Max 54 56 80 86 87 Using the interquartile range, which of the following are outliers? Select all correct answers. • 1 • ________________________________________ • 43 • ________________________________________ • 86 • ________________________________________ • 92 • ________________________________________ • 108 • Remember that outliers are numbers that are less than 1.5⋅IQR below the first quartile or more than 1.5⋅IQR above the third quartile, where IQR stands for the interquartile range. The interquartile range is the third quartile minus the first quartile. So we find • IQR=86−56=30 • So a value is an outlier if it is less than • Q1−1.5⋅IQR=56−(1.5)(30)=11 • or greater than • Q3 1.5⋅IQR=86 (1.5)(30)=131 • So we see that 1 is an outlier. A data set lists the number of hours each student, from a finance class, studied for a midterm. For this data set, the minimum is 3, the median is 6, the third quartile is 9, the interquartile range is 5, and the maximum is 17. Construct a box-and-whisker plot that shows the number of hours studied. Begin by first placing the middle dot on the median. Then work on placing the rest of the points starting with the ones closest to the median. Remember that the interquartile range is the third quartile minus the first quartile. Since we know the third quartile is 9, and the interquartile range is 5, we find that the first quartile must be 9−5=4. A data set lists the number of hours waiters worked at a restaurant every Friday during the last year. For this data set, the minimum is 1, the median is 5, the third quartile is 8, the interquartile range is 4, and the maximum is 17. Construct a box-and-whisker plot that shows the number of hours worked on a Friday. ________________________________________ Provide your answer below: Remember that the interquartile range is the third quartile minus the first quartile. Since we know the third quartile is 8, and the interquartile range is 4, we find that the first quartile must be 8−4=4. To construct the box-and-whisker plot, remember that the minimum value of the data (1) is at the end of the left whisker, the first quartile (4) is the left edge of the box, the median value (5) is the vertical line in the box, the third quartile (8) is the right edge of the box, and the maximum value (17) is the end of the right whisker. The following dataset represents the favorite color reported by young children at a birthday party: Blue, Green, Red, Blue, Blue, Yellow, Pink, Yellow, Red, Red, Blue, Blue, Blue, Green, Blue. Which of the following would be best to describe a typical value in the dataset? ________________________________________ Select the correct answer below: ________________________________________ the mean the median the mode All of the above can appropriately be used to describe a typical value in the dataset. The following histogram shows the monthly rents reported in a survey of university students. Which of the following would be a reasonable measure of central tendency for this dataset? Select all that apply. Select all that apply: the mean the median the mode none of the above The following dataset represents the dollar amounts of donations collected at the entrance to a free museum during one hour. Donation Amount ($) Frequency 1 1 5 5 10 3 15 1 600 1 Is the median a reasonably good measure of central tendency for this dataset? What if the outlier were removed from consideration? ________________________________________ Select the correct answer below: ________________________________________ The median is a good measure regardless of whether the outlier is included. The median is a very poor measure regardless of whether the outlier is included. The median is a good measure when the outlier is included, but it would be a very poor measure if the outlier were removed from consideration. The median is a very poor measure when the outlier is included, but it would be a good measure if the outlier were removed from consideration. The data value 600 is significantly greater than the other data values in the dataset, so 600 is the outlier. The median is the middle value in the ordered dataset (or, for an odd number of data values, the average of the middle two data values). When the outlier is included, the middle value is the sixth data value in the ordered dataset, which is 5. When the outlier is removed, there are ten data values and the middle two data values are both 5, so the median is 5. In both cases, the number of data values greater than or equal to the median is close to the number of data values less than or equal to the median, so the median is a reasonably good measure of central tendency for the dataset. The following dataset represents the math test scores for a class of 20 students. 90, 60, 85, 100, 100, 90, 100, 75, 100, 95, 95, 85, 30, 100, 40, 15, 100, 90, 70, 80 Identify the best measure of central tendency for this dataset. ________________________________________ Select the correct answer below: ________________________________________ the mode, 100 the mean, 80 the median, 95 the median, 90The mean is 80, but there are 13 data values above the mean compared to 6 data values below the mean, so it is not a good measure of central tendency. The mean is generally not a good measure of central tendency when there are outliers or the dataset is skewed, as is the case here. The following is a dataset of salaries for a company (in thousands). Find the mean and median and determine if the mean or median is the better measure of central tendency. 11,87,85,95,92,93,97 ________________________________________ Select the correct answer below: ________________________________________ Mean =80, Median =92 The mean is the better measure of central tendency. Mean =80, Median =92 The median is the better measure of central tendency. Mean =92, Median =80 The mean is the better measure of central tendency. Mean =92, Median =80 The median is the better measure of central tendency. The following dataset represents the math test scores for a class of 20 students. 90, 85, 95, 100, 100, 90, 100, 65, 100, 85, 80, 95, 80, 100, 85, 75, 100, 90, 90, 75 Would the mode be a good measure of central tendency for this dataset? ________________________________________ Select the correct answer below: ________________________________________ Yes, since this dataset has a well-defined, unique mode. Yes, since this dataset contains no outliers. No, since there are many more data values below the mode than above. No, since there are many more data values above the mode than below. No, since this dataset does not have a well-defined, unique mode. No, since this dataset contains no outliers. No, since there are many more data values below the mode than above. The mode is the data value that appears most often. In this case, the mode is 100. Since 100 appears six times in the dataset and all other values appear fewer than six times. There are 14 data values below the mode and 0 data values above the mode. Since there are many more data values below the mode than above, the mode would not be a good measure of central tendency. The following histogram shows menu prices of entrees at a local restaurant. Identify the best measure of central tendency for this dataset. Select the correct answer below: ________________________________________ the mean the median the mode none of the above The following dataset represents the math test scores for a class of 20 students. 90, 85, 95, 100, 100, 90, 100, 70, 100, 85, 80, 95, 80, 100, 85, 75, 100, 90, 90, 75 How many outliers are in this dataset? ________________________________________ Provide your answer below:0 (An outlier is a data value that is significantly different from other data values in the dataset. The lowest value in the dataset, 70, is not significantly far from the other values (two values in the dataset are 75). The greatest value in the dataset, 100, is not significantly far from the other values (the data value 100 appears six times in the dataset). Since no data value is significantly different from other data values in the dataset, there are no outliers). A trainer would like to find the mean number of sports drinks the people in her class had in the last week. She collects data from 26 participants in her aerobics class. The graph shows the frequency for the number of sports drinks. Find the mean number of sports drinks consumed by the 26 participants, and round your answer to the nearest tenth. Record your answer by dragging the purple point to the mean. The frequency graph shows the frequency for each data value. So, we can compute the mean by adding up all the data values and dividing by the total number of data values. 7⋅1 5⋅2 4⋅3 4⋅4 3⋅5 2⋅6 1⋅7 / 26=3.04 Rounding to the nearest tenth, we have the mean is 3.0. A student at a fashion school would like to find the mean number of hats his fellow students own. He collects data from 25students in his fashion design course. The graph shows the frequency for the number of hats owned by his fellow classmates. Find the mean number of hats owned by the 25 students, and round your answer to the nearest tenth. Record your answer by dragging the purple point to the mean. The frequency graph shows the frequency for each data value. So, we can compute the mean by adding up all the data values and dividing by the total number of data values. 1⋅1 2⋅2 4⋅3 5⋅4 6⋅5 4⋅6 3⋅7 / 25= 4.48 Rounding to the nearest tenth, we have the mean is 4.5. Find the Mean From a Frequency Table Question Given the frequency table below, which equation shows the mean of the set of data? Data Frequency 1 15 3 5 7 10 10 2 ________________________________________ Select the correct answer below: ________________________________________ 120/32=3.75 21/4=5.25 120/21≈5.71 32/4=8 To find the mean from a frequency table, multiply each data value by its frequency. Then add the individual products. 1(15) 3(5) 7(10) 10(2) = 120 Take this sum and divide it by the number of data values, which can be found by adding the numbers in the frequency column. 15 5 10 2 = 32 120 divided by 32 is 3.75. This is the mean of the data from the frequency table. For the grouped frequency table shown below which shows salaries at a company (expressed in thousands), find the midpoint for the second row in the table: Salary Interval Frequency 19-29 12 30-40 15 41-51 9 ________________________________________ Provide your answer below: Midpoint = 35 ________________________________________ Given the frequency table below, what is the estimated mean? Round your answer to two decimal places. Grade Interval Frequency 1‐4 3 5‐8 5 9‐12 2 13‐17 1 ________________________________________ Select the correct answer below: ________________________________________ 5.45 6.91 7.45 19.00 2.5(3) 6.5(5) 10.5(2) 15(1)=76 To find the number of data values, add the frequencies of the data values: 3 5 2 1=11. In order to find the mean, divide 76 by 11 to get 6.91, which is the estimated mean of the data. A manager at a shoe factory would like to find the mean number of breaks taken by employees on a particular Friday. He collects data from 15 fellow coworkers in the factory. The graph shows the frequency for the number of breaks taken during this time period. Find the mean number of breaks for the 15 coworkers, and round your answer to the nearest tenth. Record your answer by dragging the purple point to the mean. The frequency graph shows the frequency for each data value. So, we can compute the mean by adding up all the data values and dividing by the total number of data values. 3⋅1 5⋅2 3⋅3 2⋅4 1⋅5 0⋅6 1⋅7 / 15=2.8 The mean is 2.8. A student would like to find the mean number of people living in households in a neighborhood. She collects data from 65homes in the area. The graph shows the frequency for the number of people living in the homes. Find the mean number of people living in the 65 homes, and round your answer to the nearest tenth. Record your answer by dragging the purple point to the mean. ________________________________________ Provide your answer below: ________________________________________ Mean = 7.4 3 6 7 8 12 14 15 A student would like to find the mean number of people living in households in a neighborhood. She collects data from 65homes in the area. The graph shows the frequency for the number of people living in the homes. Find the mean number of people living in the 65 homes, and round your answer to the nearest tenth. Record your answer by dragging the purple point to the mean. ________________________________________ Provide your answer below: ________________________________________ 1 3 = 3 2 6 = 12 3 7 = 21 4 8 = 32 5 12 = 60 6 14 = 84 7 15 = 105 = 317 / 65 = 4.87 so it’s 4.9 Find the mode of the following amounts (in thousands of dollars) in checking accounts of randomly selected people aged 20-25. 2,4,4,7,2,9,9,2,4,4,11 ________________________________________ Provide your answer below:4 (occurs most often) Find the mode of the following number of states randomly selected travelers at a service plaza visited in the past three years. 18,13,8,8,13,10,13,10,9,18 ________________________________________ Provide your answer below:13 The following is a dataset of the average weekly number of cups of coffee consumed by employees in an office. Find the mean and median and determine if the mean or median is the better measure of central tendency. 5,0,5,2,0,10,7,8,10,21,5,8,2,5,3,5 ________________________________________ Select the correct answer below: ________________________________________ Mean = 5, Median = 6 The median is the better measure of central tendency. Mean = 5, Median = 6 The mean is the better measure of central tendency. Mean = 6, Median = 5 The median is the better measure of central tendency. Mean = 6, Median = 5 The mean is the better measure of central tendency. The following histogram shows the dollar amounts of donations collected by a charitable organization over the course of a month. Identify the best measure of central tendency for this dataset. Select the correct answer below: ________________________________________ the mean the median the mode none of the above The following dataset represents the math test scores for a class of 20 students. 90, 85, 95, 100, 100, 90, 100, 65, 100, 85, 80, 95, 80, 100, 85, 75, 100, 90, 90, 75 Suppose that the last value, 75, was mistakenly recorded as 5. What measure(s) of the typical value in a dataset would be affected by this error? Select all that apply. • The mean would increase. • The mean would decrease. • The median would increase. • The median would decrease. • The mode would increase. • The mode would decrease. • None would be affected. • • [Show More]
Last updated: 1 year ago
Preview 1 out of 26 pages
Reviews( 0 )
Document information
Connected school, study & course
About the document
Uploaded On
Oct 07, 2020
Number of pages
26
Written in

Additional information
This document has been written for:
Uploaded
Oct 07, 2020
Downloads
0
Views
43
.png)

.png)