Mathematics > AQA Questions and Marking Scheme > Week 7 Quiz with answers.pdf (All)
Week 7 Quiz with answers.pdf
Document Content and Description Below
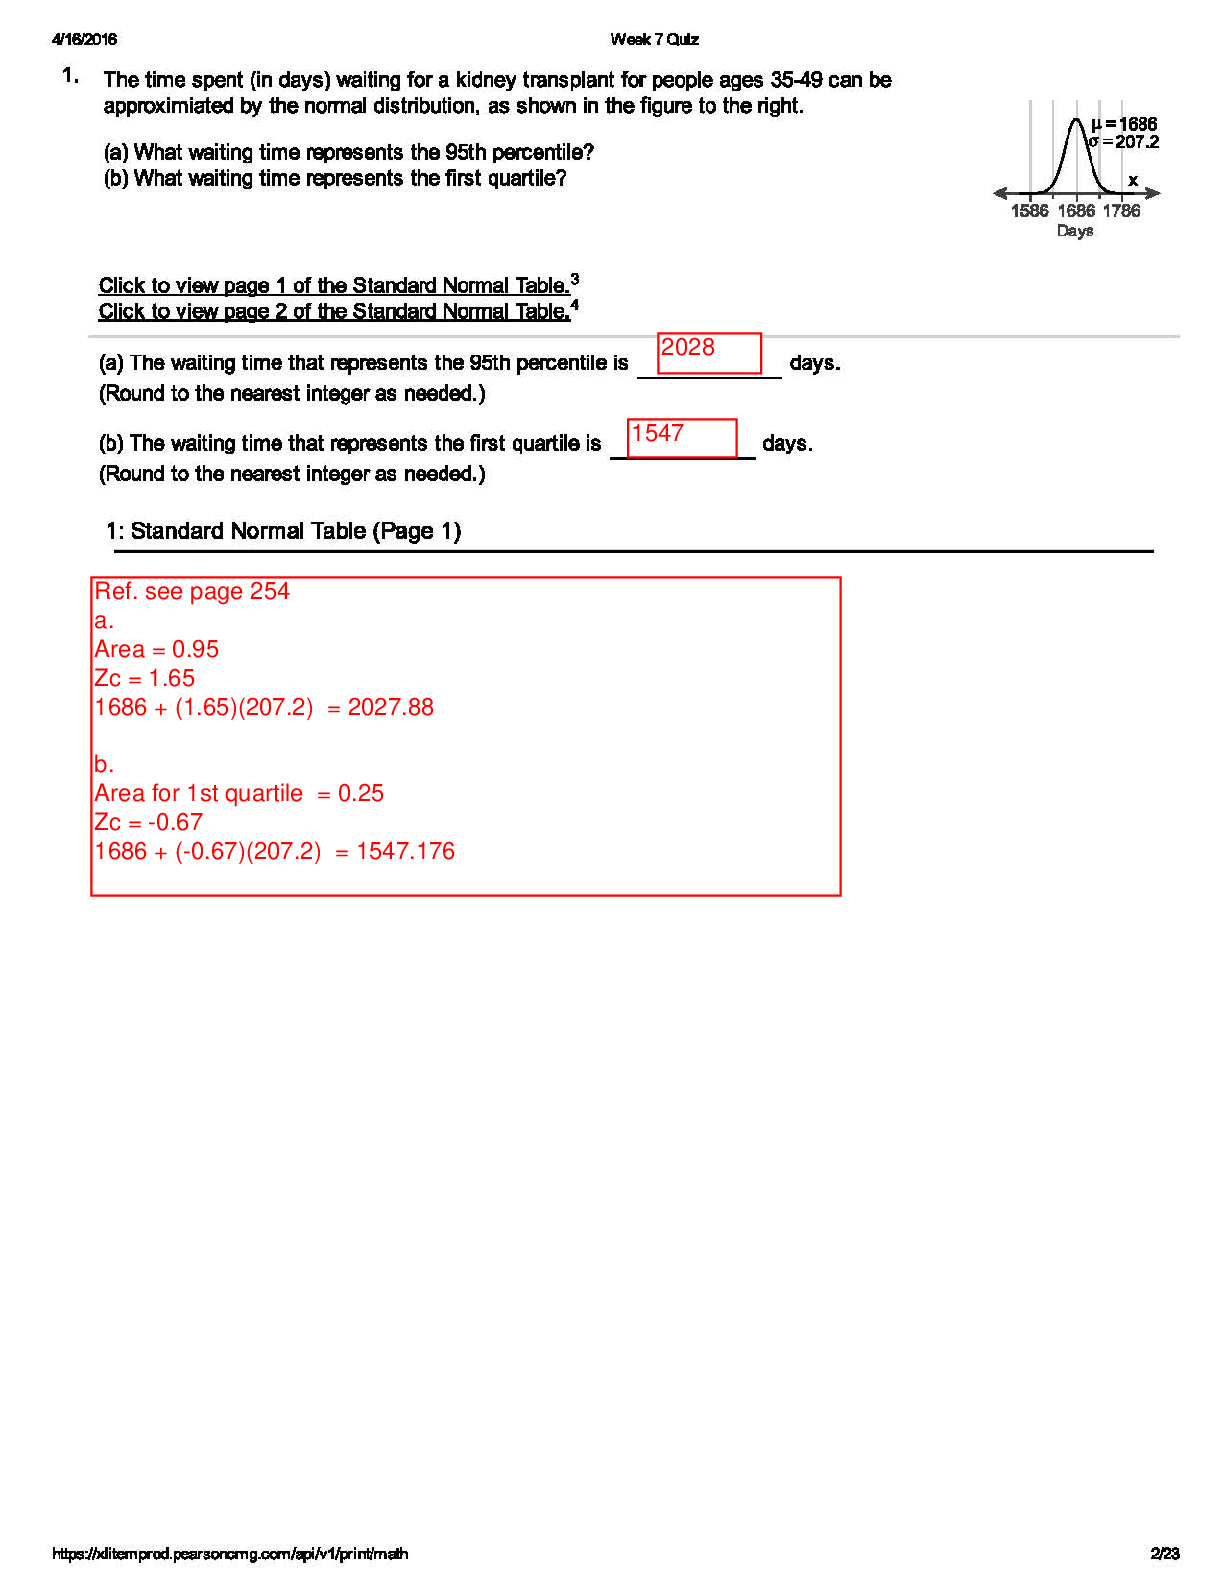
1. Thetimespent (in days) waiting fora kidney transplant tor people ages 35-49 can be approximiated by the normal distribution, as shown inthe figure to theright. (a) What waiting time represents th... e 95th percentile? (b) What waiting time represents the first quartile? Click to viewpage 1 of theStandard Normal Table.3 Click to viewpage 2 of theStandard Normal Table,4 (a) Thewaiting timethatrepresents the 95th percentile is days. (Round to tha nearest intagar as needad.) (b)Thewaiting timethatrepresents the first quartile is days. (Round to tha nearest intagar as needad.) 1: Standard Normal Table (Page 1) [Show More]
Last updated: 1 year ago
Preview 1 out of 20 pages
Reviews( 0 )
Document information
Connected school, study & course
About the document
Uploaded On
Nov 16, 2021
Number of pages
20
Written in

Additional information
This document has been written for:
Uploaded
Nov 16, 2021
Downloads
0
Views
50