Statistics > EXAM > STAT 200 Week 2 Homework Problems (All)
STAT 200 Week 2 Homework Problems
Document Content and Description Below
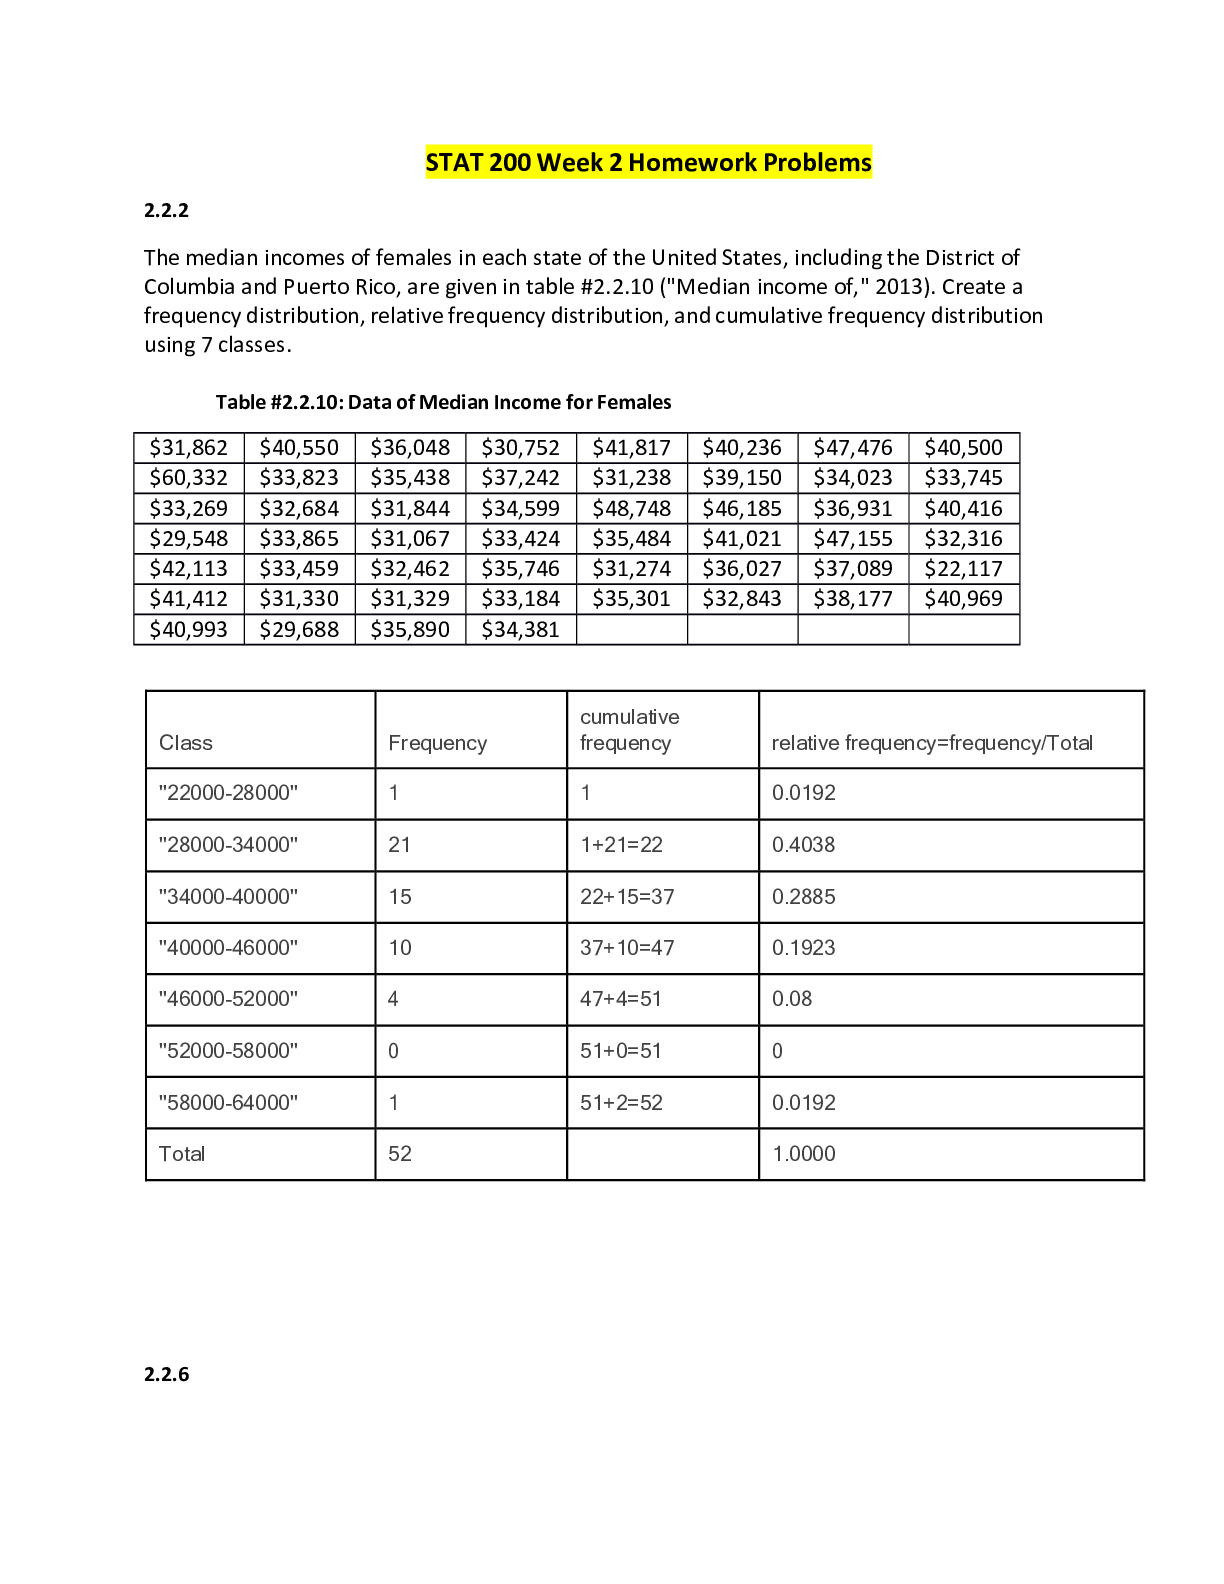
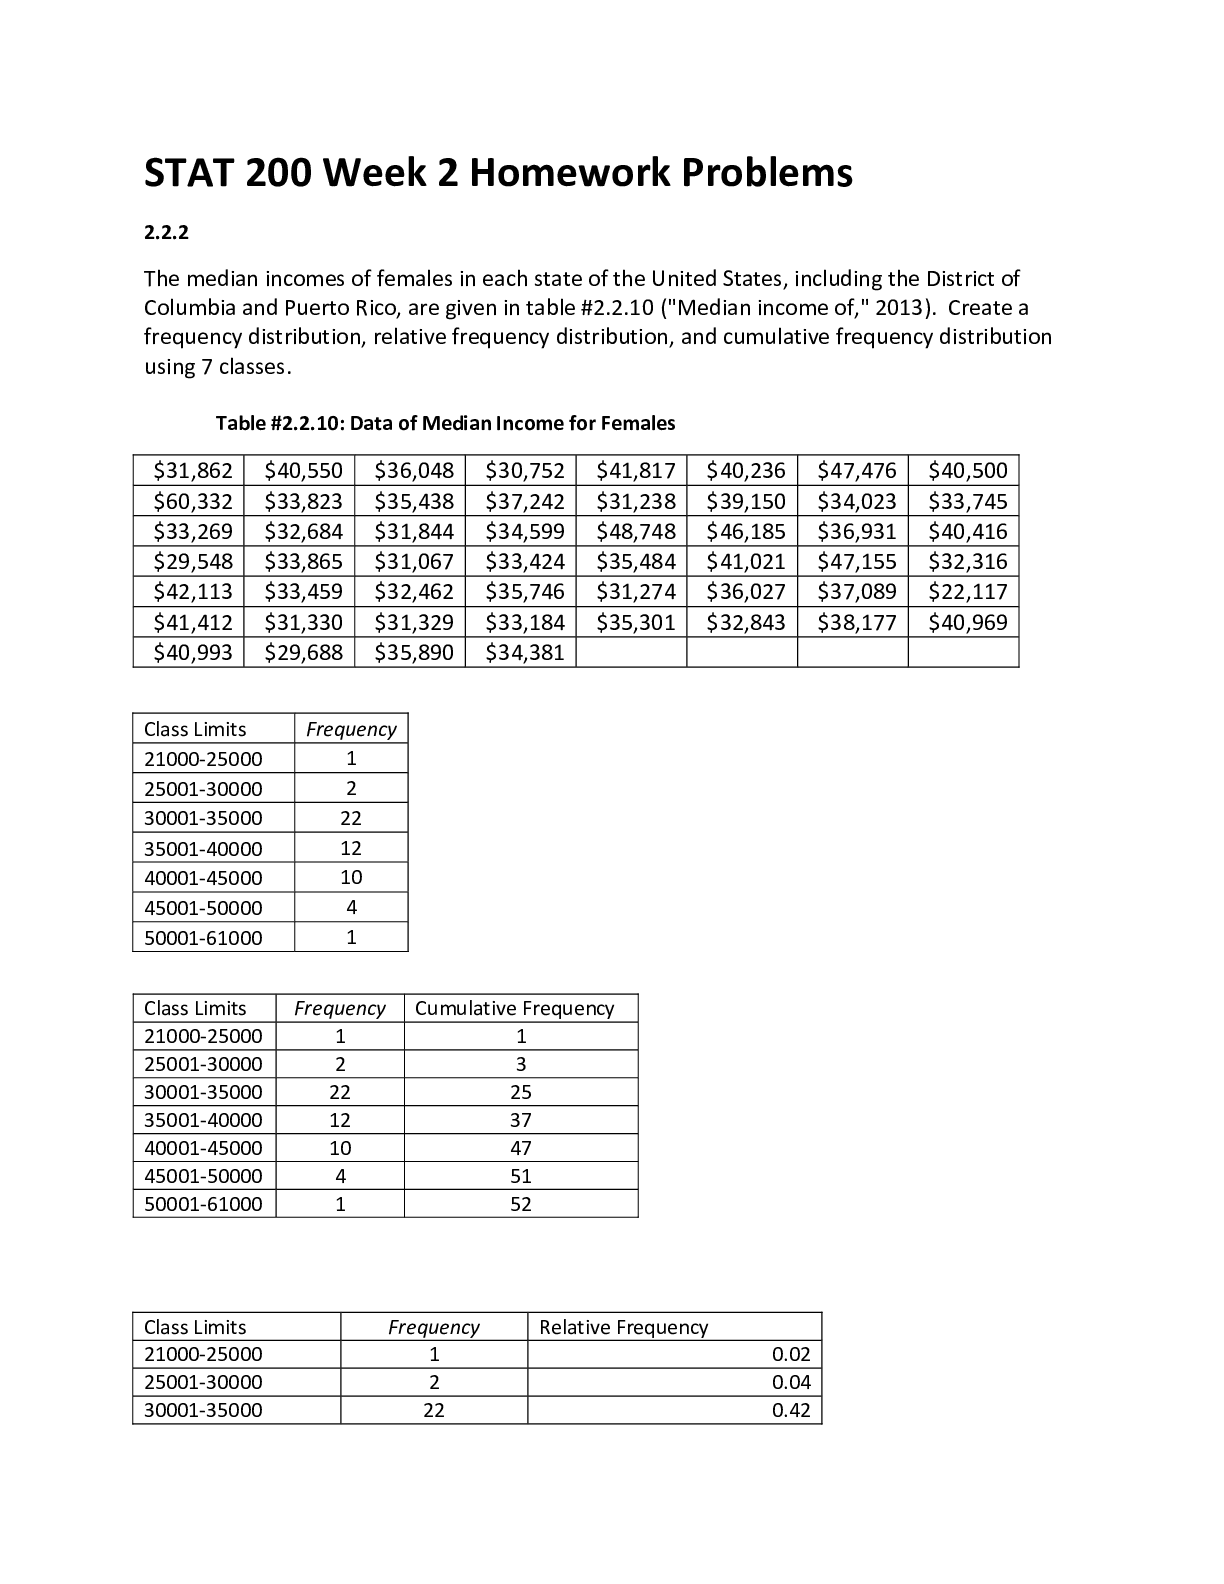
STAT 200 Week 2 Homework Problems 2.2.2 The median incomes of females in each state of the United States, including the District of Columbia and Puerto Rico, are given in table #2.2.10 ("Median income... of," 2013). Create a frequency distribution, relative frequency distribution, and cumulative frequency distribution using 7 classes. Table #2.2.10: Data of Median Income for Females $31,862 $40,550 $36,048 $30,752 $41,817 $40,236 $47,476 $40,500 $60,332 $33,823 $35,438 $37,242 $31,238 $39,150 $34,023 $33,745 $33,269 $32,684 $31,844 $34,599 $48,748 $46,185 $36,931 $40,416 $29,548 $33,865 $31,067 $33,424 $35,484 $41,021 $47,155 $32,316 $42,113 $33,459 $32,462 $35,746 $31,274 $36,027 $37,089 $22,117 $41,412 $31,330 $31,329 $33,184 $35,301 $32,843 $38,177 $40,969 $40,993 $29,688 $35,890 $34,381 Frequency distribution: Class Frequency 21000-25000 1 25001-30000 2 30001-35000 22 35001-40000 12 40001-45000 10 45001-50001 4 50001-61000 1 Relative Frequency; Class Frequency Relative frequency 21000-25000 1 0.02 25001-30000 2 0.04 30001-35000 22 0.42 35001-40000 12 0.23 40001-45000 10 0.19 [Show More]
Last updated: 1 year ago
Preview 1 out of 8 pages
Reviews( 0 )
Document information
Connected school, study & course
About the document
Uploaded On
Sep 23, 2021
Number of pages
8
Written in

Additional information
This document has been written for:
Uploaded
Sep 23, 2021
Downloads
0
Views
26


 (1).png)
.png)
.png)


.png)
.png)
