Statistics > QUESTIONS & ANSWERS > Quiz Submissions - Week 1: Quiz 1 - STAT 200 6372 Introduction to Statistics (2202) / STAT 200 week (All)
Quiz Submissions - Week 1: Quiz 1 - STAT 200 6372 Introduction to Statistics (2202) / STAT 200 week 1 quiz 1 (2021)
Document Content and Description Below
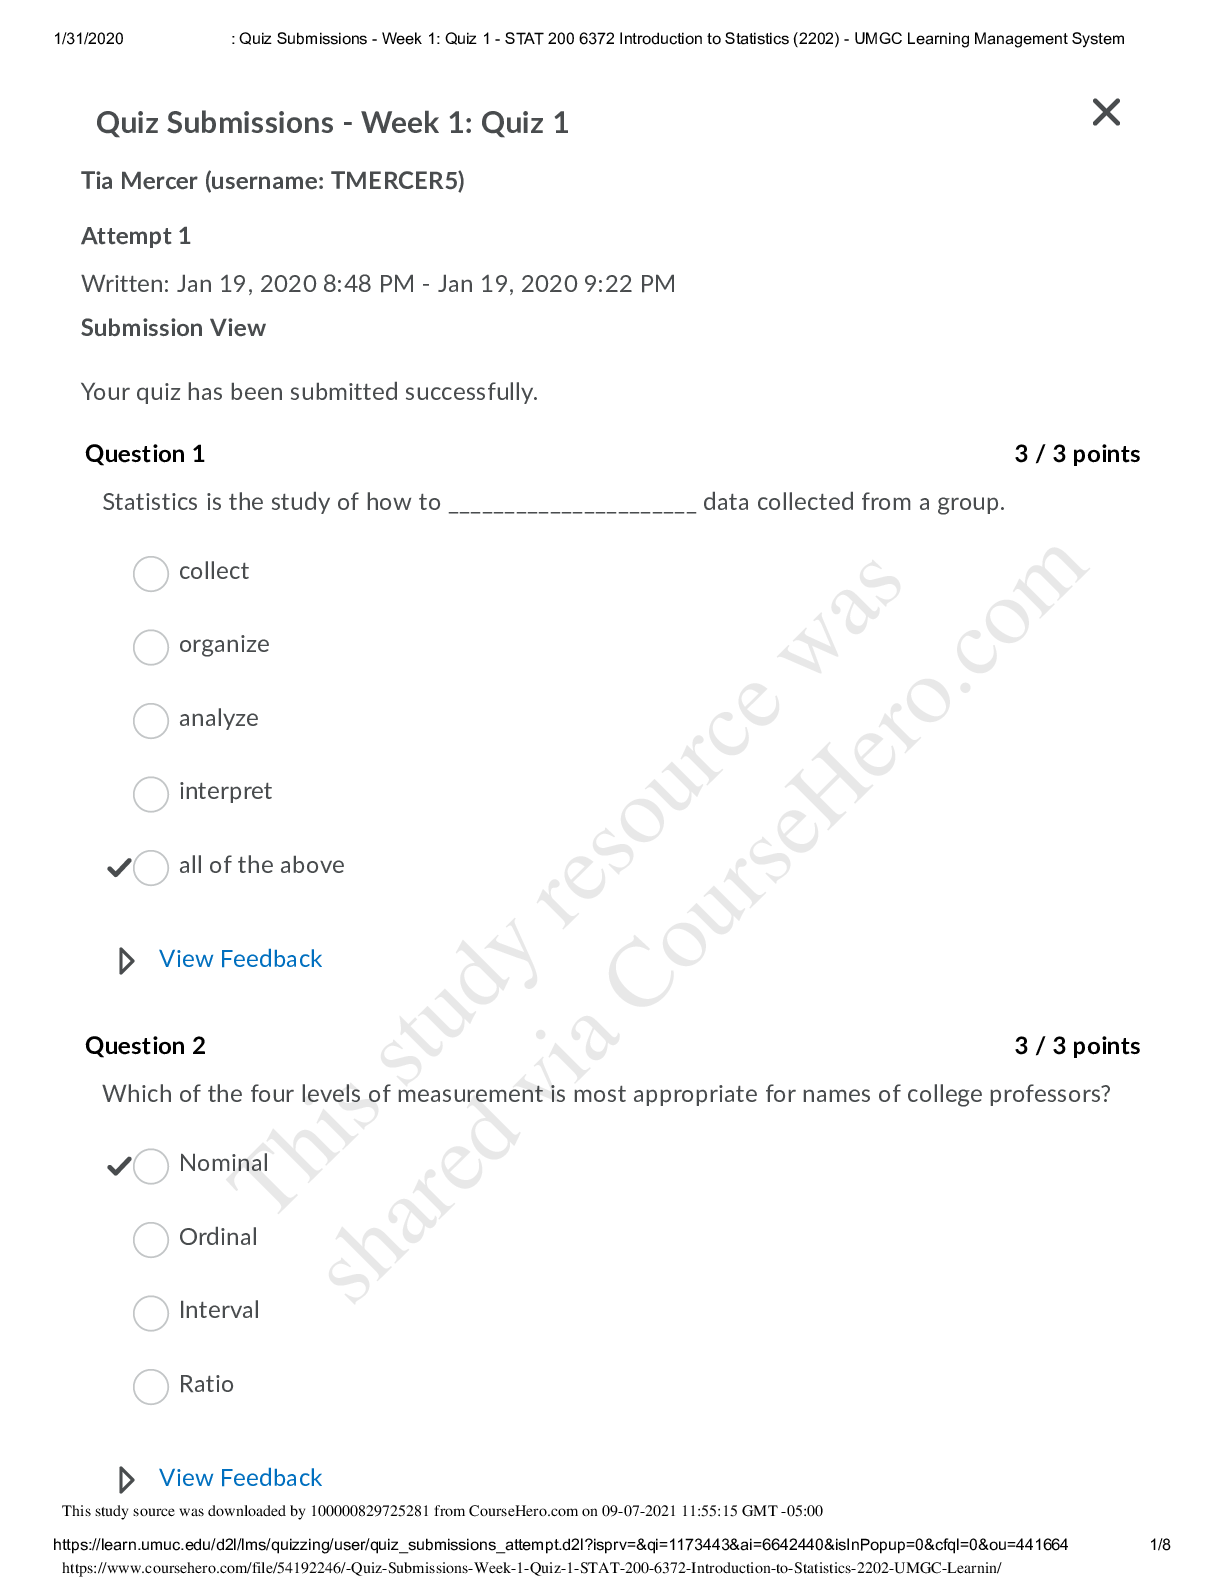
1/31/2021 : Quiz Submissions - Week 1: Quiz 1 - STAT 200 6372 Introduction to Statistics (2202) - UMGC Learning Management System 1/8 Quiz Submissions - Week 1: Quiz 1 Tia Mercer (username: TMERCER5) ... Attempt 1 Submission View Your quiz has been submitted successfully. Question 1 3 / 3 points Statistics is the study of how to _____________________ data collected from a group. collect organize analyze interpret all of the above View Feedback Question 2 3 / 3 points Which of the four levels of measurement is most appropriate for names of college professors? Nominal Ordinal Interval Ratio View Feedback1/31/2021 : Quiz Submissions - Week 1: Quiz 1 - STAT 200 6372 Introduction to Statistics (2202) - UMGC Learning Management System 2/8 Question 3 3 / 3 points Which of the following is a numerical measurement describing some characteristic of a sample? Parameter Statistic Data None of the above View Feedback Question 4 3 / 3 points Prof R has a truck that has an engine with 8 cylinders. Is the given value is from a discrete or continuous data set? Explain why. A discrete data set because there are a finite number of possible values (i.e. you can count them). A continuous data set because there are infinitely many possible values and those values can be counted. A continuous data set because there are infinitely many possible values and those values can be measured. The data set is neither continuous or discrete. View Feedback Question 5 3 / 3 points If a tax auditor selects every 10,000th tax return that is submitted, which form of sampling is he/she using? Convenience Stratified1/31/2021 : Quiz Submissions - Week 1: Quiz 1 - STAT 200 6372 Introduction to Statistics (2202) - UMGC Learning Management System 3/8 Simple Random Sample Systematic Cluster View Feedback Question 6 3 / 3 points Determine whether the sample described below is a simple random sample. In order to test for a difference in the way that workers and non workers purchase houses, a research institution polls exactly 905 adult workers and 905 adult non workers randomly selected from adults in the United States. The sample is not a simple random sample because every sample of size n = 1810 does not have the same chance of being selected. The sample is a simple random sample because each individual adult has the same chance of being selected. The sample is a simple random sample because every sample of size n = 1810 has the same chance of being selected. The sample is not a simple random sample because each individual adult does not have the same chance of being selected. View Feedback Question 7 3 / 3 points In a survey sponsored by a company, 13,792 people were asked what contributes most to their sadness, and 38% of the respondents said that it was their partner. Is the study described above an observational study or an experiment? Why? The study is an experiment because it was done with statistical methods. The study is an observational study because the responses of the survey subjects were observed.1/31/2020 : Quiz Submissions - Week 1: Quiz 1 - STAT 200 6372 Introduction to Statistics (2202) - UMGC Learning Management System 4/8 The study is an experiment because the survey subjects were given a treatment. The study is an observational study because the survey subjects were not given any treatment. View Feedback Question 8 3 / 3 points You collect the weights of tagged fish in a tank. You then put an extra protein fish food in water for the fish and then measure their weight a month later. Are the two samples matched pairs or not? Why or why not? No, these samples are not matched pairs since you are using the same fish in each sample and you randomly select the fish before weighing them. No, these samples are not matched pairs since you are using the same fish in each sample and you can match up the fish's before weight with their after weight. Yes, these samples are matched pairs since you are using the same fish in each sample and you randomly select the fish before weighing them. Yes, the samples are matched since you are using the same fish in each sample and you can match up the fish's before weight with their after weight. View Feedback Question 9 0 / 3 points Determine whether the source given below has the potential to create a bias in a statistical study. Explain why or why not. A certain medical organization tends to oppose the use of meat and dairy products in our diets, and that organization has received hundreds of thousands of dollars in funding from an animal rights foundation. There does not appear to be a potential to create a bias. The organization would not gain from putting spin on the results. There does appear to be a potential to create a bias. There is an incentive to produce results that are in line with the organization's creed and that of its funders.1/31/2020 : Quiz Submissions - Week 1: Quiz 1 - STAT 200 6372 Introduction to Statistics (2202) - UMGC Learning Management System 5/8 There does appear to be a potential to create a bias. There is an incentive to make the results statistically insignificant. There does not appear to be a potential to create a bias. The organization is reputable and has many professional and credible members. View Feedback Question 10 3 / 3 points If the University of Maryland University College obtained word counts from the most popular novels of the past five years, there would not be the potential to create bias. UMUC would not gain from "putting a spin" on the results. True False View Feedback Question 11 4 / 4 points To analyze how Arizona workers ages 16 or older travel to work the percentage of workers using carpool, private vehicle (alone), and public transportation was collected and is presented in the table below. Select the proper bar graph for this data set. Transportation type Percentage Carpool 11.6% Private Vehicle (alone) 65.8% Public Transportation 2.0% Other 20.6% View Feedback1/31/2020 : Quiz Submissions - Week 1: Quiz 1 - STAT 200 6372 Introduction to Statistics (2202) - UMGC Learning Management System 6/8 Question 12 4 / 4 points The number of deaths in the US due to carbon monoxide (CO) poisoning from generators from the years 1999 to 2011 are shown in the table below. Region Number of deaths from CO while using a generator Urban 410 Sub-Urban 79 Large Rural 68 Small Rural / Isolated 111 What is the relative frequency for deaths due to carbon monoxide poisoning from a generator in Large Rural areas? 0.68 0.166 0.102 0.068 View Feedback Question 13 4 / 4 points The number of deaths in the US due to carbon monoxide (CO) poisoning from generators for regions of different population size are shown in the table below. The data is from the years 1999 to 2011. This s :15 GMT -05:00 Region Number of deaths from CO while using a generator Urban 410 Sub-Urban 79 Large Rural tudy source was downloaded by 10000 68 1 from CourseH on 09-07-2021 11:551/31/2020 : Quiz Submissions - Week 1: Quiz 1 - STAT 200 6372 Introduction to Statistics (2202) - UMGC Learning Management System 7/8 Small Rural / Isolated 111 Which of the following pie charts correctly depicts this information? View Feedback Question 14 4 / 4 points The number of deaths in the US due to carbon monoxide (CO) poisoning from generators for regions of different population size are shown in the table below. The data is from the years 1999 to 2011. Region Number of deaths from CO while using a generator Urban 410 Sub-Urban 79 Large Rural 68 Small Rural / Isolated 111 Which chart below is the proper Pareto chart to depict this data?1/31/2020 : Quiz Submissions - Week 1: Quiz 1 - STAT 200 6372 Introduction to Statistics (2202) - UMGC Learning Management System 8/8 View Feedback Question 15 4 / 4 points Four friends decided to keep track of their activities on a given Tuesday. They tracked 5 categories: Eating, Commuting, Working, Exercising, and Entertainment (reading, watching TV, Scrolling Facebook, etc.), then reported their times rounded to the nearest hour. The results of their activities are given by: Time in Hours Name Eating Commuting Working Exercising Entertainment Scott 3 0 9 0 3 Meghan 2 1 8 2 4 Brett 2 2 10 1 2 Sophie 2 2 8 3 1 Which Multiple Bar Chart below correct depicts this data? View Feedback Attempt Score: 47 / 50 - 94 % Overall Grade (highest attempt): 47 / 50 - 94 % Done [Show More]
Last updated: 1 year ago
Preview 1 out of 8 pages
.png)
Reviews( 0 )
Document information
Connected school, study & course
About the document
Uploaded On
Sep 08, 2021
Number of pages
8
Written in

Additional information
This document has been written for:
Uploaded
Sep 08, 2021
Downloads
0
Views
63


.png)
.png)
.png)

.png)


.png)
