Military Science > EXAM > Week 4 Knowledge Check Homework Practice Questions - SOLVED (All)
Week 4 Knowledge Check Homework Practice Questions - SOLVED
Document Content and Description Below
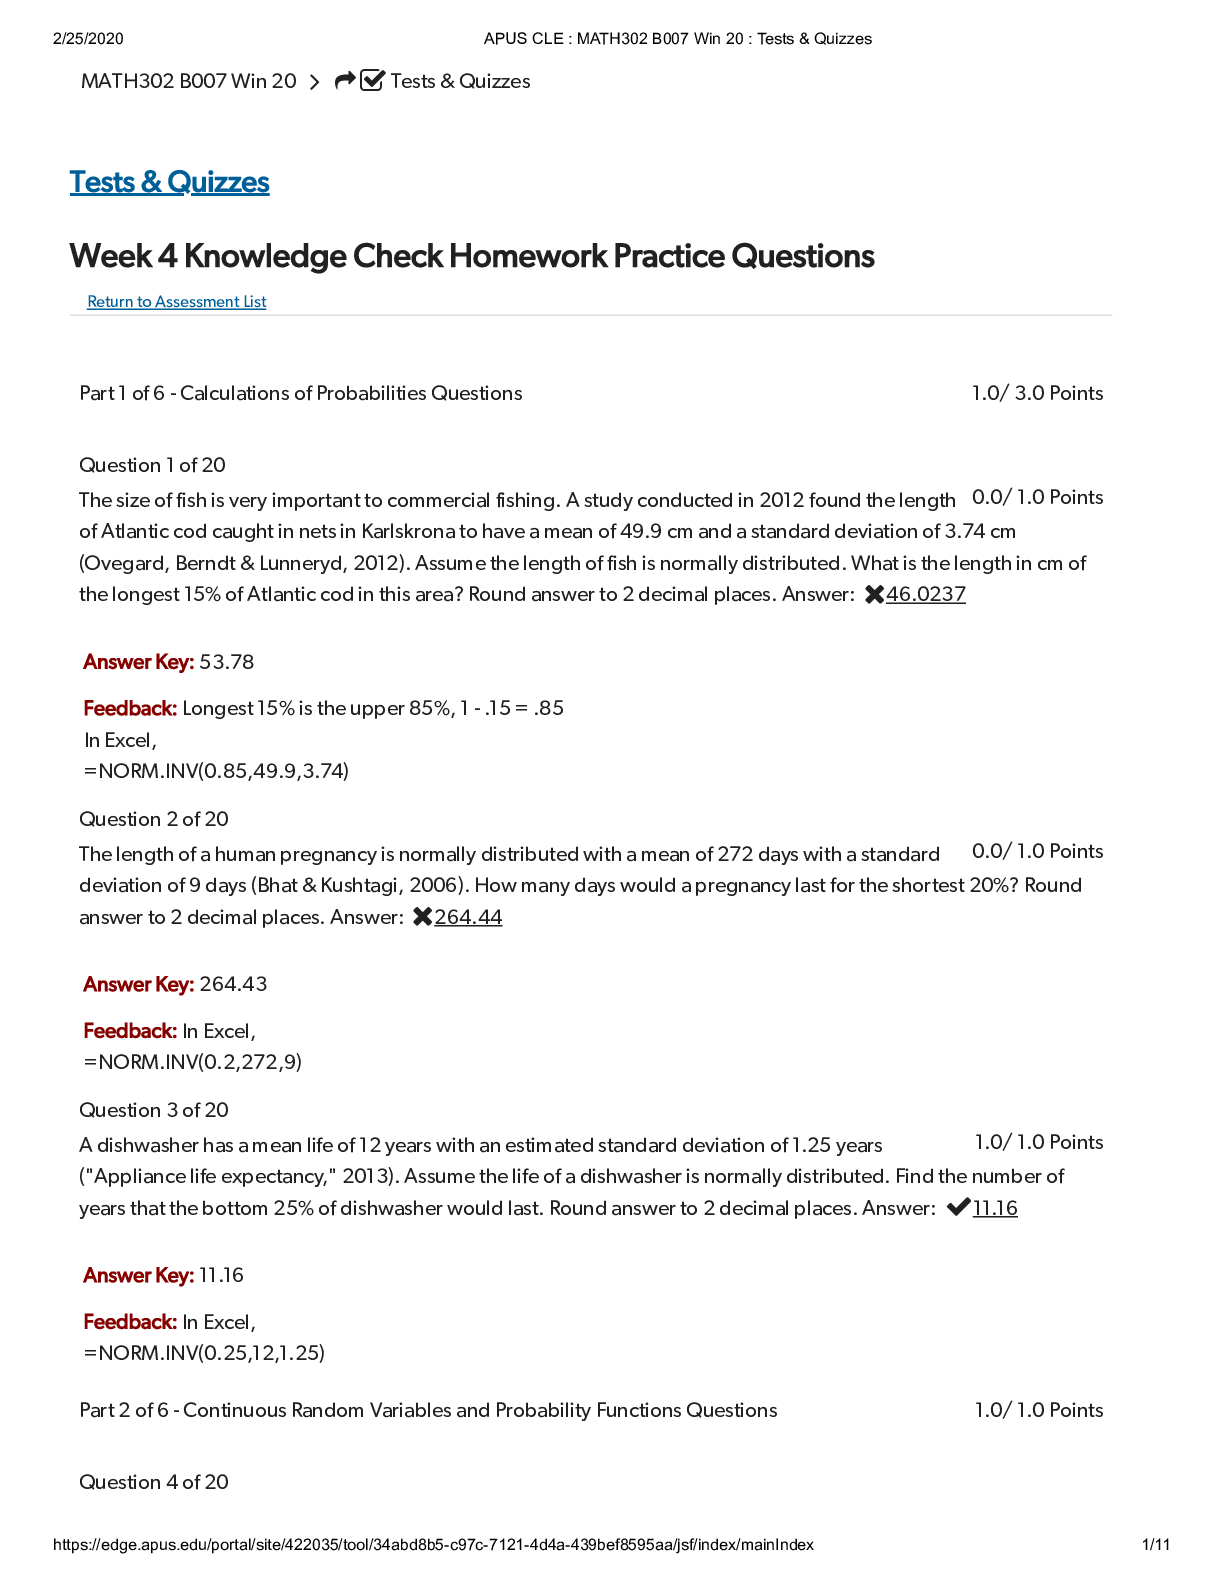
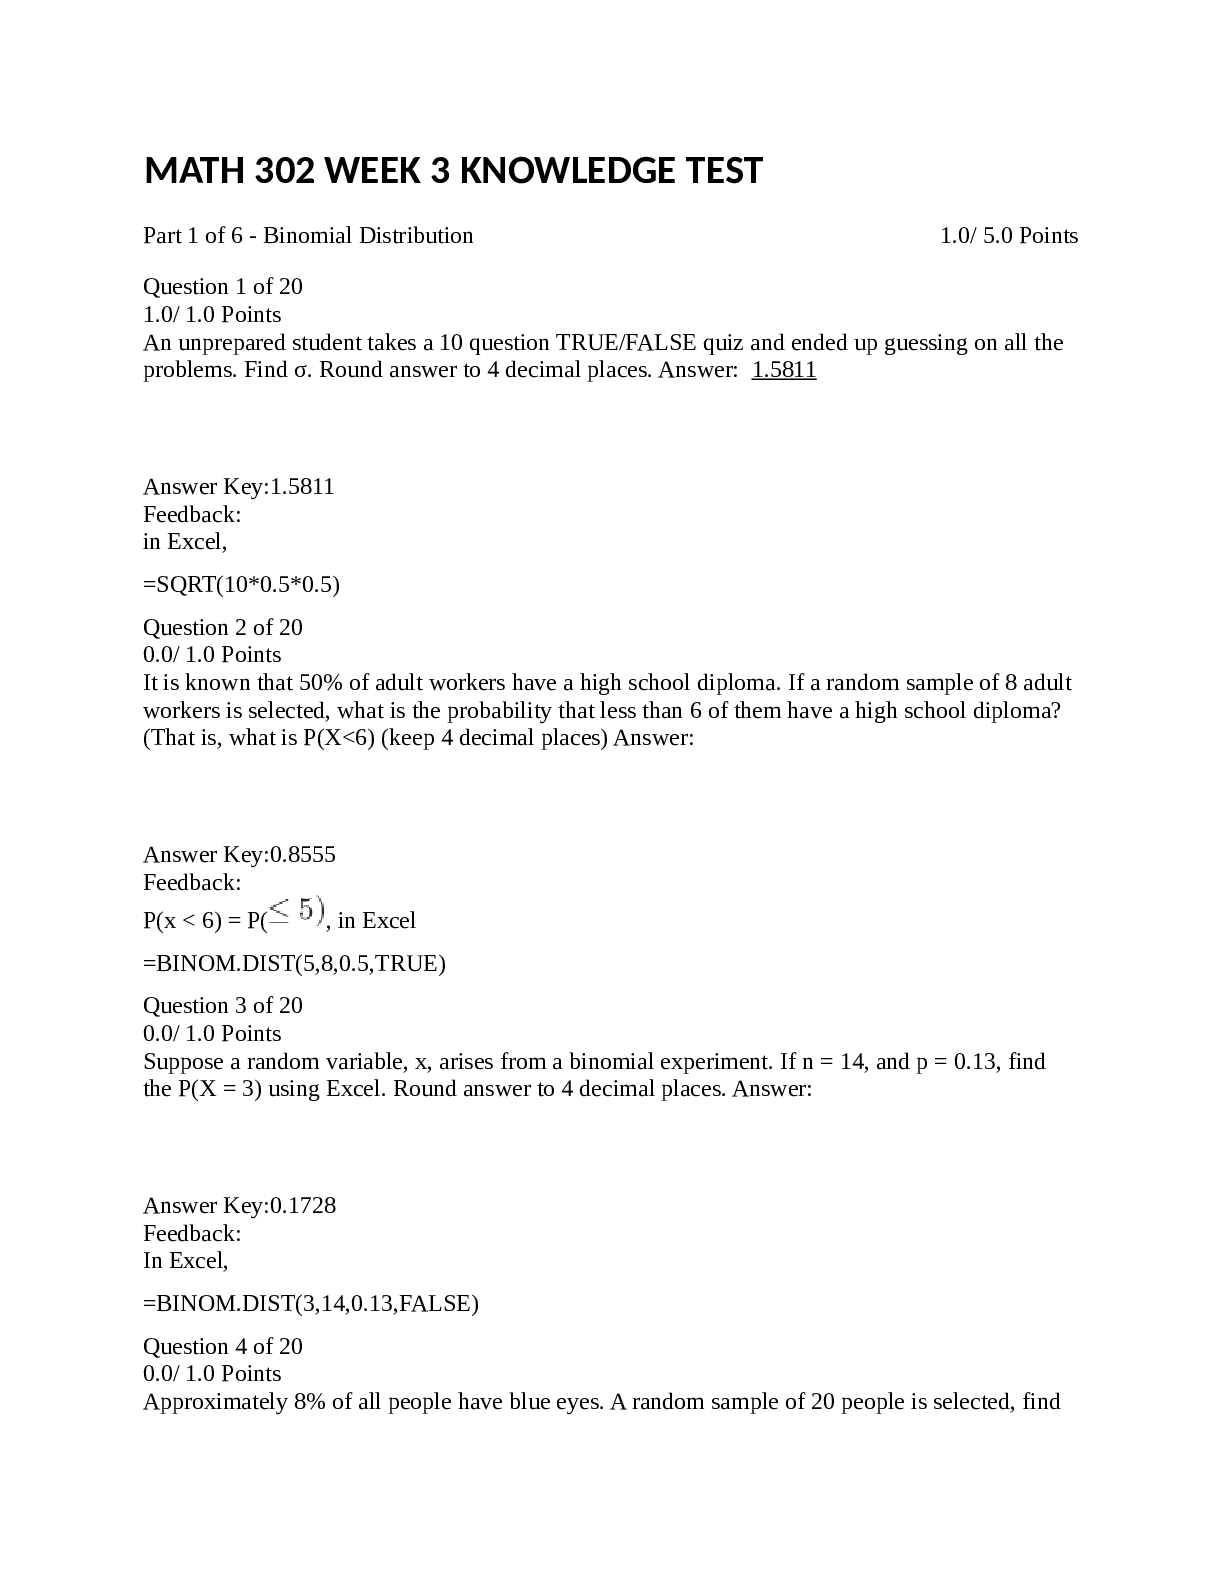
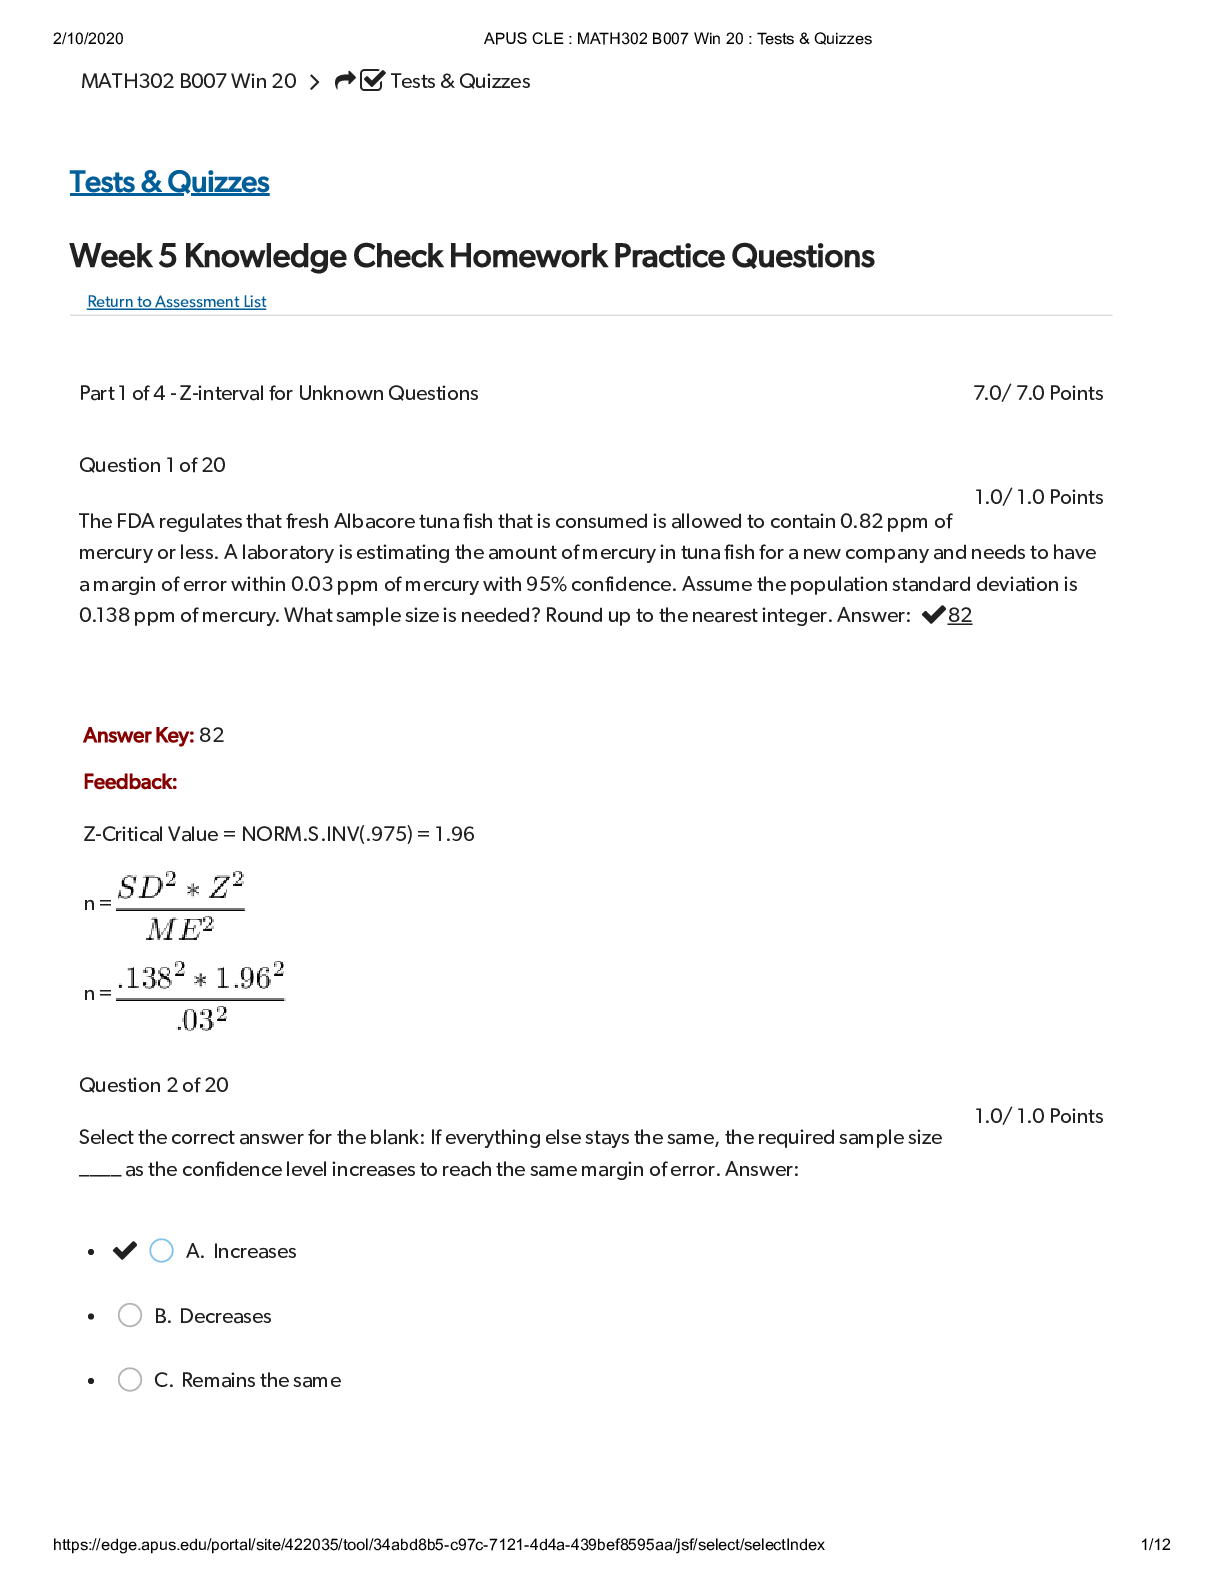
Week 4 Knowledge Check Homework Practice Questions Return to Assessment List Part 1 of 6 - Calculations of Probabilities Questions 1.0/ 3.0 Points Question 1 of 20 The size of fish is very importa... nt to commercial fishing. A study conducted in 2012 found the length of Atlantic cod caught in nets in Karlskrona to have a mean of 49.9 cm and a standard deviation of 3.74 cm (Ovegard, Berndt & Lunneryd, 2012). Assume the length of fish is normally distributed. What is the length in cm of the longest 15% of Atlantic cod in this area? Round answer to 2 decimal places. Answer: 46.0237 Answer Key: 53.78 Feedback: Longest 15% is the upper 85%, 1 - .15 = .85 In Excel, =NORM.INV(0.85,49.9,3.74) Question 2 of 20 The length of a human pregnancy is normally distributed with a mean of 272 days with a standard deviation of 9 days (Bhat & Kushtagi, 2006). How many days would a pregnancy last for the shortest 20%? Round answer to 2 decimal places. Answer: 264.44 Answer Key: 264.43 Feedback: In Excel, =NORM.INV(0.2,272,9) Question 3 of 20 A dishwasher has a mean life of 12 years with an estimated standard deviation of 1.25 years ("Appliance life expectancy," 2013). Assume the life of a dishwasher is normally distributed. Find the number of years that the bottom 25% of dishwasher would last. Round answer to 2 decimal places. Answer: 11.16 Answer Key: 11.16 Feedback: In Excel, =NORM.INV(0.25,12,1.25) Part 2 of 6 - Continuous Random Variables and Probability Functions Questions 1.0/ 1.0 Points Question 4 of 20 MATH302 B007 Win 20 Tests & Quizzes Tests & Quizzes 2/25/2020 APUS CLE : MATH302 B007 Win 20 : Tests & Quizzes https://edge.apus.edu/portal/site/422035/tool/34abd8b5-c97c-7121-4d4a-439bef8595aa/jsf/index/mainIndex 2/11 1.0/ 1.0 Points 1.0/ 1.0 Points Find the probability that falls in the shaded area. A. 0.125 B. 0.438 C. 0.40 D. 0.50 Answer Key: C Feedback: (1/30)(16 - 4) Part 3 of 6 - The Central Limit Theorem Questions 1.0/ 1.0 Points Question 5 of 20 A population has the distribution given by the following histogram with a mean of 0.6 and standard deviation of 0.2. [Show More]
Last updated: 1 year ago
Preview 1 out of 11 pages
Also available in bundle (1)
WEEK 1-8 MATH 302 TESTS, KNOWLEDGE TEST & PRACTICE QUESTIONS - (SOLVED)
WEEK 1-8 MATH 302 TESTS, KNOWLEDGE TEST & PRACTICE QUESTIONS - (SOLVED)
By Victor 2 years ago
$19.5
11
Reviews( 0 )
Document information
Connected school, study & course
About the document
Uploaded On
Aug 25, 2021
Number of pages
11
Written in

Additional information
This document has been written for:
Uploaded
Aug 25, 2021
Downloads
0
Views
164


.png)