Mathematics > EXAM > MATH 221 Week 3 Quiz With Answers (Solved And Verified Solutions) Latest 2020 (All)
MATH 221 Week 3 Quiz With Answers (Solved And Verified Solutions) Latest 2020
Document Content and Description Below
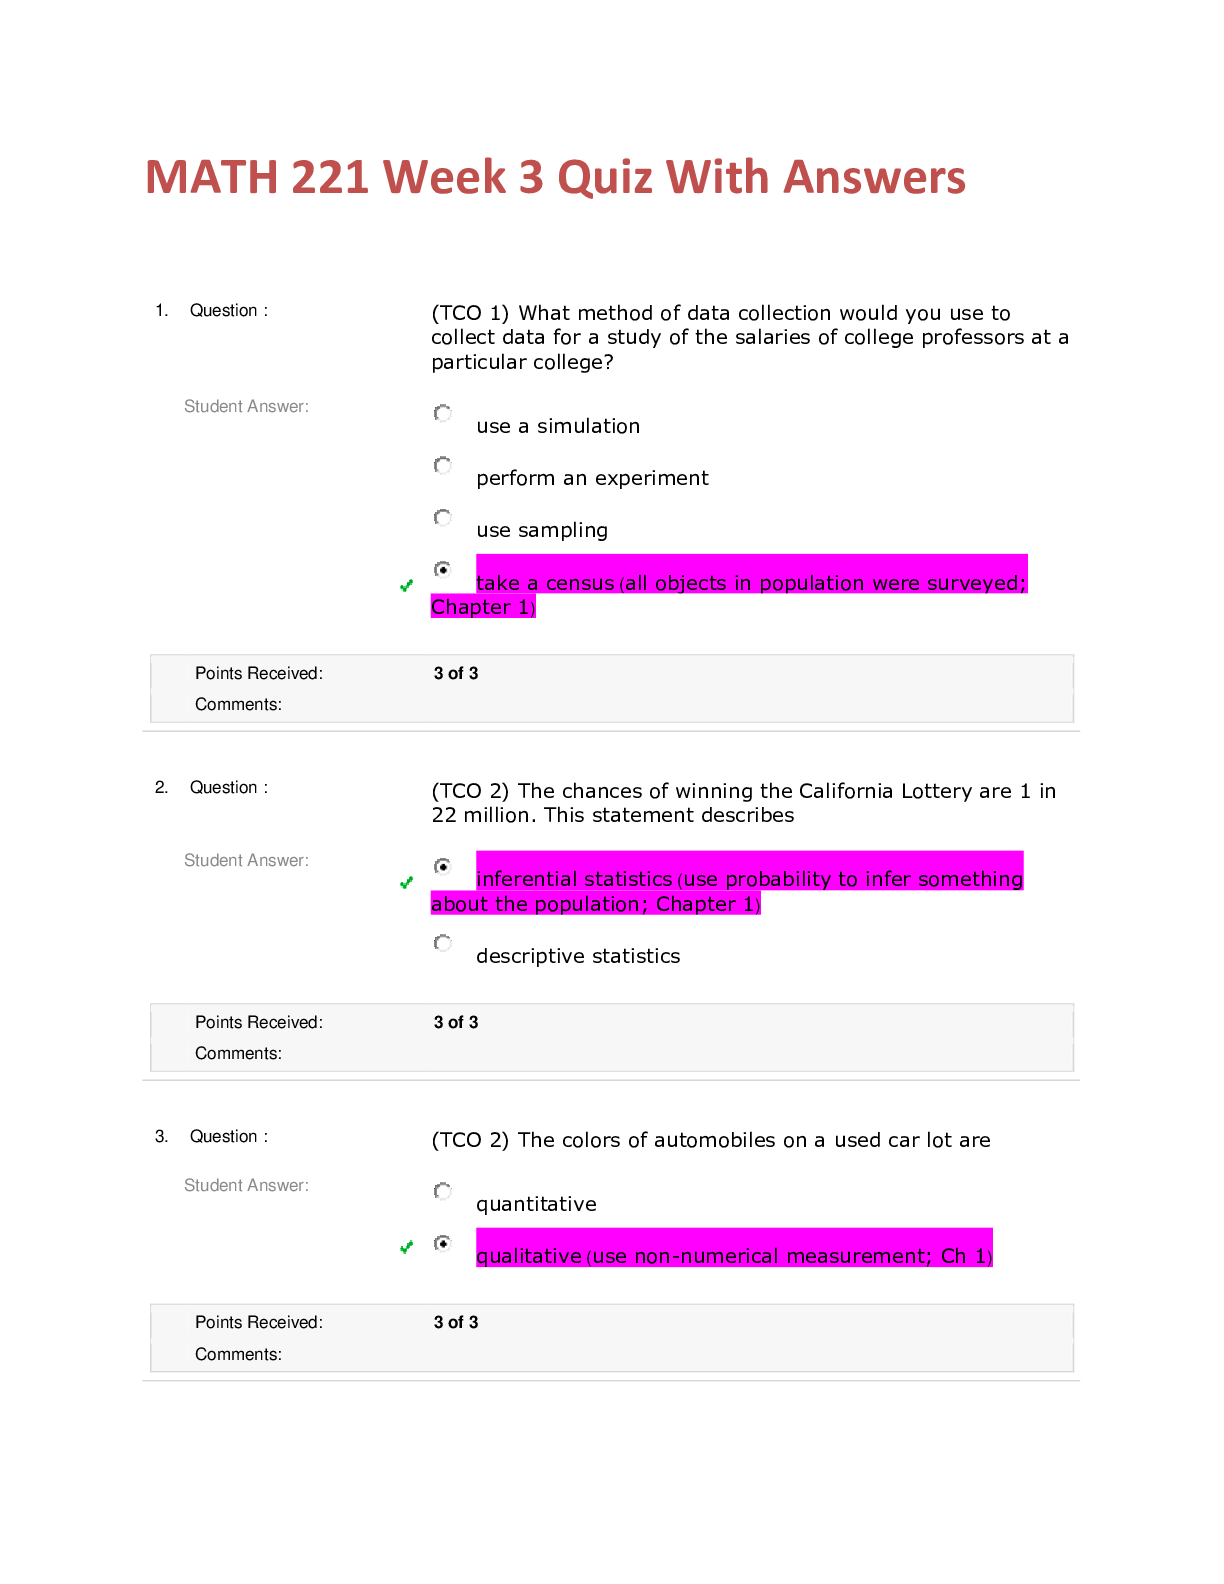
MATH 221 Week 3 Quiz With Answers 1. Question : (TCO 1) What method of data collection would you use to collect data for a study of the salaries of college professors at a particular college? ... 2. Question : (TCO 2) The chances of winning the California Lottery are 1 in 22 million. This statement describes 3. Question : (TCO 2) The colors of automobiles on a used car lot are nts: 4. Question : (TCO 1) A lobbyist for a major airspace firm assigns a number to each legislator and then uses a computer to randomly generate ten numbers. The lobbyist contacts the legislators corresponding to these numbers. What sampling technique is used? 5. Question : (TCO 2) A recent survey by a national women’s association showed that the average salary of 3500 of its 65,000 membership was $73,000. This number is a Student Answer: parameter statistic (calculated from a sample; Ch 2) Points Received: 3 of 3 Comments: 6. Question : (TCO 2) Which is used more often? S 7. Question : (TCO 2) Suppose the standard deviation is 13.1. What is the variance? 8. Question : (TCO 10) These data represent the ages of drivers and the number of accidents reported for each age group in Pennsylvania for a selected year. (Age, Number of Accidents) (16, 6605), (17, 8932), (18, 8506), (19, 7349), (20, 6458), (21, 5974) Find the equation of the regression line for the given data. 9. Question : (TCO 9) A researcher found a significant relationship between a student’s IQ, a, the grade point average, b, and the score, y, on the verbal section of the SAT test. The relationship can be represented by the multiple regression equation y = 250 + 1.5a + 80b. Predict the SAT verbal score (to the nearest whole number) of a student whose IQ is 130 and grade point average is 2.2. 10. Question : (TCO 9) Interpret an r value of 0.11. Student Answer: strong negative correlation weak positive correlation (Chapter 9) strong positive correlation no correlation Points Received: 0 of 3 Comments: 1. Question : (TCO 3) Use this table to answer the questions. Height (in inches) Frequency 2. Question : (TCO 3) The heights in inches of 18 randomly selected adult males in LA are listed as: 70, 69, 72, 57, 70, 66, 69, 73, 80, 68, 71, 68, 72, 67, 58, 74, 81, 72. [Show More]
Last updated: 1 year ago
Preview 1 out of 6 pages
Reviews( 0 )
Document information
Connected school, study & course
About the document
Uploaded On
Sep 02, 2020
Number of pages
6
Written in

Additional information
This document has been written for:
Uploaded
Sep 02, 2020
Downloads
0
Views
44


.png)